A survey of the Wolf-Rayet population of the barred, spiral galaxy NGC 1313††thanks: Based on observations made with ESO telescopes at the Paranal Observatory under programme ID 076.B-0071 and with archival NASA/ESA Hubble Space Telescope, obtained from the ESO/ST-ECF Science Archive Facility.
Abstract
We present a VLT/FORS1 survey of Wolf-Rayet (WR) stars in the spiral galaxy NGC 1313. In total, 94 WR candidate sources have been identified from narrow-band imaging. Of these, 82 have been spectroscopically observed, for which WR emission features are confirmed in 70 cases, one of which also exhibits strong nebular He ii 4686 emission. We also detect strong nebular He ii 4686 emission within two other regions of NGC 1313, one of which is a possible supernova remnant. Nebular properties confirm that NGC 1313 has a metal-content log(O/H)+12=8.230.06, in good agreement with previous studies. From continuum subtracted H images we infer a global star formation rate of 0.6 M⊙yr-1. Using template LMC WR stars, spectroscopy reveals that NGC 1313 hosts a minimum of 84 WR stars. Our census comprises 51 WN stars, including a rare WN/C transition star plus 32 WC stars. In addition, we identify one WO star which represents the first such case identified beyond the Local Group. The bright giant H ii region PES 1, comparable in H luminosity to NGC 595 in M 33, is found to host a minimum of 17 WR stars. The remaining photometric candidates generally display photometric properties consistent with WN stars, such that we expect a global WR population of 115 stars with N(WR)/N(O)0.01 and N(WC)/N(WN)0.4.
keywords:
galaxies: individual: NGC 1313 – stars: Wolf-Rayet1 Introduction
Wolf-Rayet (WR) stars are evolved, He-burning stars that are descended from the most massive O stars. They have a profound influence on their surroundings since intense stellar winds continually interact with their local environment returning mechanical energy and processed material to the ISM. In recent years, WR stars have received renewed interest since they are believed to be the immediate precursors of Type Ib/c supernovae (SNe) and long -ray bursts (Crowther, 2007).
WR stars are characterised by strong, broad, emission lines of nitrogen (WN), carbon (WC) or oxygen (WO). Their unique spectral appearance allows WR stars to be readily identified in external galaxies and have been detected as individual stars in nearby galaxies (e.g. Massey & Johnson, 1998) and in the integrated starlight of more distant galaxies (Schaerer et al., 1999). WR stars are expected to be present within instantaneous bursts between 3 and 5 Myrs, such that they trace recent star formation.
The advent of 8m class telescopes has allowed WR surveys to move beyond the Local Group, with recent work proving very successful at locating large numbers of WR stars in nearby (5 Mpc) galaxies (Schild et al., 2003; Hadfield et al., 2005). Using a combination of narrow-band imaging sensitive to WR emission features, candidates may be readily identified in external galaxies, with follow-up spectroscopy establishing their nature. Consequently, the WR population of several, nearby galaxies have been studied, increasing the statistics of WR populations across a broad range of metallicities. In addition, since WR stars are expected to be the immediate precursors of SNe and -ray bursts, it is vital we map the WR population in nearby galaxies.
NGC 1313 is an isolated, face-on SB(s)d spiral situated at a distance of 4.1 Mpc (Méndez et al., 2002). With a reported oxygen abundance of log(O/H) + 12 8.3 (Walsh & Roy, 1997), the properties of NGC 1313 are reminiscent of irregular Magellanic-type galaxies, plus late-type spirals such as NGC 300 and M 33, such that one might expect NGC 1313 to host a substantial WR population.
Previous studies of the stellar content of NGC 1313 have utilised high resolution Hubble Space Telescope (HST) broad-band photometry (Larsen, 2004; Pellerin et al., 2007). With regards to the WR population, no direct investigation into the global WR population has been conducted, although signatures of WR stars have been detected in several bright H ii regions within NGC 1313 (Walsh & Roy, 1997).
This paper is structured as follows: the observations and data reduction techniques used in this analysis are described in Section 2. In Section 3, we present nebular properties for several regions within NGC 1313. The WR population and global content is examined in sections 4 and 5. Finally we discuss and summarise our results in Section 6 .
2 Observations and data reduction
NGC 1313 has been observed with the ESO Very Large Telescope UT2 (Kueyen) and Focal Reduced/Low dispersion Spectrograph #1 (FORS1). The data were obtained using the standard resolution collimator which covers a 6′.8 6′.8 field of view, with a plate scale of 0.2″pixel-1. Photometric observations of NGC 1313 were obtained on 2004 October 12, with spectroscopic data following in November 2004 and November–December 2005. Details of the observations can be found in Table 1.
| Date | Filter/ | Exposure | DIMM Seeing |
|---|---|---|---|
| Mask ID | (s) | (″) | |
| Imaging | |||
| 2004 October 12 | Bessel B | 60, 300 | 0.9 |
| 4684, 4871 | 1500 | 0.65,0.75 | |
| 6665, 6563 | 300 | 0.62–0.69 | |
| Spectroscopy | |||
| 2004 November 14 | Mask D | 3600 | 0.6–0.7 |
| Mask E | 3800 | 0.6–0.8 | |
| Mask F | 3800 | 0.5–0.8 | |
| 2005 November 25 | Mask G | 3800 | 0.7 |
| 2005 November 27 | Mask A | 3300 | 0.5 |
| 2005 December 08 | Mask B | 3300 | 0.7–0.8 |
| Mask C | 3600 | 0.7 | |
To supplement our VLT/FORS1 observations, we have retrieved archival HST Advanced Camera for Surveys (ACS) Wide Field Camera (WFC) images of NGC 1313 obtained with the F435W and F555W filters, at three different pointings of NGC 1313. All observations comprise a 680s exposure and were obtained for programme ID GO 9774 (PI S. S Larsen). At the distance of NGC 1313, the spatial scale of ACS/WFC is 1.0 pc pixel-1 (0.05″ pixel -1).
2.1 Imaging & Photometry
FORS1 was used on the night of 2004 October 12 to obtain narrow-band images centred on and (FWHM=66Å and 68Å respectively). In addition, narrow-band on- and off-H images (6563, 6665Å, FWHM=61, 65Å) were acquired along with broad-band B images. All images were taken in photometric conditions and in seeing conditions of 0.6–0.9″.
 |
 |
Images were reduced following standard reduction procedures (i.e debiased, flat field corrected and cosmic ray cleaned) using iraf and starlink packages.
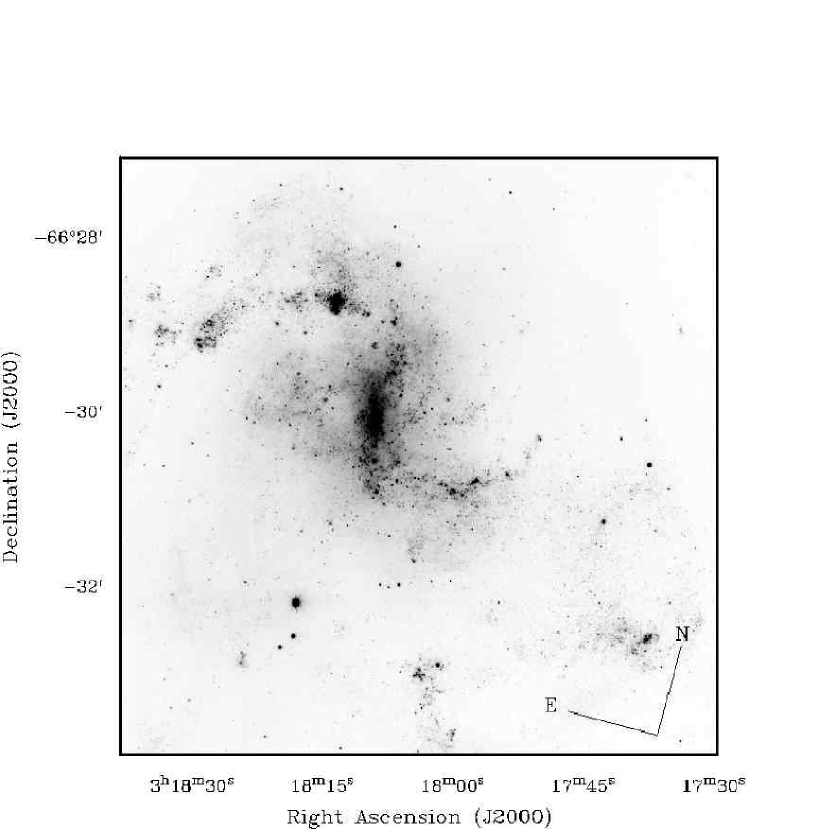
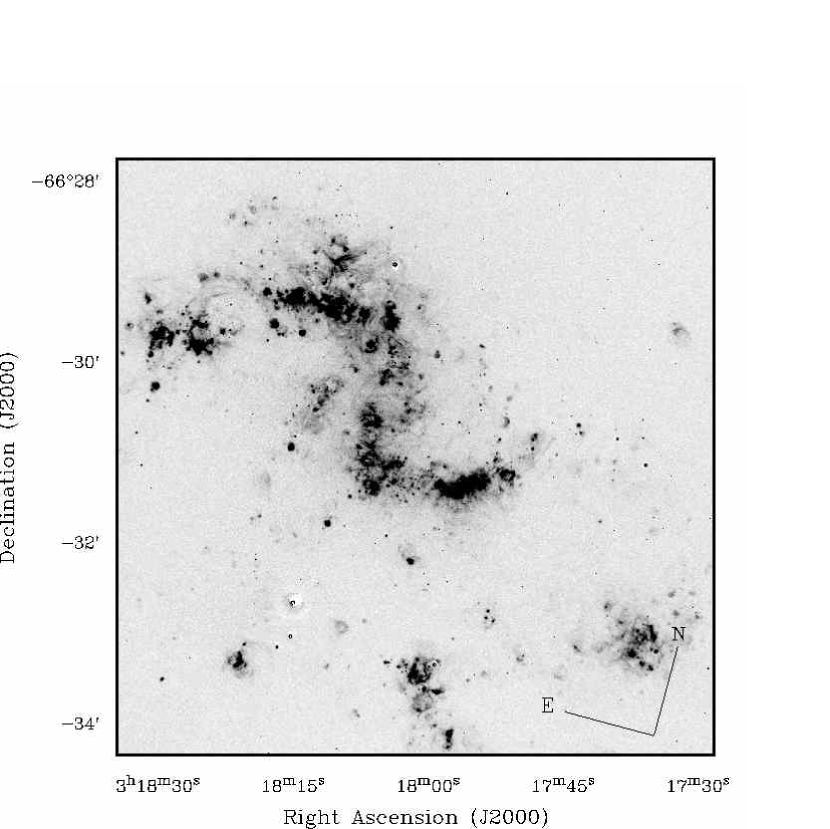
We present broad-band B and continuum subtracted H images of the surveyed region in Fig. 1, clearly illustrating the barred-spiral structure of NGC 1313. The net H image of NGC 1313 shows that the nebular emission within NGC 1313 is mainly concentrated along the spiral arms, with the central bar relatively faint in ionized gas. In addition, NGC 1313 contains three ‘satellite’ H ii regions to the south of the nucleus. In total, Marcelin & Gondoin (1983) have catalogued 375 H ii regions within NGC 1313.
Photometry of individual sources within NGC 1313 was performed using the iraf point-spread (PSF) fitting routine daophot. Landolt (1992) photometric standard fields Mark A and PG 2331+055 (containing a total of 7 photometric standard stars) were observed for absolute calibration of B-band images. Photometric zeropoints were found to differ by 0.7 mag, so we have re-calibrated our photometry using HST/ACS F435W images. For the narrow-band images, photometric zeropoints were obtained by observing the spectrophotometric standard GD 71 (mB = 12.8 mag).
A number of sources do not appear point-like on our VLT/FORS1 images and have therefore been excluded from our daophot photometry.
2.2 Candidate Selection
WR candidate stars were identified by searching for He ii 4686/C iii 4650 emission (at ) relative to the continuum (4781). As noted by Hadfield et al. (2005), candidate He ii emission regions are most readily identified by “blinking” the individual and 4781 images along with a difference image (obtained by subtracting the 4781 frame from the image). In total, 94 4684 emission line candidates were identified in NGC 1313. These are listed in the appendix in Table A.2.
For the majority of our targets (90%) we have obtained photometry in at least the 4684 filter. For 30% of these regions it was not possible to obtain a 4871 magnitude since the object was below the detection limit of our photometry. For five regions PSF photometry was not possible since they were located in extremely crowded regions of the galaxy. Sources which were not detected in our images are given an upper limit in Table A.2.
2.3 MOS Spectroscopy
FORS1 Multi Object Spectroscopy (MOS) of candidate WR regions within NGC 1313 was undertaken during November 2004 and November–December 2005 in seeing conditions between 0.″5 and 0″.8. Spectra were acquired using a 0″.8 slit and the 300V grism (centred on 5850Å), resulting in a dispersion of 3Å pixel-1 and resolution of 8Å (as measured from comparison arc lines).
In total, 82 of the 94 candidates have been spectroscopically observed in 7 different MOS mask configurations, which were labelled A to G (see Table 2). To maximise S/N, candidates were ranked based on the observed 4684 excess and then grouped according to continuum brightness. Exposure times ranged between 900s for our brighter candidates (mB 18 mag) to 2400s for the fainter targets (mB20 mag). The blue (4500Å) continuum S/N ranged from 50 for the brighter sources to 1 for the very faint cases. Nevertheless, blue WR features were generally detected at the 20 level.
Positional restrictions typically permitted 15 candidates to be observed simultaneously using FORS1. Since MOS spectroscopy allows the spectra of 19 targets to be obtained per MOS mask, we have supplemented our analysis by observing 9 H ii regions within NGC 1313.
For brevity we have assigned #1–94 and H1–9 nomenclature to our WR candidates and H ii regions, respectively. Positional and photometric information is presented in Tables A.1 and A.2 in the appendix. Additional information (i.e. spectral classification etc) is included for those regions that were included in spectroscopic follow-up investigations. FORS1 narrow-band 4684 finding charts can be found in Appendix B.
Data were prepared and processed using standard techniques and iraf and starlink packages i.e. bias subtracted, flat field corrected, extracted and flux / wavelength calibrated, with care being taken during the extraction process to minimise contamination from neighbouring sources. The wavelength coverage of individual candidates is dependent on their location on the CCD, but for the majority of targets a spectral coverage of 3500–7500Å was achieved.
The spectrophotometric standards LTT 3218 and GD 108 were observed in order to relatively flux calibrate the spectra. Slit-loss corrections are estimated to be of the order of 5–20% for seeing conditions between 0.5–0.8″. FORS1 has an atmospheric dispersion compensator and so slit-losses will be independent of wavelength. Consequently, observed data have been uniformly scaled by up to 20% to match the conditions in which they were obtained.
For very faint cases, no continuum was present on the raw 2D frame and identification was made solely on the presence of emission features. A nearby continuum source was used as a trace during extraction.
3 Nebular analysis
Here we derive the nebular properties of several regions within NGC 1313. Of the 82 candidate and 9 H ii regions spectroscopically observed, the strength of the [O iii] 4363 line was detected at the 5 level in only six regions permitting a determination of T. These are NGC 1313 #14 and 85, H1, H2, H3 and H5.
The nebular analysis was performed using the starlink package dipso with line fluxes being determined using the ELF (emission line fitting) routine to fit Gaussian line profiles to the spectral features. Observed and dereddened line fluxes are presented in Table 2.
| ID | #14 | #85 | H1 | H2 | H3 | H4 | |||||||
|---|---|---|---|---|---|---|---|---|---|---|---|---|---|
| Fλ | Iλ | Fλ | Iλ | Fλ | Iλ | Fλ | Iλ | Fλ | Iλ | Fλ | Iλ | ||
| 3727 | [Oii] | 133.3 | 171.6 | 116.2 | 143.9 | 230.0 | 307.0 | 216.7 | 254.7 | 141.2 | 251.7 | 306.4 | 114.4 |
| 4363 | [Oiii] | 2.6 | 3.0 | 3.1 | 3.4 | 2.9 | 3.3 | 4.8 | 5.2 | 5.0 | 2.9 | 3.2 | 4.5 |
| 4861 | H | 100 | 100 | 100 | 100 | 100 | 100 | 100 | 100 | 100 | 100 | 100 | 100 |
| 4959 | [Oiii] | 150.0 | 146.4 | 169.0 | 165.9 | 107.0 | 104.1 | 125.0 | 123.1 | 182.9 | 127.6 | 125.2 | 186.6 |
| 5007 | [Oiii] | 435.0 | 420.0 | 503.5 | 488.7 | 330.0 | 317.0 | 375.0 | 366.6 | 561.0 | 372.4 | 362.4 | 577.5 |
| 6563 | H | 391.7 | 286.0 | 373.4 | 286.0 | 410.0 | 286.0 | 350.0 | 286.0 | 286.0 | 365.5 | 286.0 | 371.1 |
| 6583 | [Nii] | 16.1 | 11.7 | 12.6 | 9.6 | 33.0 | 22.9 | 16.7 | 13.6 | 10.5 | 32.8 | 25.6 | 13.7 |
| 6717 | [Sii] | 15 | 10.7 | 14.8 | 11.1 | 33.0 | 22.5 | 17.4 | 14.0 | 11.0 | 47.9 | 36.9 | 14.5 |
| 6731 | [Sii] | 11.2 | 8.0 | 11.0 | 8.3 | 25.1 | 17.1 | 13.2 | 10.6 | 8.4 | 33.1 | 25.5 | 11.1 |
| 7330 | [Oii] | 4.4 | 2.9 | 4.8 | 3.4 | 11.0 | 6.9 | 10.0 | 7.7 | 2.8 | 6.9 | 5.0 | 3.9 |
| 4861 | H | 18.0 | 48.1 | 17.3 | 39.8 | 1.0 | 3.0 | 1.2 | 2.3 | 21.9 | 2.9 | 6.2 | 9.7 |
| EB-V | 0.29 | 0.25 | 0.34 | 0.19 | 0.23 | 0.24 | |||||||
3.1 Interstellar extinction
The interstellar extinction towards NGC 1313 has been estimated using the observed H/H line ratios (accounting for nearby [N ii] emission) for the 9 H ii regions observed in this analysis (see Table A.2). Assuming Case B recombination theory for electron densities of 10 and a temperature of K (Hummer & Storey, 1987), we calculate total values ranging between 0.19 and 0.56 mag, with an average =0.290.04 mag.
Underlying H,H absorption from early-type stars is expected to be of the order of W2Å. Observed H and H equivalent widths are approximately 1550Å and 150Å, respectively, suggesting that underlying stellar absorption is negligible.
Foreground Galactic redding towards NGC 1313 is estimated to be EB-V=0.10 mag (Schlegel et al., 1998), suggesting a modest average internal extinction of EB-V=0.190.05 mag for NGC 1313. All reddening corrections were made following a standard Seaton (1979) extinction law and AV/EB-V=3.1.
A subset of the regions presented here are associated with the bright H ii regions studied by Pagel et al. (1980) and Walsh & Roy (1997). We obtain EB-V=0.23 mag for H3, substantially lower than EB-V=c(H)/1.64=0.71 mag derived by Walsh & Roy (their No.20). Considerable differences are also obtained for the other regions in common with this study. Overall, both Pagel et al. and Walsh & Roy imply a moderately high extinction towards NGC 1313, with an average EB-V=0.47 mag (c.f. EB-V=0.29 mag obtained here). However, a direct comparison is not straightforward since the specific region sampled in the different studies is known to differ (i.e. H ii region No.20 from Walsh & Roy is associated with 3 sub-regions observed in our analysis).
3.2 Electron densities and temperatures
Electron densities (N) and temperatures (T) were determined for the six H ii regions from diagnostic line ratios presented in Table 2, using the five-level atom calculator temden.
Electron densities were calculated assuming a constant T of 10 000K. For five regions investigated we derive N100 cm2, typical of that expected for H ii regions. For H3 a direct determination of N was not possible since the [S ii] 6717/6731Å line ratio is below the limits of the line diagnostic. Consequently we have adopted N=50 cm2 for temperature and abundance calculations for this region.
Estimates of the electron temperatures have been derived using the [O ii] 3727/7330Å and [O iii] (4959+5007)/4363Å diagnostic ratios. For the majority of regions we find that T lies between 9500 and 12 000K, except for H2 where we derive a slightly larger electron temperature of 13 000K.
Errors on T(O+) were based on the 10% measurement error estimated for the 7330Å while we assume that the 15% formal error associated with [O iii] 4363Å dominates the uncertainty on T(O2+).
3.3 Oxygen Abundance
We have directly measured the O/H content of our six H ii regions in NGC 1313 using the [O ii] 3727 and [O iii] 5007 nebular emission features along with associated electron temperatures and densities. Oxygen abundances were derived using the iraf utility ionic. The total oxygen content for each region was computed assuming that N(O)/N(H) = N(O+)/N(H) + N(O2+)/N(H). Abundance estimates for individual H ii regions are presented in Table 3.
We derive an average 12 + log(O/H) for NGC 1313 of 8.230.06. This agrees with 8.32 from Walsh & Roy (1997) to within the quoted errors. Oxygen abundances derived here confirm that NGC 1313 is somewhat intermediate in metallicity between the LMC and SMC for which 12 + log(O/H)8.13 and 8.37, respectively (Russell & Dopita, 1990).
| Region | ||||||
| Diagnostic | #14 | #85 | H1 | H2 | H3 | H4 |
| Density | N(cm -3) | |||||
| 6717/6731 | 80 | 80 | 100 | 100 | (50) | 100 |
| 50 | 50 | 60 | 60 | 60 | ||
| Temperature | T(K) | |||||
| 3727/7330 | 9500 | 11 500 | 12 000 | 13 500 | 11 000 | 10 500 |
| 500 | 500 | 500 | 500 | 400 | ||
| 4959+5007 | 10 500 | 10 500 | 12 000 | 13 000 | 11 000 | 11 000 |
| 4363 | 400 | 400 | 500 | 600 | 500 | 500 |
| Abundances | ||||||
| O+/H ( | 7.2 | 3.0 | 7.8 | 3.1 | 13.4 | 4.5 |
| 0.8 | 0.2 | 0.9 | 0.1 | 1.6 | 0.4 | |
| O2+/H ( | 13.5 | 15.8 | 6.6 | 5.5 | 8.2 | 14.4 |
| 3.9 | 4.3 | 1.5 | 1.3 | 3.1 | 4.2 | |
| O/H () | 20.7 | 18.8 | 14.4 | 8.6 | 21.6 | 18.9 |
| 4.0 | 4.3 | 1.7 | 1.3 | 3.5 | 4.2 | |
| 12+log(O/H) | 8.32 | 8.27 | 8.16 | 7.93 | 8.34 | 8.27 |
| 0.07 | 0.08 | 0.04 | 0.05 | 0.06 | 0.08 | |
| Average: | 8.23 | |||||
Our derived (O/H) abundances show no evidence for a radial dependence in agreement with previous findings of Walsh & Roy (1997) and Pagel et al. (1980). This probably results from the barred nature of the galaxy, in which the bar provides an effective means of homogenizing the radial abundance gradients, as demonstrated by numerical simulations (Friedli et al., 1994).
3.4 H Fluxes
| Region | Ap | EB-V | F(H) | L(H) | log Q0 | ||
|---|---|---|---|---|---|---|---|
| (J2000) | (″) | (mag) | (erg s-1 cm-2) | (erg s-1) | (ph s-1) | ||
| PES 1 | 03:18:23.9 | -66:28:47.7 | 20 | 0.12 | 8.7 | 2.3 | 51.23 |
| PES 2 | 03:18:38.0 | -66:29:19.7 | 12 | (0.29) | 1.1 | 4.3 | 50.50 |
| PES 3 | 03:18:37.8 | -66:29:34.2 | 10 | 0.25 | 4.5 | 1.6 | 51.07 |
| PES 4 | 03:18:16.8 | -66:28:44.3 | 15 | 0.26 | 2.3 | 8.5 | 50.79 |
| PES 5 | 03:18:05.3 | -66:30:27.1 | 6 | 0.37 | 3.1 | 1.4 | 51.02 |
| PES 6 | 03:18:03.2 | -66:30:16.5 | 24 | 0.27 | 6.1 | 2.3 | 51.22 |
| PES 7 | 03:18:03.5 | -66:33:32.3 | 18 | (0.29) | 8.4 | 3.3 | 50.38 |
| PES 8 | 03:17:39.2 | -66:31:26.5 | 18 | (0.29) | 1.0 | 4.1 | 50.47 |
| PES 9 | 03:18:18.3 | -66:29:02.2 | 12 | (0.29) | 6.0 | 2.3 | 50.23 |
| PES 10 | 03:18:42.2 | -66:29:32.0 | 12 | 0.33 | 1.6 | 6.9 | 50.70 |
| PES 11 | 03:18:19.6 | -66:28:43.5 | 22 | (0.29) | 1.7 | 6.5 | 50.68 |
| P#12 | 03:18:23.7 | -66:32:55.9 | 20 | 0.29 | 0.9 | 3.7 | 50.43 |
| NGC 1313 | 03:18:14.9 | -66:29:33.1 | 460 | (0.29) | 2.2 | 8.5 | 52.79 |
We have measured net H fluxes for the 11 bright H ii emission regions of NGC 1313 identified by Pagel et al. (1980) (denoted PES 1–11) plus the ‘satellite’ region 3′ to the South-East of the nucleus (designated P#12 in Table 4).
Narrow-band H observations of galaxies suffer from contamination by nearby [N ii] 6548,6583 emission. For metal-rich spiral galaxies [N ii] is expected to contribute 1/3 of H flux, decreasing to only 8% for metal-poor irregulars (Kennicutt & Kent, 1983). Indeed, for the six regions presented in Table 2, we estimate [N ii]/H0.06 (assuming [N ii] 6548/N ii] 6583 3). Consequently, continuum subtracted H fluxes have been corrected downwards by 6%.
Where possible, we have derived an average extinction for these 12 bright H ii regions using spectroscopy of individual sources in common with this study. For PES 7, 8 and 12, this was not possible since our spectra started redward of H. For PES 2, 9 and 11 no spectra were available. For these regions, and for the galaxy as a whole, we have adopted our average total extinction of EB-V=0.29 mag.
For our assumed distance of 4.1 Mpc, we derive H luminosities for the bright H ii regions in the range of 2.3 to erg s-1. The brightest region (PES 1) has an ionizing flux comparable to that observed for NGC 595 in M 33, while the faintest region (PES 9) is more consistent with that observed for SMC N19 (Kennicutt, 1984). For the entire galaxy we derive a H luminosity of 8.4 erg s-1 which is comparable to 6500 O7V star equivalents, assuming a typical O7V star in the SMC has an ionizing output of 1049 erg s-1 (Hadfield & Crowther, 2006).
Of course, the O stars in NGC 1313 will not be restricted to O7V spectral types, but will cover the entire spectral range. For continuous star formation it is hard to quantify the specific spectral-type distribution, but it is likely that the actual O star content of NGC 1313 is a factor of two higher i.e. 13 000 stars. Indeed, the star formation rate (SFR) in the SMC implies 400 O7V equivalents (Kennicutt et al., 1995), yet the global star content may be as high as 1000 (Crowther, 2007).
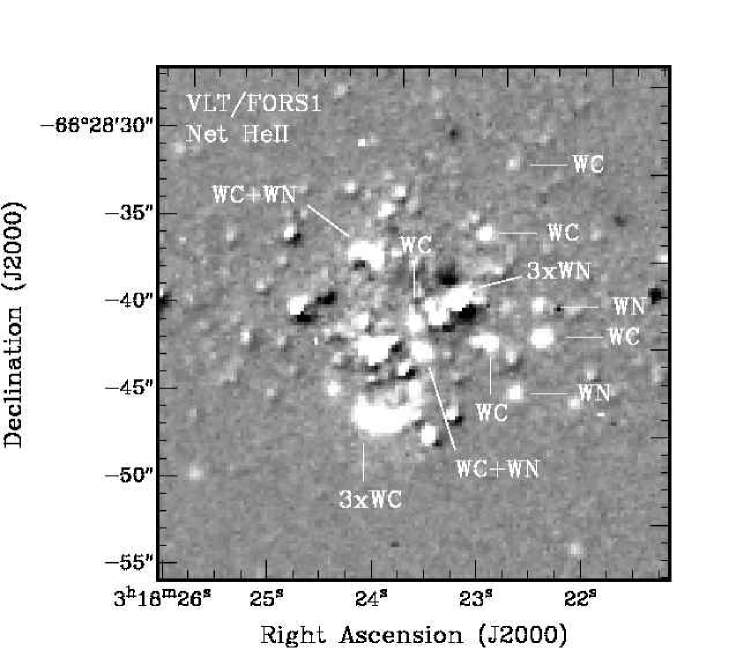
3.5 Nebular He ii 4686
Except for Planetary Nebulae, nebular He ii emission is not expected to be observed in “normal” H ii regions since O stars do not emit sufficient extreme UV photons (228Å) to produce a significant He+ ionizing flux. However, seven such H ii regions have been identified within the Local Group (Garnett et al., 1991), five of which are associated with WR stars. Here, we have identified three regions within NGC 1313 which exhibit strong nebular He ii consistent with highly ionized nebulae.
The dereddened spectra of NGC 1313 #6, 19 and 74 are presented in Fig. 2. The broad stellar component and superimposed nebular He ii are clearly evident in #19, as is the presence of strong [Fe iii] 4658 and [Ar iv] 4711 in #74. Table 5 lists derived properties of these three nebulae, along with those for known He ii 4686 nebulae in the Local Group.

| Galaxy | Region | Ionizing | Sp | I(4686)/ | [S ii]/ | [N ii] / | Ref |
| Source | Type | I(H) | H | H | |||
| IC1613 | S3 | WO3 | 0.23 | 0.05 | 0.02 | 2 | |
| NGC 1313 | #19 | WN2–4 | 0.25 | 0.16 | 0.08 | 7 | |
| SMC | N 76 | AB7 | WN4+O6I(f) | 0.16-0.24 | 0.02-0.14 | 0.02–0.05 | 5 |
| LMC | N79 | BAT99-2 | WN2b(h) | 0.21–0.56 | 0.10–0.25 | 0.05–0.26 | 6 |
| LMC | N206 | BAT99-49 | WN4:b+O8V | 0.08-0.10 | 0.09-0.22 | 0.08–0.13 | 5 |
| MW | G2.4 + 1.4 | WR102 | WO2 | 0.4–1.2 | 0.08–0.8 | 0.5–1.0 | 3 |
| NGC 1313 | #74 | SNR | 0.11 | 0.50 | 0.92 | 7 | |
| NGC 1313 | #6 | 0.27 | 0.17 | 0.07 | 7 | ||
| LMC | N159 | X-1 | HMXB | 0.05 | 0.24 | 1 | |
| LMC | N44C | X-5? | X-ray Neb? | 0.02–0.14 | 0.06-0.26 | 0.03–0.35 | 4 |
| References.—(1) Garnett et al. (1991); (2) Kingsburgh & Barlow (1995); (3) Polcaro et al. (1995); | |||||||
| (4) Garnett et al. (2000); (5) Nazé et al. (2003a); (6) Nazé et al. (2003b); (7) this work. | |||||||
The presence of a WN star within the spectrum of #19 would suggest that this is responsible for the hard ionizing photons, and based on the He ii 4686 stellar line flux we infer the presence of a single WN2–4 star (see Sect. 4). We derive a nebular I(4686)/I(H)=0.25, which is consistent with that observed for other metal-poor early-type WN stars (e.g N79 in the LMC; Nazé et al., 2003b).
For the two regions in which WR stars were not detected, supernova remnants (SNRs) or X-ray sources are possible ionizing sources. In general, the distinction between photoionized and shocked regions is made using the [S ii]/H ratio, with the dividing point being an empirical value based on observations of known SNRs. Typical H ii regions have an observed [S ii]/H ratio of 0.1 versus 0.5–1.0 observed in SNRs (Smith et al., 1993). A [S ii]/H=0.4 is generally taken as the standard discriminator and is found to be independent of metallicity.
#74 appears to be consistent with known SNR since [S ii]/H=0.5. In addition, [O i] 6300,6364 and [N ii]6548,6583 are strong with respect to H also suggesting shock ionization. We therefore believe that #74 is a shocked SNR, instead of a photoionized H ii region.
For #6, both [S ii] and [N ii] are observed to be much weaker than in #74, and with [S ii]/H=0.2 it is not consistent with a SNR. The absence of a hot WR star suggests possible similarities with N44C and N159 in the LMC, where the high excitation is linked to possible X-ray sources within the nebulae. To date, however, no bright (Lerg s-1) X-ray counterpart has been linked to #6 (Colbert et al., 1995; Miller et al., 1998).
4 Spectroscopic Results
Of the 82 candidate regions spectroscopically observed we have identified broad WR emission features in 70 cases. Of the 12 cases where we did not detect broad WR emission, two sources displayed strong nebular He ii 4686 (see Sect. 3.5) and in four cases, the spectral coverage started longward of the He ii 4686 feature required for WN classification. Only six spectra showed no evidence for WR features, of which three were consistent with foreground late-type stars.
Prior to the present study, the WR population of NGC 1313 has not been directly investigated. Strong WR signatures have been detected in two of the H ii regions investigated by Walsh & Roy (1997), their regions 3 and 28. Here, we can confirm the presence of WR stars in both these regions, although a quantitative comparison is not possible.
Optical spectral classification of WR stars is generally straightforward, since line diagnostic schemes are well defined (Crowther et al., 1998; Smith et al., 1996). Indeed, for most regions distinguishing between WC (strong C iv 5808), WN (strong He ii 4686) and WO (strong O vi 3820) type stars was relatively straightforward.
For a refined classification of WN stars, we refer to Crowther & Hadfield (2006) who showed that Magellanic Cloud WN stars could be further divided into early (WN2–4), mid (WN5–6) and late (WN7–9) subtypes. We shall now discuss the WR content of NGC 1313 in detail.
4.1 WN population
In 44 spectra the emission line features present are characteristic of nitrogen-rich (WN) WR stars, with strong He ii 4686. We have assigned a WN2–4 (WNE) or WN7–9 (WNL) subtype to each region if He ii 4686 is accompanied by N v 4603–20 or N iii 4634–41, respectively. For cases where nitrogen emission was not detected, WNE subtypes were preferred for regions in which broad He ii (FWHM20Å) was observed, otherwise a WNL subtype generally was assumed. WN5–6 stars, in which N v and N iii emission is weak, are found to be exclusive to the cores of luminous H ii regions within the LMC (e.g. 30 Doradus). NGC 1313 contains several such regions, to which we tentatively assign WN5–6 subtypes. Since these classifications cannot be spectroscopically confirmed, we note that the WN distribution of NGC 1313 may be atypical. Therefore, to reflect any possible ambiguity surrounding the classification of these regions, we have adopted WN5–6? subtypes in Table A.2.
 |
 |
WN stars are known to exhibit a wide range of intrinsic properties (e.g. Schaerer & Vacca, 1998; Crowther & Hadfield, 2006) and converting between line luminosity and WR content leads to large uncertainties on derived populations. Consequently, we suggest a single WN star for each source unless the line luminosity formally suggests the presence of three or more stars.
| Subtype | WN2–4 | WN5–6? | WN7–9 | WN/C | WC4–5 | WO |
|---|---|---|---|---|---|---|
| Line | 4686 | 4686 | 4686 | 4686 | 5808 | 5808 |
| Log LLMC | 35.92 | 36.2 | 35.86 | 35.92 | 36.53 | 36.01 |
| N(WR) | 22 | 6 | 22 | 1 | 32 | 1 |
For the majority of our WN sources, dereddened line fluxes are consistent with single LMC-like counterparts, assuming average He ii 4686 line luminosity calibrations of Crowther & Hadfield (2006) (see Table 6). The exceptions are sources NGC 1313 #33 and 58 where we estimate that 3 WN5–6 and 3 WN2–4 stars, respectively, are required to reproduce the observed He ii line flux.
In Fig. 3(a) we compare early WN sources in NGC 1313 with a generic LMC WN2–4 template spectrum. The spectra shown are in general representative of the observed WNE stars and based on a spectral comparison we confirm that LMC WN2–4 templates are appropriate local analogues for WNE stars in NGC 1313. A similar comparison between late-type WN stars in NGC 1313 and a generic LMC WN7–9 template star is shown in Fig. 3(b).
From spectroscopy we estimate a total WN population of 50 stars. The subtype distribution is summarised in Table 6. For NGC 1313 #1 we quote a WR population of 1WNE star in Table A.2 since it was not possible to extract a reliable spectrum as the object was located at the edge of the slit. Broad He ii is clearly present in the raw 2D image and with no evidence of WC features we identify a dominant WNE population.
4.2 WN/C stars
For one region, NGC 1313 #11, the observed spectral features are not consistent with normal WN or WC stars.

In Fig. 4 we compare the dereddened FORS1 spectrum of #11 along with that of the LMC WN5–6/C4 star Brey 29 (BAT99-36) from Crowther et al. (1995). Strong WC (C iv 5808) and WN (He ii 4686, 5411) features are clearly present in both stars. Ciii 4650 is very weak and the relative strength of the N iii 4634-40 and He ii 4686 suggests a WN5–6 classification, while strong C iv 5808 suggests a WC4–5 classification. The similarity in spectral morphology to Brey 29 suggests a composite WN5–6/C4–5 classification for this source.
Transition WN/C stars are rare, and to date only six such stars have been identified within the Galaxy, plus two in the LMC. Since the total WR populations of the Galaxy and the LMC are 313 (van der Hucht, 2006; Hadfield et al., 2007) and 134, respectively, we find that the total observed fraction of WN/C stars for each galaxy is 1–2%. Indeed, this is comparable to observed statistics for NGC 1313 i.e. N(WN/C)/N(WR)=1/841%.
4.3 The WC Content
For 24 regions spectroscopically observed we have identified broad blue and red emission features, consistent with those expected from carbon-rich WR stars. C iii 5696 is very weak or absent in all 24 spectra whereas C iv 5808 is present at the 20 level, as illustrated in Fig. 5. Since WC stars are classified using the C iii 5696/C iv 5808 line ratio (Smith et al., 1990), the absence of C iii 5696 suggests a WC4–5 subtype for all 24 regions.
For three regions, spectral coverage started longward of 5000 and WC classification was assigned based solely on the C iv 5808 detection. For the majority of sources, dereddened C iv 5808 line luminosities are consistent with a single LMC-like WC4 star. For NGC 1313 #10, 48, 66 and 88 the observed line fluxes suggest the presence of 2 WC stars whereas we estimate a content of 3 WC4–5 stars for NGC 1313 #61 and 64.

For regions NGC 1313 #59 and 67, we find that the blue WR features cannot be reproduced by a population comprising solely of WC stars. In Fig. 6 we compare the dereddened, continuum subtracted C iv 5808 profile for #59 with that expected from a LMC-like, generic WC4 star at the distance of NGC 1313. The observed red feature is well reproduced by a single WC4–5 star. In the blue, a single generic WC4 star cannot reproduce the observed morphology and a WN5–6 contribution is required. The composite spectrum expected from a mixed population reproduces the observed features exceptionally well, such that we assign a population of 1 WC4 and 1 WN5–6 to #59. Similar results are obtained for NGC 1313 #67.

4.4 NGC 1313 #31 - The first WO star beyond the Local Group
In addition to identifying WN and WC stars within NGC 1313, our WR survey has revealed the signature of a WO star in one case.
In Fig. 7 we compare the spectrum of NGC 1313 #31 with LMC and SMC WO counterparts Sand 1 and 2 from Kingsburgh et al. (1995), clearly illustrating the presence of broad O vi 3811–34, C iv 4658 and C iv 5808 emission features. To our knowledge this represents the first detection of a WO star beyond the Local Group. Large line widths (FWHM(5808)100Å) associated with #31 are apparent, and are observed to be comparable with those in Local Group WO counterparts.
For spectral classification we refer to the scheme of Crowther et al. (1998), where the ratio of the equivalent widths (Wλ) of O vi 3811–34 and O v 5590 is used as the primary subtype discriminator. In our data, O v 5590 is extremely weak and accurately classifying it based on this criterion is not possible. However, a classification can be made using the secondary line diagnostics O vi 3811–34 and C iv 5808, which also suggests a WO3 classification.

NGC 1313 #31 is below the detection limit of our FORS1 B-band photometry, suggesting mB23.5 mag. HST/ACS photometry of #31 yields mF435W=23.40.01 mag, mF555W=23.80.01 mag, mF814W=25.40.05 mag (Pellerin, private communication).
Single/binary WO stars are observed to exhibit M and –6 mag, respectively (Kingsburgh et al., 1995). For a total extinction EB-V=0.29 mag, we find M–5 mag for #31, which is very bright for a single WO star, so #31 likely belongs to a binary system or small association.
5 The Global WR content of NGC 1313
Of the 94 WR candidates identified from VLT/FORS1 narrow-band imaging we have identified characteristic WR signatures in 70 regions from our spectroscopy to date. Using LMC template WR stars as local analogues, we have derived a global WR population of 84 stars, as summarised in Table 6.
5.1 Nature of Candidates
In general, are the confirmed WR sources in NGC 1313 isolated WR stars, binaries or members of luminous stellar clusters/associations? One may expect the latter since our 0″.8 slit width corresponds to a spatial scale of 15 pc at a distance of 4.1 Mpc.
It is well known that WC stars exhibit a larger 4684 excess than their WN counterparts due to their intrinsically stronger emission features. Synthetic filter photometry of LMC template stars from Crowther & Hadfield (2006) suggests that a typical WC4 star in NGC 1313 should have 23 mag and mag. For WN stars, synthetic photometry suggests that single early, mid and late WN stars should exhibit photometric excesses of =–1.2, –0.6 and –0.4 mag, respectively. Single WN2–4 stars within NGC 1313 would have an apparent B-band magnitude of 23 mag, whereas late-type WN stars should be slightly brighter with m22 mag.

In Fig. 8 we compare the actual 4684 excess, , with the B-band magnitude for our sample. As expected, the fainter candidates exhibit the largest excess (–1.0) consistent with single or binary systems, where the WR emission is not strongly diluted by nearby stars. Sources with small photometric excess (–0.5) correspond to the brighter end of our sample and are consistent with luminous clusters/associations, where the continua of nearby stars greatly dilute the WR emission.
Of course, intrinsic absolute magnitudes of WR stars are seen to display a large scatter (Crowther & Hadfield, 2006), but based on Fig. 8 we conclude that three WCE sources (NGC 1313 #12, 41 and 81) within NGC 1313 are consistent with fairly isolated WC stars. The remaining 25 therefore belong to binary systems or lie within stellar clusters/associations. For the 50 WN sources, six WN2–4 and three WN7–9 stars have properties consistent with single, isolated WN stars.
For two sources known to host WR stars we find 0.5. Since mB19 mag for these regions, both are consistent with luminous clusters/associations such that mB is being contaminated by a population of stars that are intrinsically faint at 4684. For the six candidates which showed no evidence for WR features we find that the three confirmed late-type objects display significant photometric excesses (–0.7 mag). Such sources could be excluded from future spectroscopic surveys on the basis of their extremely red colours, B–V1 mag compared with B–V0.1 mag for genuine candidates. The three other non WR detections only display negligible photometric excesses.
Of the 16 remaining candidate regions, eight display photometric excesses (–0.3 mag) consistent with confirmed WN sources. Indeed, three of these correspond to candidates for which WC stars were excluded since their spectra started longward of 5000. In the continuum subtracted 4684 image (obtained by subtracting the 4781 frame from the image), the majority of the remaining candidates are bright and are comparable with genuine WN sources. Overall, we expect that 11 of the 16 remaining candidates will host WR stars, some of which appear multiple.
5.2 Completeness
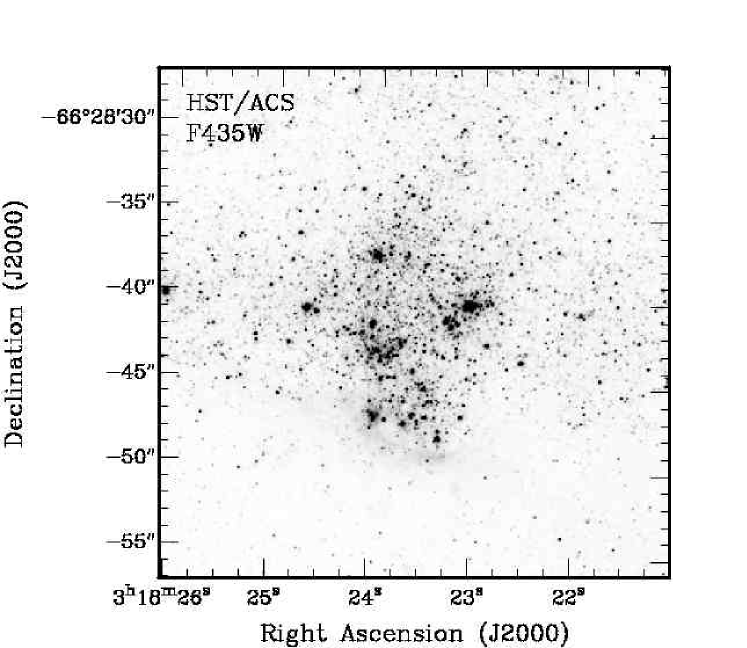
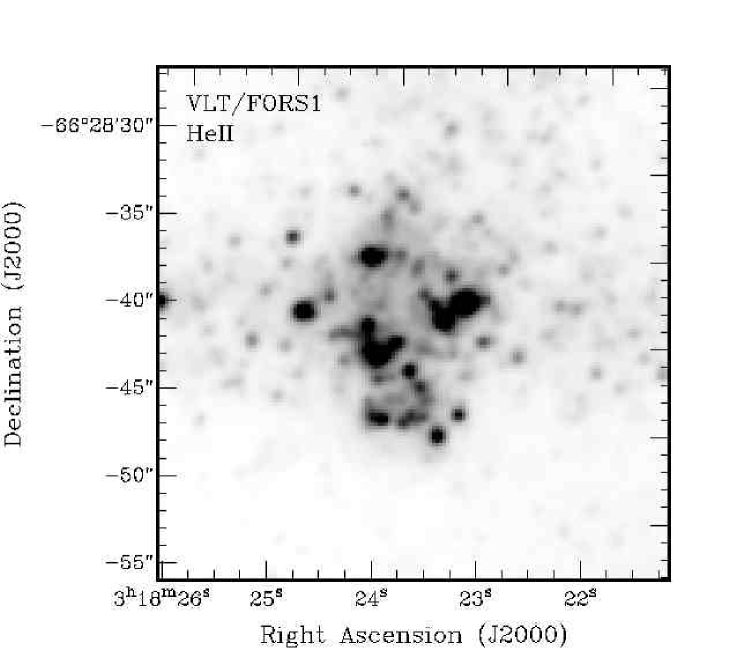
How complete is our WR survey of NGC 1313? In Fig. 9 we compare a FORS1 4684 narrow-band image with a continuum subtracted 4684 image of the brightest star forming region PES 1 (recall Table 4) which highlights the complexities involved in identifying WR candidates within crowded regions (see also Drissen et al., 1993).
Relatively isolated WR stars are readily identified but within the inner regions of PES 1 it is clear that some 4686 emission is spatially extended on our ground-based FORS1 images. The strong, bright emission associated with NGC 1313 #64, to the south of the H ii regions, represents one of the most extreme examples. #64 is believed to host multiple WR stars based on the observed C iv 5808 line luminosity (Sect. 4.3). Spectroscopic observations were made with the slit aligned perpendicular to the extended emission, consequently 50% of the total flux may have been missed. The WR content of this region could therefore be in excess of six WR stars. Similar conclusions are reached for #65, for which images suggest 3 WR stars, but spectroscopy of #65 is not yet available.
Fig. 9 also shows a number of faint emission regions within PES 1, which may be genuine WR stars. In total, spectroscopic observations of PES 1 indicate a minimum of 17 WR stars comprising 7 WN and 10 WC stars. The total WR content may be 26, significantly larger than the dozen WR stars seen within NGC 595 in M 33 (Drissen et al., 1993) and approaches the 41 WR stars identified within the much larger 30 Doradus region of the LMC (Breysacher et al., 1999).
Completeness issues of ground-based surveys are further highlighted by the HST/ACS F435W image of PES 1. The superior spatial resolution of HST is immediately apparent and #64 and #65 are clearly resolved into multiple stellar clusters/associations. If a core-collapse supernova were to occur within either of these regions, even with HST it may not be possible to directly identify a WR progenitor.
 |
 |
 |
Beyond PES 1, seven other candidate 4684 emission regions appear spatially extended, even though observed line luminosities are consistent with a single star in each case. These sources have been indicated in Table A.2. Allowing for the possibility that a few further 4684 sources are WR stars (not listed in Table A.2), we suggest that the total WR population of NGC 1313 is 115, 20% of which are located within PES 1. Since most of the remaining candidates are consistent with WN stars, we infer N(WC)/N(WN)=0.4.
5.3 The WR population
| Galaxy | log(O/H) | N(WR) | N(WR)/ | N(WC)/ | SFR | Ref |
|---|---|---|---|---|---|---|
| +12 | N(O) | N(WN) | ||||
| (10-2) | (M) | |||||
| LMC | 8.37 | 134 | 3.0 | 0.2 | 0.22 | 1, 2 |
| IC 10 | 8.26 | 26 | 0.6 | 1.3 | 0.20 | 3, 5 |
| NGC 1313 | 8.23 | 115 | 0.9 | 0.4 | 0.64 | 6 |
| SMC | 8.13 | 12 | 1.5 | 0.1 | 0.04 | 1, 4 |
In Table 7 we compare the WR and O star content of NGC 1313 to several other Local Group, metal-poor (log(O/H)+128.5), galaxies. The WR content of NGC 1313 is similar to that observed in the LMC, yet its SFR is a factor of three higher. Consequently, the modest reduction in metallicity of NGC 1313 relative to the LMC either causes fewer O stars to advance to the WR phase, or results in shorter WR lifetimes. The WR content of NGC 1313 is more comparable to that of IC 10, at a similar metallicity, once their relative SFR are taken into account (see Table 7).
Over the last few decades WR populations have been well sampled in a wide variety of environments and it is well known that the distribution of WC to WN stars is dependant on metallicity (Massey et al., 2003). Large WC/WN ratios are observed in extremely metal rich environments, e.g. N(WC)/N(WN)1 in M 83 (Hadfield et al., 2005), while small ratios are observed in metal-poor environments e.g. N(WC)/N(WN)=0.2 in the LMC (Breysacher et al., 1999). Based on the low metallicity of NGC 1313 one would expect N(WC)/N(WN)0.1. Here, we estimate a significantly higher subtype ratio of 0.6, (or 0.4 if we adopt a WN subtype for the majority of our remaining candidates). This is intermediate between that observed in the outer, sub-solar regions of M 33 where N(WC)/N(WN)0.35 (Massey & Johnson, 1998) and the inner region of NGC 300 for which N(WC)/N(WN)0.7 (Crowther et al., 2007).
5.4 Using the WC content as a proxy for metallicity
It has long been recognised that late-type WC stars are preferentially found within metal-rich environments. For example, in the Milky Way WC9 stars are universally located within the inner, metal-rich regions (Conti & Vacca, 1990) and an overwhelming WC8–9 population is seen in M 83 (Hadfield et al., 2005). Conversely, metal-poor WC stars in the SMC and LMC are predominantly early-types (Breysacher et al., 1999). Crowther et al. (2002) attributed the dominance of early WC subtypes in low-metallicity environments to weak WC winds, since the C iii 5696 classification line scales very sensitively with wind density. This is further supported by the fact that the WC population of NGC 1313 is comprised solely of early-type WC and WO stars.
In Fig. 10 we show the subtype ratio of WC7–9 to WC4–6 stars in NGC 1313 and other nearby galaxies. At high metallicities (log(O/H)+128.8), wind densities are sufficiently high to reveal strong C iii 5696 emission in the majority of WC stars, such that late WC subtypes dominate the population (e.g M 83). For intermediate metallicities (log(O/H)+128.5–8.8), the WC population is composed of a mixture of early and late WC subtypes, as observed for the solar neighbourhood. For metal-poor galaxies (log(O/H)+128.5) wind densities are low, and are insufficient to produce late-type WC stars. Consequently, galaxies such as the SMC and NGC 1313 only host early-type WC and their high temperature WO counterparts.

Exceptions to this general trend do occur. In the metal-poor galaxy IC 10 (log(O/H)+12=8.26) Crowther et al. (2003) identify one of the 14 WC stars as a WC7 subtype At high metallicities a small fraction of early WC subtypes are also seen (e.g. M 83). Nevertheless, it appears that the dominant WC subtype may serve as a crude metallicity diagnostic for integrated stellar populations e.g. late WC subtypes for NGC 1365 at high-metallcity (Phillips & Conti, 1992) and early-WC subtype for NGC 3125 at low metallicity (Hadfield & Crowther, 2006).
5.5 The origin of nebula He ii 4686
The rarity of H ii regions which show nebular He ii 4686 among Local Group galaxies (Garnett et al., 1991) illustrates the significance of such regions within NGC 1313.
The association of nebular He ii 4686 emission with WNE and WO stars stars (e.g. NGC 1313 #19) in low metallicity environments argues in favour of WR stars being the source of the high ionization. It has long been predicted that the hard ionizing flux output of a WR star is dependant on wind-density (Schmutz et al., 1992). Model atmospheres of Smith et al. (2002) predict that low wind densities favour transparent winds such that only weak winds are expected to produce a significant He+ continua below 228Å. Consequently, dense winds associated with most WC and WN stars are not expected to produce strong He+ ionizing radiation.
Since mass-loss rates of WR stars are predicted (Vink & de Koter, 2005), and observed to scale with metallicity (Crowther et al., 2002), it is expected that He ii nebulae are preferentially associated with WR stars in metal-poor galaxies. Smith et al. (2002) predict that for WNE stars the He+ continua increases from log Q2 = 41.2 at Z=Z⊙ to 48.3 for Z=0.2Z⊙. In metal-rich environments WR stars would not be capable of ionising He+. Indeed, five of the six WR stars which exhibit nebular He ii are in galaxies with log(O/H)+128.4 (Table 5), with the association increasing from less than 0.3% in the Milky Way (e.g. Sand 4, Polcaro et al., 1995) to 100% in IC 1613 which is a factor of ten lower in metallicity (Kingsburgh & Barlow, 1995).
6 Summary & Conclusions
We present the results of an imaging and spectroscopic survey of the WR content of the nearby galaxy NGC 1313. From narrow-band 4684 and 4781 images we have identified 94 candidate He ii emission regions of which 82 have been spectroscopically observed. Broad WR emission has been identified within 70 regions, with only six candidates failing to show stellar/nebular He ii 4686 emission.
A nebular analysis of several H ii regions within the galaxy confirms that NGC 1313 has a metal content (log(O/H)+12=8.230.06) intermediate between the SMC and LMC and equivalent to that of IC 10. Using template LMC WR stars, we estimate N(WR)=84, with N(WC)/(WN)0.6 from spectroscopy. The 51 WN stars are evenly distributed amongst early and late subtypes and include a rare WN/C4 transition star. The 33 WC stars are exclusively early type stars, one of which we assign a WO classification. Indeed, NGC 1313 #31 represents the first WO star identified beyond the Local Group.
Photometry of the remaining candidates, plus a number of additional sources identified from spatially extended emission (primarily within PES 1), are mostly consistent with WN subtypes. We suggest a total WR content of N(WR)115 for NGC 1313; a factor of four times higher than that observed in IC 10 for which the SFR is three times lower. The bright star forming region PES 1 hosts 20% of the entire WR content of NGC 1313, higher than that observed in NGC 595 in M 33 despite a comparable H luminosity. Globally N(WC)/N(WN)0.4, substantially higher than that of the LMC for which N(WC)/N(WN)=0.2.
Late-type WC stars are notably absent in NGC 1313, a common feature of metal-poor galaxies within the Local Group. Indeed, one may infer the metallicity of a spatially unresolved WR galaxy based on the dominant WC subtype. If the spectral appearance is dominated by late-type WC stars then one would infer log(O/H)+128.8. Conversely, a dominant early-type WC appearance suggests log(O/H)+128.5.
In addition, we have identified strong nebular He ii 4686 in three regions within NGC 1313. For NGC 1313 #19, the nebular emission is accompanied by broad He ii emission (consistent with an WNE star), only the sixth case believed to be ionized by a WR star. For the other two regions, one is consistent with shock ionization, most probably a supernova remnant, whereas the ionizing source of NGC 1313 #6 may possibly be a X-ray source, similar to that inferred for N44C within the LMC.
Acknowledgements
We would like to thank Anne Pellerin for providing HST photometry for sources within NGC 1313. LJH acknowledges financial support from PPARC/STFC.
References
- Abbott et al. (2004) Abbott J. B., Crowther P. A., Drissen L., Dessart L., Martin P., Boivin G., 2004, MNRAS, 350, 552
- Breysacher et al. (1999) Breysacher J., Azzopardi M., Testor G., 1999, A&AS, 137, 117
- Colbert et al. (1995) Colbert E. J. M., Petre R. S. E. M., Ryder S. D., 1995, ApJ, 446, 177
- Conti & Vacca (1990) Conti P. S., Vacca W. D., 1990, AJ, 100, 2
- Crowther (2007) Crowther P. A., 2007, A&AR, 45, 177
- Crowther et al. (2007) Crowther P. A., Carpano S., Hadfield L. J., Pollock A. M. T., 2007, A&A, 469, L31
- Crowther et al. (1998) Crowther P. A., De Marco O., Barlow M. J., 1998, MNRAS, 296, 367
- Crowther et al. (2002) Crowther P. A., Dessart L., Hillier D. J., Abbott J., Fullerton A. W., 2002, A&A, 392, 653
- Crowther et al. (2003) Crowther P. A., Drissen L., Abbott J. B., Royer P., Smartt S. J., 2003, A&A, 404, 483
- Crowther & Hadfield (2006) Crowther P. A., Hadfield L. J., 2006, A&A, 449, 711
- Crowther et al. (1995) Crowther P. A., Smith L. J., Willis A. J., 1995, A&A, 304, 269
- Drissen et al. (1993) Drissen L., Moffat A. F. J., Shara M. M., 1993, A&A, 105, 1400
- Friedli et al. (1994) Friedli D., Benz W., Kennicutt R., 1994, ApJ, 430, 105
- Garnett et al. (2000) Garnett D., Galarza V. C., Chu Y.-H., 2000, AJ, 545, 251
- Garnett et al. (1991) Garnett D., Kennicutt R. C., Chu Y. H., Skillman E. D., 1991, AJ, 373, 458
- Hadfield & Crowther (2006) Hadfield L. J., Crowther P. A., 2006, MNRAS, 368, 1822
- Hadfield et al. (2005) Hadfield L. J., Crowther P. A., Schild H., Schmutz W., 2005, A&A, 439, 265
- Hadfield et al. (2007) Hadfield L. J., van Dyk S. D., Morris P. W., Smith J. D., Marston A. P., Peterson D. E., 2007, MNRAS, 376, 248
- Hummer & Storey (1987) Hummer D., Storey P. J., 1987, MNRAS, 224, 801
- Kennicutt (1984) Kennicutt R. C., 1984, ApJ, 287, 116
- Kennicutt (1998) Kennicutt R. C., 1998, ARA&A, 36, 189
- Kennicutt et al. (1995) Kennicutt R. C., Bresolin F., Bomans D. J., Bothun G. D., Thompson I., 1995, AJ, 109, 594
- Kennicutt & Kent (1983) Kennicutt R. C., Kent S. M., 1983, AJ, 88, 1094
- Kingsburgh & Barlow (1995) Kingsburgh R., Barlow M. J., 1995, A&A, 295, 171
- Kingsburgh et al. (1995) Kingsburgh R., Barlow M. J., Storey P., 1995, A&A, 295, 75
- Landolt (1992) Landolt A. U., 1992, AJ, 104, 340
- Larsen (2004) Larsen S., 2004, A&A, 416, 537
- Leroy et al. (2006) Leroy A., Bolatto A.and Walter F., Blitz L., 2006, ApJ, 643, 825
- Marcelin & Gondoin (1983) Marcelin M., Gondoin P., 1983, A&AS, 51, 3538
- Massey & Johnson (1998) Massey P., Johnson O., 1998, ApJ, 505, 793
- Massey et al. (2003) Massey P., Olsen K. A. G., Parker J. W., 2003, PASP, 115, 1265
- Méndez et al. (2002) Méndez B., Davis M., Moustakas J., Newman J., Madore B. F., Freedman W. L., 2002, AJ, 124, 213
- Miller et al. (1998) Miller S., Schlegel E. M., Petre R., Colbert E., 1998, AJ, 116, 1657
- Nazé et al. (2003a) Nazé Y., Rauw G., Manfroid J., Chu Y.-U., Vreux J.-M., 2003a, A&A, 408
- Nazé et al. (2003b) Nazé Y., Rauw G., Manfroid J., Chu Y.-U., Vreux J.-M., 2003b, A&A, L13
- Pagel et al. (1980) Pagel B. E. J., Edmunds M. G., Smith G., 1980, MNRAS, 193, 219
- Pellerin et al. (2007) Pellerin A., Meyer M., Harris J., Calzetti D., 2007, AJ, 658, L87
- Phillips & Conti (1992) Phillips A., Conti P., 1992, ApJ, 385, L91
- Polcaro et al. (1995) Polcaro V. F., Rossi C., Norci L., Viotti R., 1995, A&A, 303, 211
- Russell & Dopita (1990) Russell S. C., Dopita M., 1990, ApJS, 74, 93
- Ryder & Dopita (1994) Ryder S. D., Dopita M. A., 1994, ApJ, 430, 142
- Schaerer et al. (1999) Schaerer D., Contini T., Pindao M., 1999, A&A, 341, 399
- Schaerer & Vacca (1998) Schaerer D., Vacca W. D., 1998, ApJ, 497, 618
- Schild et al. (2003) Schild H., Crowther P. A., Abbott J. B., Shmutz W., 2003, A&A, 397, 859
- Schlegel et al. (1998) Schlegel D. J., Finkbeiner D. P., Davis M., 1998, ApJ, 500, 525
- Schmutz et al. (1992) Schmutz W., Leitherer C., Gruenwald R., 1992, PASP, 104, 1164
- Seaton (1979) Seaton M. J., 1979, MNRAS, 187, 73p
- Smith et al. (2002) Smith L. F., Norris R. F. P., Crowther P. A., 2002, MNRAS, 337, 1309
- Smith et al. (1990) Smith L. F., Shara M. M., Moffat A. J., 1990, ApJ, 348, 471
- Smith et al. (1996) Smith L. F., Shara M. M., Moffat A. J., 1996, MNRAS, 281, 229
- Smith et al. (1993) Smith R. C., Kirshner R. P., Blair W. B., Long K. S., Winkler P. F., 1993, ApJ, 407, 564
- van der Hucht (2006) van der Hucht K. A., 2006, A&A, 458, 453
- Vink & de Koter (2005) Vink J. S., de Koter A., 2005, A&A, 442, 587
- Walsh & Roy (1997) Walsh J. R., Roy J. R., 1997, MNRAS, 288, 726
Table A.1. Catalogue of H ii regions observed with NGC 1313. RA Dec E H ii Association # (J2000) PES W&R H1 03:17:57.2 -66:29:43.6 0.22 – – H2 03:17:57.3 -66:31:39.5 0.20 – – H3 03:18:05.3 -66:30:27.8 0.19 6 20 H4 03:18:05.3 -66:30:53.7 0.28 – – H5 03:18:07.8 -66:31:21.2 0.26 23 H6 03:18:24.8 -66:31:46.3 0.26 – – H7 03:18:25.9 -66:27:43.0 0.35 – – H8 03:18:33.3 -66:27:42.1 0.56 – – H9 03:18:40.9 -66:29:30.5 0.24 10 3
Table A.2. Catalogue of candidate He ii emission regions
within NGC 1313. Association with H ii regions identified by
Walsh & Roy (W& R, 1997) and Pagel
et al. (PES, 1980) are also given.
Note that values in parenthesis correspond to candidates which reside
close to W&R and PES regions. We present line properties and
spectral types for those regions which have been classified via
follow-up spectroscopy. Sources believed to host multiple WRs based
on the observed line flux or appearance on the continuum subtracted
4684 image have been identified. Regions which are awaiting
follow-up spectroscopy have been labelled WN? or NON-WR? depending on
their photometric excess and appearance on the continuum subtracted
4684 image. De-projected distances are expressed as a
fraction of the Holmberg radius .Dereddened line fluxes have been derived assuming
EB-V=0.29 mag and are expressed in . The number of WR stars in each source is estimated
using the line luminosity calibrations of Crowther & Hadfield (2006) and a
distance modulus of 28.08 mag (Méndez et al., 2002).
#
H ii Assoc.
mB
m4684
F(4650)+
L(4650)+
F(5808)
L(5808)
Sp
Remarks
(J2000)
W&R
PES
(mag)
(mag)
(mag)
F(4686)
L(4686)
Type
1
03:17:40.3
-66:31:30.4
1.25
22.5
21.9
–0.7
No data available
WNE
1WN
2
03:17:41.0
-66:31:37.1
1.24
22.7
21.2
–1.4
No blue data
1.1
4.9
WC4–5
3
03:17:43.6
-66:31:15.2
1.13
22.1
21.8
–0.3
1.6
9.1
WN7–9
4
03:17:46.0
-66:31:47.2
1.09
21.3
21.1
–0.2
No blue data
NON-WR?
5
03:17:47.7
-66:29:45.8
0.94
21.8
21.8
0.0
NON-WR
6
03:17:47.7
-66:29:37.4
0.95
25.0
23.3
–1.7
Neb He ii
7
03:17:57.8
-66:33:05.1
0.93
(27)
20.4
20.4
0.0
2.6
1.5
WN7–9
8
03:17:58.0
-66:33:07.9
0.93
27
20.1
20.3
0.2
2.5
1.4
WN7–9
9
03:17:59.3
-66:30:12.0
0.56
23.1
22.8
–0.3
7.2
4.0
WN2–4
10
03:17:59.7
-66:30:06.3
0.54
22
19.4
19.2
–0.3
1.5
8.6
1.7
7.3
WC4–5
2WC?
11
03:18:01.0
-66:29:29.8
0.50
22.5
21.7
–0.8
3.7
2.1
5.7
2.5
WN5–6/C4
12
03:18:01.9
-66:30:09.5
0.47
22.3
20.3
–2.0
1.5
8.6
1.0
4.5
WC4–5
Mulitiple WRs?
13
03:18:02.7
-66:32:51.6
0.79
22.7
22.2
–0.6
2.5
1.4
WN7–9
14
03:18:02.8
-66:30:14.9
0.44
21
6
17.1
17.8
0.8
4.7
2.7
WN5–6?
Mulitiple WRs?
15
03:18:03.7
-66:32:32.9
0.71
25
7
20.8
20.5
–0.4
No blue data
8.7
3.8
WC4–5
16
03:18:03.7
-66:30:23.1
0.42
21.2
20.9
–0.3
9.1
5.1
9.0
3.8
WC4–5
Mulitiple WRs?
17
03:18:03.9
-66:30:19.5
0.41
—
—
—
1.9
1.1
WN
Multiple WRs?
18
03:18:04.0
-66:30:01.8
0.39
24.1
22.8
–1.3
1.2
6.8
WN7–9
19
03:18:04.4
-66:32:46.6
0.74
23.8
23.0
–0.9
1.4
8.0
WN2–4
20
03:18:04.4
-66:30:21.2
0.39
22.0
21.4
–0.6
3.4
1.9
3.3
1.4
WC4–5
21
03:18:04.9
-66:30:27.0
0.38
20
5
20.6
20.8
0.2
1.7
9.4
WN7–9
22
03:18:05.2
-66:30:26.2
0.37
20
5
17.8
18.8
1.0
WN7–9
23
03:18:06.1
-66:30:38.0
0.36
23.3
22.9
–0.4
2.0
1.1
WN2–4
24
03:18:06.7
-66:30:21.5
0.32
21.0
20.7
–0.3
2.4
1.3
WN7–9
25
03:18:09.1
-66:30:04.6
0.22
24.2
22.7
–1.5
1.8
1.0
WN7–9
26
03:18:10.9
-66:31:07.7
0.32
19.1
18.3
–0.9
Late
27
03:18:11.1
-66:29:34.8
0.16
21.2
21.0
–0.3
NON-WR
28
03:18:11.7
-66:28:42.2
0.28
23
22.5
–0.5
WN?
29
03:18:12.7
-66:30:54.2
0.25
23.3
22.3
–1.1
2.0
1.1
WN2–4
30
03:18:13.4
-66:32:16.0
0.53
21.9
21.7
–0.2
7.3
4.1
WN7–9
31
03:18:13.5
-66:29:30.9
0.10
24
23.3
–1
2.9
1.7
5.7
2.5
WO3
32
03:18:13.6
-66:32:17.1
0.54
22.3
21.9
–0.4
1.1
6.0
WN7–9
33
03:18:13.9
-66:30:24.1
0.13
Extended
4.7
2.6
WN2–4
3WN?
34
03:18:14.2
-66:29:55.9
0.05
22.0
21.7
–0.3
WN?
35
03:18:14.9
-66:30:21.5
0.11
17
19.4
19.2
–0.2
9.0
5.1
8.0
3.5
WC4–5
36
03:18:15.0
-66:29:10.4
0.15
20.1
19.3
–0.8
Late
37
03:18:15.4
-66:29:54.0
0.01
Extended
1.1
6.0
7.8
3.5
WC4–5
38
03:18:16.6
-66:28:45.1
0.24
19.7
19.8
0.1
NON-WR
39
03:18:17.2
-66:28:36.5
0.28
20.9
20.8
–0.1
1.7
9.6
WN7–9
Table A.2 continued
#
H ii Assoc.
mB
m4684
F(4650)+
L(4650)+
F(5808)
L(5808)
Sp
Remarks
(J2000)
W&R
PES
(mag)
(mag)
(mag)
F(4686)
L(4686)
Type
40
03:18:17.6
-66:30:08.9
0.10
24.5
22.9
-1.6
3.1
1.7
WN2–4
41
03:18:17.8
-66:29:03.8
0.19
13
9
23.2
21.0
-2.2
6.3
3.5
5.9
2.6
WC4–5
42
03:18:18.2
-66:29:05.8
0.19
13
9
Extended
8.7
4.9
6.1
2.7
WC4–5
43
03:18:19.8
-66:28:43.4
0.29
12
11
Extended
NON-WR?
44
03:18:20.5
-66:30:28.6
0.22
24.0
22.5
-1.5
1.3
7.2
WN2–4
45
03:18:20.7
-66:28:29.8
0.35
25.0
24.0
-1.0
2.3
1.3
WN2–4
46
03:18:21.0
-66:28:37.4
0.33
21.7
21.5
-0.2
1.3
7.6
WN2–4
47
03:18:21.7
-66:29:44.7
0.21
21.8
21.5
-0.3
7.8
4.4
WN7–9
48
03:18:21.9
-66:30:06.3
0.22
21.1
20.0
-1.1
1.5
8.6
1.4
6.0
WC4–5
2WC?
49
03:18:21.9
-66:29:47.9
0.22
20.2
19.8
-0.3
6.7
3.8
4.6
2.0
WC4–5
Multiple WRs?
50
03:18:22.3
-66:28:42.3
0.34
(1)
22.2
21.0
-1.2
1.1
6.2
9.8
4.2
WC4–5
51
03:18:22.3
-66:28:40.5
0.35
(1)
23
22
-1
1.9
1.1
WN2–4
52
03:18:22.5
-66:30:03.8
0.24
22.8
21.9
-0.9
2.3
1.3
WN2–4
53
03:18:22.5
-66:28:45.6
0.34
(1)
23.5
22.5
-1
2.4
1.4
WN2–4
54
03:18:22.6
-66:29:41.4
0.24
—
—
—
WN?
55
03:18:22.7
-66:28:20.2
0.41
Extended
1.8
1.0
WN2–4
56
03:18:22.8
-66:28:42.7
0.35
(1)
23.5
22:
1.5
1.7
9.3
1.3
5.6
WC4–5
57
03:18:22.8
-66:28:36.1
0.37
(1)
21.9
21.2
-0.7
5.6
3.1
5.5
2.4
WC4–5
58
03:18:23.1
-66:28:40.1
0.37
10
1
Extended
8.3
4.7
WN5–6?
3WN?
59
03:18:23.5
-66:28:43.4
0.37
10
1
20.4
20.9
0.5
7.8
3.4
WC4–5+WN5–6?
60
03:18:23.5
-66:28:41.4
0.37
10
1
Extended
4.7
2.7
8.3
3.7
WC4–5
61
03:18:23.6
-66:32:57.9
0.74
28
21.2
20.0
-1.2
No blue data
2.1
9.4
WC4–5
3WC?
62
03:18:23.7
-66:32:57.7
0.74
28
21.0
20.5
-0.5
No blue data
1.1
4.6
WC4–5
63
03:18:23.8
-66:28:21.3
0.43
22.8
22.3
-0.5
WN?
64
03:18:23.9
-66:28:47.2
0.37
10
1
19.7
18.8
-0.9
4.2
2.4
2.4
1.1
WC4–5
3WC?
65
03:18:23.9
-66:28:42.7
0.38
10
1
Extended
Multiple WN?
66
03:18:23.9
-66:28:37.9
0.39
10
1
Extended
1.5
8.3
1.7
7.7
WC4–5
2WC?
67
03:18:24.1
-66:28:37.3
0.40
10
1
Extended
1.1
4.9
WC4–5+WN5–6?
68
03:18:25.7
-66:28:50.6
0.41
24.2
23.3
-0.9
WN?
69
03:18:26.7
-66:27:56.7
0.56
21.4
20.6
-0.8
Late
70
03:18:27.1
-66:28:24.5
0.51
23.3
22.7
-0.6
8.4
4.7
WN2–4
71
03:18:27.9
-66:28:42.8
0.49
9
23
21.7
-1.3
1.9
1.1
WN2–4
72
03:18:27.9
-66:28:41.9
0.49
9
20.3
20.5
0.2
7.1
4.0
WN7–9
73
03:18:28.6
-66:28:48.6
0.50
9
20.5
20.6
0.0
1.5
8.6
WN7–9
74
03:18:29.2
-66:28:42.8
0.53
(9)
21.9
22.0
0.0
SNR?
Neb He ii
75
03:18:33.1
-66:34:04.3
1.10
24.5
23.3
-1.2
No blue data
WN?
76
03:18:34.4
-66:29:18.2
0.65
22.6
22.3
-0.3
2.3
1.3
WN2–4
77
03:18:35.3
-66:29:21.7
0.68
20.6
20.4
-0.2
2.0
1.1
WN7–9
78
03:18:35.8
-66:29:36.6
0.69
22.0
22.2
0.2
2.3
1.3
WN2–4
79
03:18:35.9
-66:28:38.9
0.74
24.6
23.4
-1.2
1.4
8.1
WN2–4
Table A.2 continued
#
H ii Assoc.
mB
m4684
F(4650)+
L(4650)+
F(5808)
L(5808)
Sp
Remarks
(J2000)
W&R
PES
(mag)
(mag)
(mag)
F(4686)
L(4686)
Type
80
03:18:36.5
-66:29:31.0
0.72
5
3
25.0
24.3
-0.7
WN?
81
03:18:36.7
-66:29:32.0
0.72
5
3
24
21.6
-2
5.4
3.0
7.7
3.4
WC4–5
82
03:18:36.9
-66:29:24.1
0.73
24
23.5
-0.5
No blue data
WN?
83
03:18:36.9
-66:29:15.1
0.74
21.8
21.5
-0.4
1.1
6.3
WN7–9
84
03:18:37.1
-66:29:18.9
0.74
20.4
20.2
-0.2
NON-WR?
85
03:18:37.5
-66:29:34.8
0.75
5
3
19.0
19.9
0.9
2.4
1.4
WN7–9
Multiple WRs?
86
03:18:38.4
-66:28:46.5
0.81
(6)
22.2
21.5
-0.6
No blue data
WN?
87
03:18:38.6
-66:29:09.3
0.80
24
23.9
-0.1
NON-WN?
88
03:18:41.0
-66:30:08.9
0.87
4
19.8
19.7
-0.1
No blue data
1.4
6.1
WC4–5
2WC?
89
03:18:41.5
-66:30:19.7
0.89
21.3
21.4
0.1
NON-WR?
90
03:18:41.9
-66:29:31.0
0.90
3
10
19.5
19.3
-0.2
1.8
1.0
WN7–9
Multiple WRs?
91
03:18:42.0
-66:29:41.9
0.90
22.1
21.9
-0.1
9.0
5.1
WN7–9
92
03:18:42.4
-66:29:33.0
0.92
3
10
20.9
21.0
0.1
1.2
6.7
WN7–9
93
03:18:42.5
-66:29:41.4
0.92
20.7
20.7
0.0
NON-WR?
94
03:18:44.5
-66:29:08.5
1.00
22.2
21.2
-1.0
1.1
6.3
WN7–9
![[Uncaptioned image]](/html/0708.2039/assets/x15.png)
Fig. B.1: Master finding chart indicating the 94 candidates identified (triangles) and positions of individual finding charts (1–9). North and east are marked on this 4684 FORS1 image of NGC 1313 (6.8 6.8 arcmin).