Insulator to semiconductor transition and magnetic properties of the one-dimensional S = 1/2 system In2VO5
Abstract
We report structural, magnetization, electrical resistivity and nuclear- and electron spin resonance data of the complex transition metal oxide In2VO5 in which structurally well-defined V-O chains are realized. An itinerant character of the vanadium -electrons and ferromagnetic correlations, revealed at high temperatures, are contrasted with the insulating behavior and predominantly antiferromagnetic exchange between the localized V4+ -magnetic moments which develop below a certain characteristic temperature K. Eventually the compound exhibits short-range magnetic order at K. We attribute this crossover occurring around to the unusual anisotropic thermal contraction of the lattice which changes significantly the overlap integrals and the character of magnetic intra- and interchain interactions.
pacs:
61.10.Nz, 72.80.Ga, 75.40.Cx, 76.30.Fc, 76.60.-kI Introduction
There has been considerable interest in vanadium oxides over several decades, due to their diverse structural chemistry and unconventional physical properties. In particular metal-insulator transitions occur in several binary vanadium-oxides as prominent examples Ueda (2000). While studies of spin-ladder and spin-chain compounds were mostly concentrated on cuprate compounds like KCuBr3 and TlCuCl3 Takatsu et al. (1997), Sr2CuO3 and SrCuO2 Motoyama et al. (1996) or LaCuO2.5 Hiroi and Takano (1995), quasi low-dimensional vanadium systems such as (VO)2P2O7 Johnston et al. (1987) or AxV2O5 (A = alkaline or alkaline-earth metal) Isobe and Ueda (1996); Ueda (1998) have experienced recent attention, due to their variety of interesting quantum spin phenomena Ueda (1998); Dagotto and Rice (1996); Dagotto (1999). Spin ladders Vasil’ev et al. (2005) consist of two (or more) parallel chains, often referred to as ”legs”, with an intrachain exchange interaction parameter . Interchain interactions along the ”rungs” are then represented by the parameter . In most cases with an even number of legs the smallest magnetic entity is then given by a rectangle or exclusively by the ”rungs” which are equivalent to dimers. These systems are representatives for a spin-gap.
In this paper we present a complex vanadium oxide, In2VO5, as an experimental realization of a one-dimensional two-leg spin-1/2 ladder with ”sheared” legs, the so called zig-zag chain, where the onset of antiferromagnetic (AFM) exchange along and between the legs can be attributed to the magnetic properties of a triangle as the smallest magnetic entity, whereby frustration phenomena might occur. Although In2VO5 has been first synthesized long ago Senegas et al. (1975), to our knowledge its electronic and magnetic properties have not been explored so far. Here we report the crystal structure, magnetization, resistivity, nuclear magnetic (NMR) and electron spin resonance (ESR) measurements of In2VO5. We observe a relationship between structural, charge and spin degrees of freedom in this compound. In particular, experimental data give evidence that an unusual anisotropic thermal contraction yields localization of the itinerant -states with decreasing temperature below K that concomitantly results in a crossover from ferromagnetic (FM) to antiferromagnetic (AFM) exchange interaction between the vanadium spins which eventually short-range order below K.
II Experimental
Single crystal and powder samples for the present study were prepared as described by Senegas Senegas et al. (1975). In2O3 (Chempur, 99.9%) and VO2 (Chempur, 99.5%) were dried before grounding. The reaction mixture of typically 1.3 g was then encapsulated under a vacuum in a silica ampoule. The sealed ampoule was heated directly to 1323 K. After three days the furnace cooled down to room temperature at a rate of 5 K/h. Small black single crystals of In2VO5 were obtained, selected under a microscope and prepared for single crystal x-ray diffraction. The crystals were of needle shape and typically 0.10.10.3 mm in size. Single crystal x-ray diffraction was performed at 293 K and 100 K on an IPDS II diffractometer (Stoe&Cie). For powder x-ray diffraction (Cu-Kα radiation) a Siemens D5000 diffractometer equipped with a self-assembled helium cryostat for low temperature measurements was used. Lattice constants were derived from a LeBail fitting routine using the program FullProf Rodriguez-Carvajal (2005). Magnetization measurements were carried out on a PPMS vibrating sample magnetometer (Quantum Design). The electrical resistivity (standard four-point method) was measured on a pressed and then at 1073 K (12 h) sintered powder pellet. The purity of the sample after sintering was checked again by powder x-ray diffraction. Absorption spectroscopy was performed on standard PE (FIR) and KBr (MIR) pellets at room temperature using a Bruker IFS-66v/s spectrometer. With KBr diluted powder pellets were measured on a Cary 05E (Varian) spectrometer in the NIR-Vis-UV range at temperatures from 293 to 20 K. ESR measurements were carried out at a frequency of = 9.5 GHz with a standard X-Band Bruker EMX Spectrometer and also in a frequency range of 140 to 360 GHz with a home made tunable high-field ESR spectrometer on the basis of the Millimeterwave Vector Network Analyzer from AB Millimetre, Paris, and in a 17 T superconducting magnetocryostat from Oxford Instruments Ltd. (see Ref. Golze et al. (2006) for details). 51V NMR data were recorded on a Tecmag pulse solid-state NMR spectrometer in a magnetic field of 9.2 T in a temperature range 4.2 - 200 K. The NMR spectra were acquired by a point-by-point magnetic field sweeping. The transversal and the longitudinal relaxation times and have been measured at the frequency of the maximum intensity of the spectrum. has been determined from the Hahn spin echo decay. A method of stimulated echo has been used to measure .
III Crystal structure
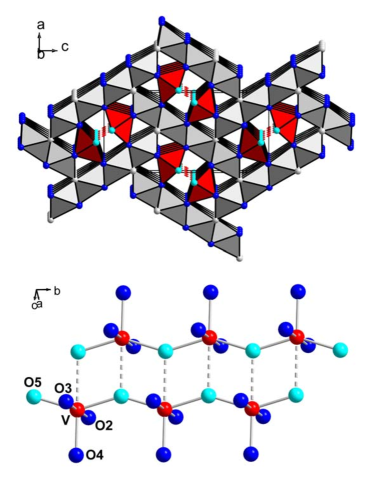
In 1975 Senegas et al. Senegas et al. (1975) reported the synthesis and crystal structure of In2VO5 at room temperature. We have re-determined the crystal structure at 293 K and 100 K see Table 1. The previous structure solution is confirmed by our data ics . Furthermore, no structural phase transition has been observed from single crystal data down to 100 K. Therefore, we limit the structure description to the important structural features for understanding the physical properties and refer to Senegas et al. Senegas et al. (1975) for a more detailed discussion of the interatomic distances and angles. Fig. 1 gives a perspective view of the crystal structure of In2VO5. A three-dimensional network of [InO6] octahedral units is present. This constitutes of [In4O10] slabs of edge sharing entities which are connected via corner oxygens O1 with identical slabs, giving rise to a [In4O8] framework. It should be noted that the coordination sphere of O1 consists only of four In atoms in a tetrahedral fashion with three In belonging to a common and one to an independent slab. Thereby, a nonmagnetic anionic framework with one-dimensional cavities along [010] is formed. The magnetic cations (V4+, , ) are connected to the network via oxygens O2, O3 and O4. Two O5 complement the coordination sphere of each V, which can be described as a distorted trigonal bipyramid. These entities are linked exclusively via O5 to zig-zag chains, [O3V(O5)2/2], in [010]. The second coordination sphere increases the C.N.(V) from 5 to 6 and the (sheared) ladder-type structural feature is accomplished: [{O3V(O5)3/3}2]. The prominent structural difference between 100 K and 293 K is the decreasing distance of V-O5 connecting two legs by 1.5 pm, marked by dotted lines in Fig. 1.
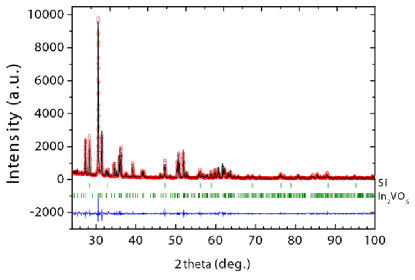
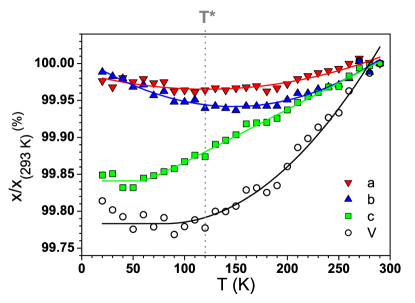
A typical refinement of x-ray powder data from which the lattice parameters were extracted, can be seen in Fig. 2. The evolution of the cell axes and the cell volume is shown in Fig. 3. The cell volume decreases roughly linearly with temperature down to 120 K and remains constant within standard deviations at temperatures below. The overall decrease in cell volume from 290 K to 120 K is 0.25 %.
We found no indication of a structural transition down to 20 K from powder x-ray diffraction data, but rather a continuous change from an isotropic decrease of the lattice constants to an anisotropic behavior at 150 K. Below 200 K the decrease of the and parameters levels off and turns into a slight increase by further lowering the temperature from K to 20 K. This is in contrast to the behavior of the parameter, which decreases almost linearly down to 50 K. It should be noted that the absolute values of the lattice parameters do not alter with temperature by more than 0.2% relative to 290 K.
As will be shown below, the important consequence of the anisotropic temperature dependence of the lattice parameters for the magnetism of In2VO5 is that below a certain temperature the V-V distance along [010] begins to increase slightly or stays almost constant whereas it decreases for two adjacent chains.
| space group | Pnma | Z = 4 | |
| 293 K | 100 K | ||
| 725.1(1) | 724.6(1) | ||
| 346.90(7) | 346.68(7) | ||
| 1487.7(3) | 1485.9(3) | ||
| In - O | 210.0(3) - 224.0(2) | 210.1(4) - 223.8(2) | |
| V - O4 | 178.1(4) | 178.2(4) | |
| O5i | 181.2(1) | 181.1(1) | |
| O5ii | 181.2(1) | 181.1(1) | |
| O2 | 201.9(4) | 201.6(4) | |
| O3iii | 204.4(4) | 203.9(4) | |
| O5iii | 226.9(4) | 225.4(5) | |
| V - V | 328.6(1) a) | 327.6(1) a) | |
| 346.9(1) b) | 346.7(1) b) | ||
| i 1-x, 0.5+y, 1-z ii 1-x, y-0.5, 1-z iii x-1, y, z | |||
| a) ”rungs” b) ”legs” | |||
IV Magnetization measurements
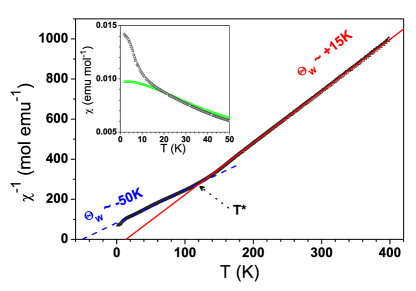
The static susceptibility of In2VO5 was measured on a powder sample in external fields of 1 T in field cooled (FC) and zero field cooled (ZFC) modes and at 14 T in a ZFC mode. The results are shown in Fig. 4.
The inverse susceptibility exhibits a broad kink around a characteristic temperature K which separates two linear regimes with different slopes of . The fit of the experimental data above to the Curie-Weiss law yields the Curie constant emu/molK and a positive Weiss temperature K that indicates ferromagnetic (FM) interactions between the V spins. A similar fit at yields emu/molK and a negative K implying the net AFM exchange between the V spins. The value of at corresponds approximately to the Curie constant of uncorrelated paramagnetic moments with the -factor . An appreciable increase of for indicates the significance of the magnetic correlations in the low temperature regime which will be discussed below.
The FC and ZFC measurements of in a field of 1 T reveal no differences over the whole temperature range. The ZFC curves for the two fields 1 T and 14 T are also similar within the experimental error except the low temperature range K where the susceptibility measured at 14 T is smaller as compared to the 1 T data (see inset of Fig. 4).
Measurements of the field dependence of the magnetization at several selected temperatures are shown in Fig. 5. curves reveal no hysteresis and are linear in the accessible field range T except at the lowest temperature of 1.9 K. The Brillouin function of noninteracting moments (, ) is shown for comparison. One notices that compared to the Brillouin function the experimental -curves exhibit larger slopes for K whereas the slopes are strongly reduced at low temperatures and no tendency to the saturation even at the highest applied field can be seen. This evidences, similarly to the data, a crossover from the FM- to the AFM type of interactions between the vanadium spins with decreasing temperature. A nonlinear initial increase of curve in small fields at 1.9 K (see inset of Fig. 5) suggests the occurrence of % of impurity spins which are saturated in a field of a few Tesla at low s. That would explain the smaller low- values of measured at T.
We note that although our static magnetic data reveal appreciable magnetic correlations no evidence for the occurrence of the long-range magnetic order in In2VO5 can be found in the studied temperature range sh .

V Electrical resistivity and spectroscopic characterization
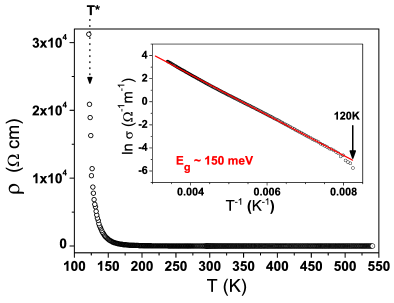
The electrical resistivity of a pressed and sintered powder pellet of In2VO5 in the temperature range of 100 K to 540 K is shown in Fig. 6. In the high temperature regime does not change significantly as indicated by (290 K) = 3.30 cm and (500 K) = 2.66 cm whereas below K the resistivity increases dramatically. Except at temperatures close to K the resistivity follows the Arrhenius law which yields a linear dependence of the logarithmic plot of the conductivity versus with the slope given by the activation energy meV (Fig. 6, inset). By approaching the conductivity drops down indicating the transition from semiconducting to insulating behavior. Notably, one can relate this transition to the crossover in the -dependence of the magnetic susceptibility occurring around (Fig. 4). We recall that at this temperature also the crystallographic and axes begin to increase slightly (Fig. 3), whereas the anisotropic lattice contraction sets in below K (Fig. 3).
Standard optical characterization of In2VO5 reveals in the infra-red region the expected vibration modes (phonons) below 800 cm-1 100 meV (spectra not shown here). Above 1000 cm-1 transmittance is significantly reduced reaching a constant value at cm-1 135 meV, which corresponds approximately to the optical band gap and is in agreement with the band gap obtained from the resistivity measurements.
As suggested by the resistivity data insulating behavior is present below K. Therefore, we studied the temperature dependence of In2VO5 in the near infra-red - visible part of the electromagnetic spectrum (4000 - 20000 cm-1). No changes in the absorbance were detected and no indication of electronic transitions according to a localized [VO6]-chromophore were observed. This again corroborates the picture of a semiconductor with a band gap (thermal or optical activation energy) at lower energies than the studied spectral range, e.g. eV.
VI Magnetic resonance
To elucidate the interplay between structure, conductivity and magnetism in In2VO5 suggested by the experimental data in Sections III, IV and V we have studied the magnetic resonance of the nuclear- and electronic spins at the vanadium site. NMR and ESR probe on a local scale the electron-spin dynamics and spin correlations.
VI.1 NMR measurements
51V NMR in In2VO5 has been studied at a frequency of 103 MHz in a temperature range 4.2 - 200 K. Typical spectra are shown in the inset of Fig. 7. The 51V nucleus has a spin and possesses a nuclear quadrupole moment. Owing to the interaction of the quadrupole moment with the gradient of the electrical crystal field the 51V NMR spectrum may generally acquire a structure consisting of the main central line and 6 satellites. However, in the case of In2VO5 the satellites are unresolved in the powder spectrum and its shape can be described by a single Gaussian line profile (solid and dashed lines in the inset of Fig. 7). The NMR-lineshape, the resonance field and the linewidth are almost unchanged in the studied temperature range. Only by approaching the lowest temperature of 4.2 K can a small broadening of the signal and a shift of its position to lower fields be observed. However, both the nuclear transversal (spin-spin) and the longitudinal (spin-lattice) relaxation rates, and , show a temperature dependence (Fig. 7, main panel). There is a sharp enhancement of both relaxation rates peaked at K followed by their slowing down at higher temperatures. The 1/T2 rate levels off at K and exhibits a small hump at about 150 K which only slightly exceeds the experimental error. continues to decay smoothly up to K where it reaches a constant value of 16 s-1.
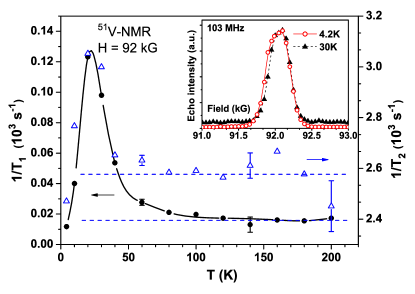
Generally, the nuclear relaxation can be caused by electric quadrupole and magnetic interactions. The strong enhancement of the nuclear relaxation processes near 20 K can be straightforwardly related to the critical slowing down of magnetic fluctuations in the electronic subsystem. The electron spins of vanadium, fluctuating with some characteristic frequency , exert an effective field at the vanadium nuclear spin owing to the on-site hyperfine coupling. The transverse component of this field contributes to the longitudinal nuclear spin relaxation as Slichter (1980). Here is the nuclear gyromagnetic ratio and is the nuclear Larmor precession frequency. The relaxation is maximum when the fluctuations of the electron spins slow down to the NMR frequency, . The rate reduces in the case of both fast- () and slow fluctuating () or static electron spins. The peak in the -dependence of thus clearly indicates a transition to a magnetically ordered or very slowly fluctuating phase in In2VO5 at K. A similar spin fluctuating relaxation mechanism may give a contribution to the total transversal nuclear spin relaxation rate in addition to the contribution arising from nuclear spin-spin couplings, e.g. magnetic dipolar or indirect interactions Slichter (1980). The fact that the peak in the dependence of versus occurs at the same temperature as for the rate corroborates its assignment to the onset of a (quasi)-static magnetic order.
However, below we do not observe a significant broadening and/or splitting and shift of the NMR line indicative of the development of the staggered magnetization in the long-range AFM ordered state. The occurrence of the peak in the nuclear relaxation rates is associated with only a small broadening and shift of the NMR line at . It is therefore plausible that only a short-range (glassy-like) magnetic order (SRO) is realized in In2VO5 below which can be detected by local magnetic resonance techniques (see also Section VI.2 below) but not by the bulk thermodynamic measurements discussed in Section IV and Ref. sh, .
The longitudinal relaxation rate 1/T1 of the vanadium nuclei arising due to the hyperfine coupling with the electron spins is proportional to the imaginary part of the momentum and frequency dependent electron dynamic susceptibility at small energies as 1/T Moriya (1962). The independence of 1/T1 on temperature at implies then a Curie-like dependence of consistent with the behavior of the susceptibility in the static limit (cf. Fig. 4). Therefore, in spite of a significant reduction of the resistivity and evidence for the delocalization of the -electrons above from the ESR measurements (see Section VI.2 below) In2VO5 has not yet reached the limit of a band metal for which a -independent susceptibility and a linear in temperature Korringa-like relaxation 1/T is expected Korringa (1950).
Interestingly, the longitudinal relaxation rate 1/T1 which probes the dynamic spin susceptibility of the electronic system on the NMR time scale and can also be sensitive to charge fluctuations via the quadrupole relaxation channel, remains appreciably -dependent even far above . Thus, it is tempting to associate the onset of this -dependence with a crossover from band- to localized AFM interacting -states that is identified in the ESR measurements (see Section VI.2 below) at the same characteristic temperature K. Moreover, one can speculate that a small hump in the -dependence of the nuclear spin-spin relaxation rate is related to the change of the lattice contraction from the isotropic to anisotropic regime at K. Because these structural changes affect the nearest-neighbor distances and bond angles between V sites, this could alter the nuclear dipole-dipole interactions contributing to .
VI.2 ESR measurements
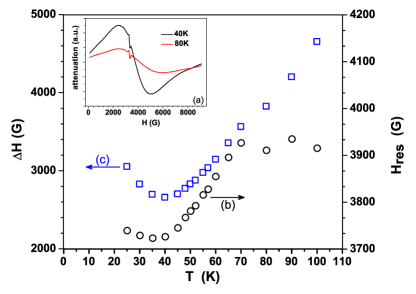

No ESR response from the powder sample of In2VO5 can be detected at room temperature regardless the frequency of the measurement. However, a well-defined ESR signal which can be associated with the resonance of bulk V4+ () ions emerges below 130 K. At = 9.5 GHz (X-Band) ESR is measured by a lock-in phase-sensitive detection with a sample placed in the resonance cavity. With this technique the detected signal is a field derivative of the microwave absorption . The shape of the signal from In2VO5 can be described by a single-derivative Lorentzian line profile (Fig. 8a). The line is very broad at high temperatures. However the width of the signal rapidly decreases with decreasing the temperature down to 40 K and then starts to increase again (Fig. 8c). The position of the resonance shifts to lower fields in the same temperature range (Fig. 8b). Remarkably, the ESR signal vanishes upon approaching a temperature of K.
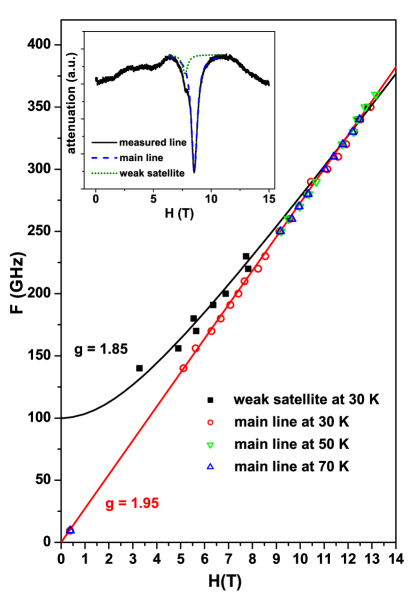
In the high frequency regime (140 - 360 GHz) the transmission of the microwave radiation through the sample has been measured as a function of magnetic field without a resonance cavity. A typical spectrum at = 230 GHz is shown in the inset of Fig. 9. Unlike the X-Band measurement, the fit of the absorption line requires two Lorentzians: A strong main resonance line and a weak satellite on the left shoulder. The frequency versus magnetic field relation of these two resonance modes is shown in the main panel of Fig. 9. The dependence of the main signal is linear. Its extrapolation to low fields intersects the origin and matches very well with the measurement at GHz. In contrast to the main line, the -branch of the weak satellite has an appreciable frequency offset GHz corresponding to an energy gap for this resonance excitation.
From the slope of the main linear -branch the -factor can be calculated, in perfect agreement with the results of the angular overlap model (AOM) calculations ( and the principal -values of 1.92, 1.94 and 1.96, see below). Note that at all measured frequencies no deviation from the Lorentzian shape has been observed, indicating that the anisotropy of the -factor which should yield the spread of the resonance fields in the polycrystalline samples is smaller than the width of the resonance. With the linewidth of the order of 1 T the estimated anisotropy of the -factor is smaller than a few percent which corroborates the AOM calculation.
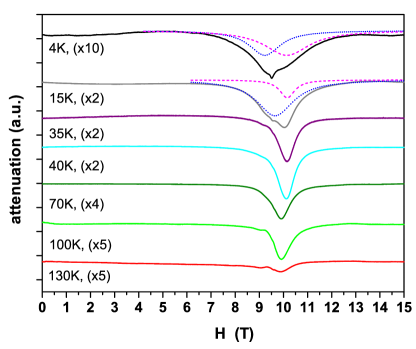
The evolution of the ESR spectrum with temperature at GHz is shown in Fig. 10. Note that at this frequency the weak satellite merges with the main line (Fig. 9). Therefore, the signal can be described by a single Lorentzian absorption profile in a wide temperature range. The -dependence of and obtained from the Lorentzian fit is shown in Fig. 11. is temperature independent whereas continuously increases with lowering the temperature. Below 20 K the signal not only broadens but also acquires an asymmetrical shape indicating the development of an additional resonance mode. Fitting the line profile for K with two Lorentzians (Fig. 10) yields the -dependence of the linewidth and the resonance field for the additional mode which is plotted in Fig. 11. One can observe the shift and narrowing of this mode whereas the main absorption line continues to broaden with const.
The development of the additional mode corresponds nicely with the occurrence of the SRO state in In2VO5 at K suggested by the NMR data. It can be related to an AFM-like collective magnetic excitation in the SRO regions which sharpens and shifts away from the paramagnetic line. The coexistence of this mode with the paramagnetic signal implies the presence of non-ordered regions at which would be consistent with a continuous spin-glass freezing scenario. Such an extremely broad ESR response below can only be observed at high excitation frequencies and not in a ”low” frequency X-Band measurement.
Rapid disappearance of the ESR signal from the localized -states of V4+ by heating the sample over a characteristic temperature K is unusual. In particular, it coincides with a significant increase of the conductivity of In2VO5 around this temperature. Therefore, one can speculate that is a characteristic temperature for delocalization of the -electrons which at begin to contribute to the conductivity. That would naturally explain the vanishing of the ESR signal. Even if delocalization occurs on a scale of some lattice constants it would yield the momentum scattering of electrons which owing to the significant spin-orbit coupling should result in extremely short spin relaxation times.
The occurrence of the weak satellite mode with an excitation energy gap GHz is not expected if one considers the resonance of an system, like isolated V4+ ions, or ions coupled in a chain. Here one requires a correlated spin cluster with a total spin . Feasible AFM correlations of V4+ spins on a triangular pattern along the vanadium chain will be discussed in Section VII below. By considering, for simplicity, an isolated AFM triangle of spins-1/2, one can qualitatively explain the ESR-observations. Speculatively, the weak satellite may correspond to a resonance transition between the ground state of the triangle and its high energy state. In ESR the total spin is a conserved quantity. Therefore, a transition between different spin multiplets is forbidden. However, in the presence of anisotropic magnetic interactions, such as e.g. the Dzyaloshinskii-Moriya interaction, different spin states can be mixed and the resonance between them may become visibleSakai et al. (1986). In this scenario the excitation gap GHz is a measure of the energy separation between the and states of the triangle.
VII Discussion
In order to grasp the different aspects of the rich physics of In2VO5 emerging from the structure, magnetization and spectroscopy measurements it is useful to start with the properties of the orbital states of the V4+ () ion. The degeneracy of the ground state -orbitals, where a single -electron resides will be lifted mainly by the -antibonding interactions with the O2- ligands for the [VO6] metal-ligand complex. A convenient method based on ligand field theory is an analysis within the angular overlap model (AOM)Schäffer (1973); Jørgensen et al. (1963); Cruse et al. (1980). The AOM calculations include the interatomic distances and angles derived from the single crystal structure determination, and therefore, distortions from an octahedral ligand field can be accounted for. Since the interaction between V4+ and O2- depend on the interatomic distances, it is quite reasonable to assume a first and a second coordination sphere, [VO5+1], comprising 5 nearest neighbor oxygens O2, O3, O4 and 2O5 on the first one, and the 6th neighbor O5 on the second sphere, respectively (see Fig. 12 and Section III). Then the orbital splitting for all ligands within an orthogonal coordination frame will correspond to sketch (A) in Fig. 12 with the degenerate and orbitals being lowest in energy. Inclusion of the observed deviation from linearity along [010] for the two nearest O5 ligands parametrized by the angle (Fig. 12) will lift this degeneracy (Fig. 12, sketch (B)). The relative energy difference of the to the lower orbital is then entirely dependent on the different amount of the -antibonding interaction for the first and second coordination spheres. Since for the orbital this interaction, based upon distances, will be much smaller than the former one, the ground state will be associated with the orbital in any case for the local structure. To check these results we have calculated the relative energy separation between the and as a function of -antibonding interaction and the corresponding average molecular -value including spin-orbit-coupling. From these calculations one can estimate that should be at least eV to account for as observed in the ESR experiment. The complete calculation including all distances and angle dependencies of the ligands will shift the relative energy of the orbital highest to eV.
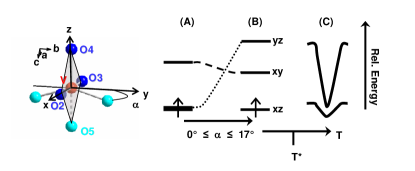
The ground state E(xz) configures the occupied -orbital in a -stacking fashion along the -axis which practically do not overlap. On the other hand, the two excited states E(xy, yz) are oriented in a arrangement in this direction, which might lead to an effective overlap involving O5 orbitals whereby a significant covalency is anticipated. In this scenario one would expect a considerable degree of delocalization along the direction for the electrons promoted into these overlapping molecular orbitals. One may speculate about a narrow band formation that is depicted in sketch (C), Fig. 12, which would favor a ferromagnetic polarization of the -electrons. Strong indications for the relevance of this scenario in the high temperature regime above are given by significant conductivity, ferromagnetic sign of the net exchange derived from the measurements and the absence of the ESR response which is suggestive of the itinerant character of the -states.
Lowering the temperature yields a crossover to the anisotropic thermal contraction which sets in at K. Below K the lattice parameter even starts to increase slightly. The shrinking of the lattice parameter implies a decrease of the distance between the vanadium and the O5 ligand in the neighboring chain (Fig. 13, inset) thus increasing the overlap of the -orbitals with the -orbitals of that ligand. Considering the orientation of the -orbitals and the interchain bond angle V - O5 - V of 106∘ one would expect an increase of the AFM superexchange between the vanadium chains. Concomitantly, owing to the increasing lattice parameter, the width of the hybridized band in the chain direction (Fig. 12, sketch (C)) should decrease and become thermally depopulated. One could speak therefore of a temperature and structurally driven crossover from the itinerant-like ferromagnetically (FM) correlated linear chain along [010] with the effective exchange (FM) to the zig-zag chain of localized spins with the AFM nearest neighbor interaction (AFM) (Fig. 13, inset).
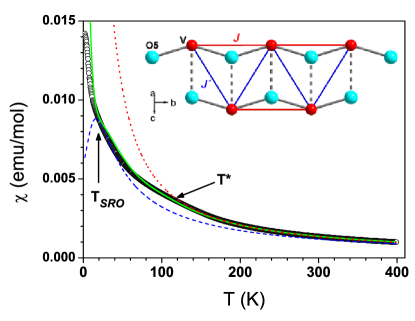
Neglecting , the best fit of the susceptibility data for according to a high temperature (HT) series expansionG. A. Baker et al. (1964) is obtained with +22 K (Fig. 13). A poor fit of the low temperature regime () to a Bonner-Fisher modelBonner and Fisher (1964) of an chain with -25 K is given as well in Fig. 13. Note that the corresponding result for a HT series expansionG. A. Baker et al. (1964) model is obtained for K. Comparing these results gives an estimate of the ratio . Both limiting cases do not match the experimental findings below . The magnetic interactions seem to change gradually in the regime between K and 120 K.
To account for the situation occurring in the intermediate temperature range we consider short-range spin correlations extending over three neighbor vanadium sites in a triangle fashion (Fig. 13, inset). For simplicity reasons we discuss an isolated spin trimer as the smallest magnetically coupled entity. The relative zero field energy of states of a trimer consisting of spins and coupled together via the exchange path and both of them coupled to the third spin via can be deduced from the spin Hamiltonian Kahn (1993):
| (1) | |||
| (2) |
with S′ = SA1+SA2 and S = S′ + SB.
The relative energy of states in zero field is depicted in Fig. 14. If we use the observed isotropic local -tensor, the susceptibility can be derived by applying the Van-Vleck formula after adding the Zeeman perturbation. Since the interaction parameter is expected to increase as the temperature decreases, we let, for the interpretation within this model, be a function of temperature: and K. The result for a trimer is given in Fig. 13 and qualitatively matches the experimental data above K, where NMR and ESR indicate a drastic slowing down of spin fluctuations.
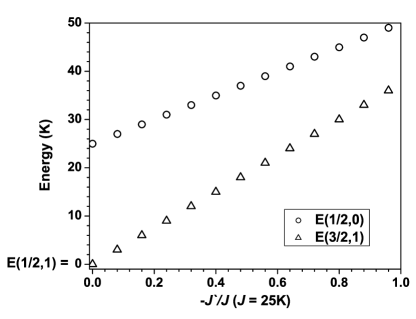
Despite obvious oversimplifications the principal features of the susceptibility data obtained for In2VO5 and the observation of the additional gapped mode in the ESR experiment are reasonably explained by assuming the model of a magnetic triangle above 20 K. The energy gap between the E(1/2,1) ground and the first excited state E(3/2,1) corresponds to 15 K () for an isolated triangle, see also Fig. 14. From ESR measurements this gap K is somewhat smaller, possibly because of the obvious correlations between the magnetic units (triangles), which are arranged by inversion symmetry in an anti-parallel alignment along the -axis and thereby form the zig-zag chain. The large Curie constant of 0.615 between K and 20 K might indicate substantial contributions/admixtures of the almost degenerate states E(1/2,1) and E(3/2,1) for a triangle that are even more enhanced for the zig-zag chain. This might be one reason that the nominally ”forbidden” resonance transition between these two states is observed in the ESR experiment.
VIII Summary
In summary, from measurements of structural parameters, magnetization, electrical resistivity and magnetic resonance of In2VO5 we have presented extensive experimental evidence for the interplay of crystal structural and electronic structure changes that induce a transition from a semiconducting behavior with ferromagnetic correlations at high temperatures to the insulating regime with predominantly antiferromagnetic interactions between vanadium localized moments at low temperatures. A simple model of correlated spins coupled along the crystallographic axis on a triangle pattern qualitatively explains the main observations. Our results bring new insights into the rich physics of complex vanadium oxides and call for theoretical modeling of the band structure and magnetic interactions in In2VO5. First results recently published by Schwingenschlögl Schwing (2007) are in line with our experimental findings above .
Acknowledgements.
This work was supported by the DFG thorough SFB 608. The authors would like to thank D. Senff and M. Braden for using the low temperature powder x-ray diffraction equipment and N. Tristan for technical support. Valuable discussions with D. Khomskii are gratefully acknowledged. The work of EV was supported by the DFG grant BU 887/5-1 and by the Russian Foundation for Basic Research through grant No. 07-02-01184-a. MY acknowledges the Fellowship from the DAAD.References
- Ueda (2000) Y. Ueda, J.Phys. Soc. Jpn. Suppl. B 69, 149 (2000).
- Takatsu et al. (1997) K. Takatsu, W. Shiramura, and H. Tanaka, J. Phys. Soc. Jpn. 66, 1611 (1997).
- Motoyama et al. (1996) N. Motoyama, H. Eisaki, and S. Uchida, Phys. Rev. Lett. 76, 3212 (1996).
- Hiroi and Takano (1995) Z. Hiroi and M. Takano, Nature 377, 41 (1995).
- Johnston et al. (1987) D. C. Johnston, J. W. Johnson, D. P. Goshorn, and A. J. Jacobson, Phys. Rev. B 35, 219 (1987).
- Isobe and Ueda (1996) M. Isobe and Y. Ueda, J. Phys. Soc. Jpn 65, 3142 (1996).
- Ueda (1998) Y. Ueda, Chem. Mater. 10, 2653 (1998).
- Dagotto and Rice (1996) E. Dagotto and T. M. Rice, Science 271, 618 (1996).
- Dagotto (1999) E. Dagotto, Rep. Prog. Phys. 62, 1525 (1999).
- Vasil’ev et al. (2005) A. N. Vasil’ev, M. M. Markina, and E. A. Popova, Low Temperature Physics 31, 203 (2005).
- Senegas et al. (1975) J. Senegas, J.-P. Manaud, and J. Galy, Acta Cryst B31, 1614 (1975).
- Rodriguez-Carvajal (2005) J. Rodriguez-Carvajal, FullProf2000, 3.30 June 2005 (Laboratoire Léon Brillouin CEA-CNRS; http://www-llb.cea.fr/fullweb/fp2k/fp2k.htm, Gif-sur-Yvette, Cedex, France, 2005).
- Golze et al. (2006) C. Golze, A. Alfonsov, R. Klingeler, B. Büchner, V. Kataev, C. Mennerich, H.-H. Klauss, M. Goiran, J.-M. Broto, H. Rakoto, S. Demeshko, G. Leibeling, F. Meyer, Phys. Rev. B 73, 224403 (2006).
- (14) Further structural details can be obtained from the Fachinformationszentrum Karlsruhe (D-76344 Eggenstein-Leopoldshafen, FAX (+49)7247-808-666, email: crysdata@fiz-karlsruhe.de) by quoting the depository numbers, CSD-No. 417999 (293 K) and 418000 (100 K).
- (15) Our measurements of the specific heat between 2 and 200 K give no indications for a transition to a magnetically ordered state as well.
- Slichter (1980) C. P. Slichter, Principles of Magnetic Resonance (Springer, Berlin, 1980), 2nd ed.
- Moriya (1962) T. Moriya, Prog. Theor. Phys. 28, 371 (1962).
- Korringa (1950) J. Korringa, Physica 16, 601 (1950).
- Sakai et al. (1986) Y. Sakai, K. Kaneda, N. Tsuda, and M. Tanaka, J. Phys. Soc. Jpn. 55, 3181 (1986).
- Schäffer (1973) C. E. Schäffer, Structure and Bonding 14, 69 ,and references therein (1973).
- Jørgensen et al. (1963) C. K. Jørgensen, R. Pappalardo, and H.-H. Schmidtke, J. Chem Phys. 39, 1422 (1963).
- Cruse et al. (1980) D. A. Cruse, J. E. Davis, J. H. Harding, M. Gerloch, D. J. Mackey, and R. F. McMeeking, CAMMAG, a FORTRAN Program (Cambridge, 1980).
- G. A. Baker et al. (1964) J. G. A. Baker, G. S. Rushbrooke, and H. E. Gilbert, Phys. Rev. 135, A1272 (1964).
- Bonner and Fisher (1964) J. C. Bonner and M. E. Fisher, Phys. Rev. 135, A640 (1964).
- Kahn (1993) O. Kahn, Molecular Magnetism (Wiley-VCH, 1993).
- Schwing (2007) U. Schwingenschlögl, Phys. Rev. B 75, 212408 (2007).