Linking Jet Emission, X-ray States and Hard X-ray Tails in the
Neutron Star X-ray Binary GX 17+2
Abstract
We present the results from simultaneous radio (Very Large Array) and X-ray (Rossi-X-ray Timing Explorer) observations of the Z-type neutron star X-ray binary GX 17+2. The aim is to assess the coupling between X-ray and radio properties throughout its three rapidly variable X-ray states and during the time-resolved transitions. These observations allow us, for the first time, to investigate quantitatively the possible relations between the radio emission and the presence of the hard X-ray tails and the X-ray state of the source. The observations show: 1) a coupling between the radio jet emission and the X-ray state of the source, i.e. the position in the X-ray hardness-intensity diagram (HID); 2) a coupling between the presence of a hard X-ray tail and the position in the HID, qualitatively similar to that found for the radio emission; 3) an indication for a quantitative positive correlation between the radio flux density and the X-ray flux in the hard-tail power law component; 4) evidence for the formation of a radio jet associated with the Flaring Branch-to-Normal Branch X-ray state transition; 5) that the radio flux density of the newly-formed jet stabilizes when also the normal-branch oscillation (NBO) in the X-ray power spectrum stabilizes its characteristic frequency, suggesting a possible relation between X-ray variability associated to the NBO and the jet formation. We discuss our results in the context of jet models.
1 Introduction
In X-ray binaries (XRBs), the studies of relativistic radio jets and their coupling with X-ray properties received a boost in the last decade thanks to coordinated multiwavelength observations. Black hole (BH) systems are surely the best studied among the relativistic jet XRB sources (see Fender 2006 for a review). However, relativistic jets are not exclusively associated with BHs. The jet phenomenology observed in BHs can be found in neutron star (NS) XRBs as well: 1) highly-accreting NS XRBs can launch transient jets at ultra-relativistic velocities (e.g. with bulk Lorentz factors of more than 15 in Cir X-1; Fender et al. 2004); 2) low-luminosity NS XRBs can form a compact jet of the same kind observed in BH XRBs and active galactic nuclei (i.e. 4U 0614+091; Migliari et al. 2006). The necessary ingredients for the formation and launch of relativistic jets seem not to be related to the nature of the compact object. Therefore, studies of NS jets and their connections to the accretion properties have an important impact on our understanding of jet sources in general. In BH XRBs, studies of the accretion mode transitions and their coupling to the jet activity (e.g., Fender, Belloni & Gallo 2005) rely on observations of occasional outbursts, of which there are 1-2 per year and which usually last a few months. In the case of NS XRBs and especially in the highly-accreting class of NSs called ‘Z-type’ (see below), we observe periodic X-ray state transitions on timescales of a few days. These state transitions are thought to be triggered by accretion rate changes. Z sources can be considered as the NS ‘counterparts’ of transient highly-accreting BHs like GRS 1915+105 (see e.g. discussion in Migliari & Fender 2005). Studying Z-type NSs, we are therefore able to assess the evolution of the accretion and jet activity in a very short observational time and more regularly than in transient BH sources.
Z-type NS XRBs are a class of seven among the brightest XRBs in our Galaxy: Sco X-1, Cyg X-2, GX 17+2, GX 5-1, GX 340+0, GX 349+2 and XTE J1701-462 (eight if we add the ‘peculiar’ Z-source Cir X-1; Shirey, Bradt & Levine 1999). The name of the class derives from the characteristic ‘Z’ shape they trace in the color-color diagram (CD; Hasinger & van der Klis 1989; see van der Klis 2006 for a review). The three branches which form the Z-shaped CD are called the Horizontal Branch (HB), Normal Branch (NB) and Flaring Branch (FB), and define three distinct states of the systems, each with its own specific X-ray spectral and timing properties (see e.g. Homan et al. 2002 for the specific case of GX 17+2). The relations between spectral and timing properties and the position on the CD suggest the accretion rate as the major physical parameter behind the position along the Z track (e.g. van der Klis 2006 for a review). Homan et al. (2007) showed that the complex variability behaviour of XTE J1701-462 could be explained if the changes along the track are governed, not simply by the mass accretion rate through the disk, but by the ratio between this quantity and its time-averaged variations (see also van der Klis 2000). Z sources show luminosities persistently near or above the Eddington limit and are very bright and rapidly variable both in X-rays and in the radio band. The Z-type NSs change X-ray states on timescales of hours to days, so they are always at the ‘edge’ of state transitions. They are therefore very good laboratories to study the connection between X-ray properties, state changes and radio behaviour in X-ray binary systems. Z-type NSs show optically thick radio emission (i.e., , where and is the flux density at the frequency ) and frequent optically thin radio flares (). The optically thick emission is usually interpreted as radiation from a continuously replenished compact jet (see Fender 2006 for a review), while the optically thin radio flares are possible signatures of fast ejected plasmons, already observed as extended lobes in Sco X-1 (Fomalont et al. 2001a,b) and Cir X-1 (Fender et al. 1999; Fender et al. 2004).
Looking in detail at the radio behaviour of Z sources as a function of their X-ray properties, Penninx et al. (1988) first found in GX 17+2 that the radio emission varied as a function of the position in the X-ray CD, decreasing with increasing inferred mass accretion rate from the HB (strongest radio emission) to the FB (weakest radio emission). A behaviour consistent with GX 17+2 has been found also in Cyg X-2 (Hjellming et al 1990a) and Sco X-1 (Hjellming et al 1990b), the exception seems to be GX 5-1 (Tan et al. 1992; but see discussion in Migliari & Fender 2006). Based on the results of these previous simultaneous radio/X-ray observations and - mostly - on observations of Sco X-1 (Fomalont et al. 2001b; Bradshaw et al. 2003), a possible coherent phenomenological picture of Z sources, coupling X-rays ( keV) and radio properties, has been drawn (Migliari & Fender 2006). In our sketch, 1) the compact jet is mostly responsible for the radio emission in the HB and partially in the NB; 2) X-ray state transitions are coupled with transitions also in the jet emission, specifically transient radio optically thin flares appear to occur at the HB-to-NB transition (see Fig. 6 in Migliari & Fender 2006).
Non-thermal hard tails in the X-ray energy spectra, dominating above keV, have been observed in almost all the known Z sources: GX 5-1 (Asai et al. 1994), GX 17+2 (Di Salvo et al. 2000), Sco X-1 (D’Amico et al. 2001a), GX 349+2 (Di Salvo et al. 2001; see also D’Amico et al. 2001b), Cir X-1 (Iaria et al. 2001) and Cyg X-2 (Di Salvo et al. 2002; see also D’Amico et al. 2001b). These hard X-ray tails can be fitted with a power law with photon index ranging between 1.6 and 3.3, and can contribute up to 10% of the bolometric X-ray luminosity. Although the details of the individual Z sources are more complicated, we might say that, as a general trend, the hard X-ray tail in the spectrum seems to be related to the position in the CD: the hard X-ray component is strongest in the HB and becomes weaker towards the FB. In previous RXTE observations of GX 17+2, for example, the spectrum showed a hard power-law tail with a photon index of which is strongest in the HB and weakens as the source moves towards the NB, disappearing in the NB (Di Salvo et al. 2000). However, a clear counter example seems to be Sco X-1, where no obvious relation between the hard tail X-ray flux and the position on the CD has been observed (D‘Amico et al. 2001a). The physical origin of this non-thermal component is still an area of controversy. In particular, two main possibilities are under debate, both suggesting that the physical site of the emission is the central core region, close to the compact object: inverse Compton from a non-thermal electron population in a ‘corona’ (e.g. Poutanen & Coppi 1998) or in the base of a jet (see e.g. Markoff, Nowak & Wilms 2005 for a discussion). Another possible explanation, the bulk motion Comptonization (BMC) which was first explored by Titarchuck, Mastichiadis & Kylafis (1996) for BHs, has been proposed also for NS systems (e.g. Titarchuk & Zannias 1998). In the specific case of GX 17+2, for example, Farinelli et al. (2007) suggested that the spectrum derived from the BMC of soft photons by energetic electrons flowing on to the NS, can produce an X-ray hard tail consistent with the observations.
In this work we present a study of simultaneous radio and X-ray observations of the Z source GX 17+2, in order to assess the coupling between X-ray and radio properties throughout its three X-ray states (§ 3.1) and during the transitions between states (§ 3.2). Furthermore, these observations allow us, for the first time, to investigate more quantitatively the possible relations between the radio emission and the presence of the hard X-ray tails (§ 3.3), observed to be associated with the position of the source in the CD.
2 Observations
We have observed the Z-type NS XRB GX 17+2 simultaneously in X-rays with the Rossi X-ray Timing Explorer (RXTE) and in the radio band with the Very Large Array (VLA), covering all its three X-ray branches.
2.1 RXTE observations and data analysis
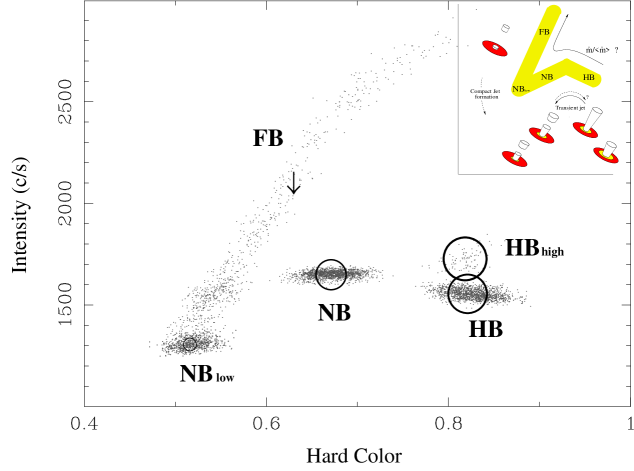
RXTE observed GX 17+2 starting on 2002 November 04, for a total of hr over about 11 days. The 3-20 keV light curve of the observations is shown in Fig. 1, middle panels. We used the Proportional Counter Array (PCA) Standard2 data of the proportional counter unit 2 (working in all the observations) to produce the CD and the HID of all the RXTE observations of GX 17+2. The soft color and the hard color are defined as the count rate ratio (4.6–7.1) keV/(2.9–4.6) keV and (10.5–19.6) keV/(7.1–10.5) keV, respectively. The HID in Fig. 2 clearly shows the three distinct X-ray branches of the source.
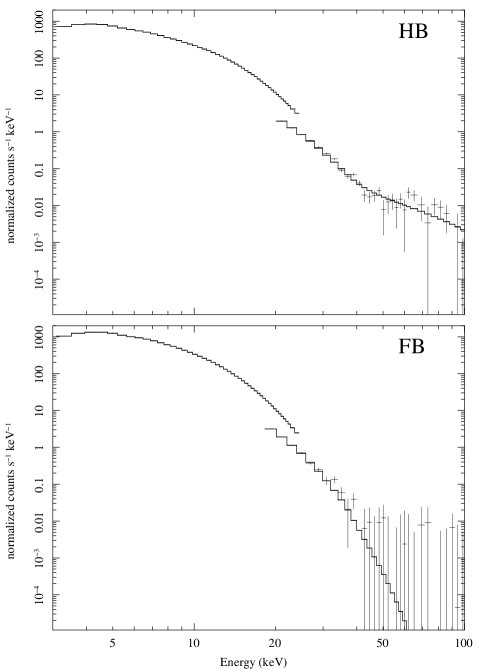
For the spectral analysis, we have extracted X-ray energy spectra using PCA Standard2 and HEXTE Standard Mode data. For the PCA data, we subtracted the background estimated using pcabckest v3.0, produced the detector response matrix with pcarsp v10.1, and analysed the energy spectrum in the range 3–25 keV. A systematic error of 0.5% was added to account for uncertainties in the calibration. For the HEXTE data, we corrected for deadtime, subtracted the background, extracted the response matrix using FTOOLS v.6.1.2, and analysed the spectra between 20 and keV (there is no significant detection above this energy in any of the observations). We show the log of the RXTE observations in Table 1. The 3-100 keV spectra are well fitted (see also Di Salvo et al. 2000) using a black-body, a thermal Comptonization model (CompTT), a Gaussian emission line in the range 6.4–6.7 keV and an edge around 9 keV. An additional power law to account for an excess, of non-thermal origin, in the higher energy range above 30 keV is also necessary in three observations (see § 3.3 for a discussion). For a detailed X-ray spectral analysis of GX 17+2 with other models see e.g. Farinelli et al. (2005). The best-fit parameters of each of the 3-100 keV spectra as a function of their position on the HID are shown in Table 2. The values are consistent with what was found in Di Salvo et al. (2000).
For the temporal analysis, we have used event and binned data with a time resolution of 125 s for the production of the power density spectra. We used time bins such that the Nyquist frequency is 4096 Hz. For each observation we created power spectra from segments of 64s length using Fast Fourier Transform techniques (van der Klis 1989 and references therein), but no background subtraction was performed. No deadtime corrections were done before creating the power spectra. We averaged the Leahy-normalised power spectra (Leahy et al. 1983) and subtracted the predicted Poisson noise spectrum applying the method of Zhang et al. (1995), shifted in power to match the spectrum between 3000 and 4000 Hz. We converted the normalisation of the power spectra to squared fractional rms (e.g. Belloni & Hasinger 1990; see van der Klis 1995).
2.2 VLA observations and data analysis
We observed GX 17+2 with the VLA at three different epochs on 2002 November 4, 9, and 15, simultaneous with the RXTE observations. The VLA was in its C configuration at the time. The NRAO project ID was AR 495. Observing frequencies were 1.425, 4.86, 8.46, 14.94, 22.46 and 43.34 GHz. Observations were carried out in standard continuum mode at each frequency, with a 50-MHz bandwidth in each of two IF pairs. The primary calibrator was 3C 286, used to set the flux scale according to the coefficients derived at the VLA in 1999 as implemented in the 31Dec05 version of the National Radio Astronomy Observatory’s (NRAO) Astronomical Image Processing System (AIPS). The secondary calibrators were J1834–126 ( from the target) at 1.46 GHz and J1832–105 ( from the target) at all higher frequencies. Data calibration and imaging were performed using standard procedures within AIPS. At frequencies below 15 GHz, there were background sources present in the field, most notably an AGN 88 arcmin to the southwest, which had to be properly deconvolved from the image. The data were subjected to a single round of phase-only self-calibration before making separate images of the field in the time intervals corresponding to the different X-ray states. To obtain the time-resolved lightcurve of GX 17+2, the other sources in the field were subtracted from the uv-data before measuring the source flux density using the aips task uvplt.
3 Results and discussion
3.1 Radio emission correlated with the position in the HID
In Fig. 1 we show the 5 GHz and 8.5 GHz VLA (top), 3-20 keV RXTE/PCA (middle) and hard X-ray color (bottom) light curves of GX 17+2. The simultaneous X-ray and radio light curves show no obvious correlations between the X-ray count rate and the radio flux densities. However, during the radio observations, we note an overall correlation between the mean radio flux density and the mean hard color (top and bottom panels): the higher the mean radio flux density, the higher the hard color. More specifically, the radio emission is strongly related to the position in the HID. In Fig. 2, we show the HID of GX 17+2: the gray dots are the PCA observations with a time resolution of 16 seconds and the superimposed open circles indicate the radio emission strength: the bigger the circle, the more radio flux density. We clearly see that the radio flux density is strictly related to the position in the HID, in a way consistent with previous observations (Penninx et al. 1988) and with the disc-jet coupling scenario described in Migliari & Fender (2006): the radio flux density increases from the FB to the NB and is highest in the HB. We also note an enhancement of radio flux density in the HB (i.e. what we called HBhigh), corresponding to an increase in intensity of the source, with no significant change in hard color.
The overall radio emission is consistent with being optically thick exept possibly for the observations during the HBhigh, which correspond to what seems to be the decay of an optically thin radio flare (with , measured by fitting the flux densities at 1.4, 5, 8.5 and 15 GHz, of the averaged observations for the range of times sec from the beginning of our observations; see Fig. 1, top-left panel). The radio decay in the top-left panel of Fig. 1, might be associated with the (preceding) X-ray count rate decay shown in the middle-left panel. In this case, a possible scenario would be that of a radio flare associated with the NB-to-HB transition (not observed), of which we only see the decaying part. However, the X-ray count rate decay can also be the decay of a long type-I X-ray burst of the same kind observed for this source in previous RXTE observations (see e.g. the long ‘burst 6’ reported in Kuulkers et al. 2002). Indeed, the X-ray decay shown in the PCA light curve seems to be exponential, supporting the interpretation as a type-I burst. We tried to investigate this possibility by fitting the 2-25 keV PCA energy spectrum of the X-ray decay (the first 1700 seconds of the observation 70023-01-01-01) with the model described in § 2.1, without the power-law component, plus an extra blackbody component to account for the possible thermal emission from the surface of the NS, but the additional blackbody does not give a significant statistical improvement to the fit. The radio/X-ray flux decay simultaneity would be, in the case of a type-I burst, only accidental.
3.2 A radio jet switches-on the FB-to-NB state transition
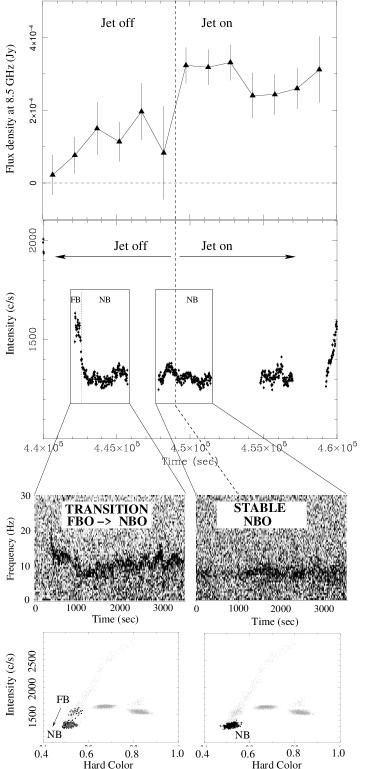
The HID in Fig. 2 shows that during the FB, no radio emission is detected, while emission, although weak, is observed in the lower NB. Our observations cover the exact time in which the source transits from the FB to the lower NB (panels of the middle-column in Fig. 1). In Fig. 3, we show the radio and X-ray light curves of GX 17+2 during the transition from FB to NB. The first panel from the top shows the radio light curve at 8.5 GHz (re-binned to a higher temporal resolution with respect to that in Fig. 1). The second panel shows the X-ray PCA light curve. In the first part of the observation, i.e. before sec the source is not significantly detected (with a nominal flux density of mJy). However, after sec the radio source is detected at 8.5 GHz at a significance level of and at 5 GHz at a significance level of . The radio power-law spectral index is ). Physically, we interpret this as a compact jet that switches-on soon after the FB-to-NB transition. (Note that, since the radio spectral index is not well constrained, an optically thin radio flare cannot be ruled out.) A sketch of the (phenomenological) jet/X-ray state coupling model for Z sources adapted from Migliari & Fender (2006) to include this result is shown in the top-right panel of Fig. 2. For clarity, the drawings of the jet in the top-right panel refer only to the cycle from HB to FB. Indeed, if a compact jet is reformed during the FB-to-NB transition, optically thin shocks and transient jets may not be present in the NB.
In Fig. 3, the third panels from the top show the dynamical power density spectra of the two orbits (in black are evident the changes in the characteristic frequency of the QPOs), and the bottom panels show the positions of the observations on the HID as black markers. The lower FB is usually characterized by the presence of the so-called flaring branch oscillation (FBO), which has a typical characteristic frequency above 14 Hz, while the NB power density spectra usually show the so-called normal branch oscillation (NBO), which has a typical characteristic frequency below 10 Hz (see Homan et al. 2002). The first RXTE/PCA orbit shows the actual X-ray state transition from the FB to the lower NB: the black markers in the HID are spread in between the FB and the NB, and the dynamical power density spectrum shows a transition between the FBO and the NBO, with the QPO frequency oscillating between the typical frequencies of the two QPOs; the fit of the averaged power density spectrum gives a characteristic frequency of (the same kind of ‘intermediate’ QPO has been already observed in previous observations of GX 17+2: Homan et al. 2002). The QPO stabilizes into a NBO only in the second orbit with a characteristic frequency of Hz. This stable NBO is simultaneous with a clear renewed radio activity of the source. As the QPO frequency stabilizes into a NBO, the compact jet appears to re-establish itself. The parallel between the stability of the NBO and the radio emission, and since in Z-sources the NBO, as well as the radio emission, has been observed in all the X-ray states with the exeption of the FB, suggests a relation between the formation of the jet and the X-ray variability associated to the NBO. In an attempt to draw analogies between the fast X-ray variability observed in Z sources and in BH XRBs, Casella, Belloni & Stella (2005) studied the properties of the low-frequency QPOs in the two types of systems, and related the FBO to the so-called ‘type-A’ QPO, the NBO to the ‘type-B’ QPO and the HBO to the ‘type-C’ QPO. In this framework, the jet formation in BHs might be related to the type-B QPO, and/or to the transition between the type-A to the type-B QPO. An association between the presence of QPOs and radio jet activity, similar to what we see in GX 17+2, can be found in some BH XRBs, albeit with a much slower time-scale. A clear example comes from the multiwavelength studies of the decay of the outburst in H1743-322 (Kalemci et al. 2006). The power density spectrum of the source shows a low-frequency QPO that appears during the transition from the thermal/soft state, where the radio jet is undetected, to the hard X-ray state (see also e.g. Homan & Belloni 2005). While the source is in an intermediate state and entering the hard state, the characteristic frequency of the QPO decreases in time (possibly also changing ‘type’; in their work Kalemci et al. did not classify the QPOs by ‘type’) and, when the source is in its hard state, the radio jet renews its activity.
In the bright atoll source GX 13+1, Homan et al. (2004) observed a delay of approximately 40 minutes between the changes in the X-ray spectral hardness and the following radio flares. In GX 17+2, we observe renewed radio activity around sec (Fig. 3, top). If we associate this radio flux increase with the preceding FB-to-NB transition, the delay is hr. This time-delay is about three times that found in GX 13+1 and about twice the delays observed in the highly-accreting BH XRB GRS 1915+105 between the beginning of the X-ray hard dips and the following radio flares (see Klein-Wolt et al. 2002), i.e. taking the hard X-ray dips’ duration as the time that it takes the compact jet to re-form. If, on the other hand, the radio activity is associated with the stability of the characteristic frequency of the NBO, we obtain an upper limit on the X-ray/radio activity delay of s, consistent with what has been observed in the NS GX 13+1 and the BH GRS 1915+105. For comparison, more ‘traditional’ BHs like H1743-322 or 4U 1543-47 (Kalemci et al. 2005, 2006), during the decay of the outburst show a time delay between the end of the thermal/soft state and the detection of the radio jet of at least a few days.
3.3 Radio emission and hard X-ray tails
We have analysed the 3-100 keV energy spectra of five observations along the HID. In Table 2 we show the best-fit parameters of the X-ray energy spectra using the model described in § 2.1. A hard X-ray tail is present in the HBhigh and HB (an F-test for the addition of a power-law component gives a chance improvement probability of in HBhigh and in HB; Fig. 4, top panel), and the 2–100 keV flux in the power-law component is approximately 15% and 10%, respectively, of the total 2-100 keV flux of the source. In the NB an extra power-law component is also needed in the fit of the energy spectrum (an F-test gives chance probability), but the power-law flux decreases to approximately 1% of the total 2-100 keV flux. No additional component is needed to the spectral fits when the source is in NBlow and in the FB (Fig. 4, lower panel). Therefore, we confirm that in GX 17+2 there is a clear correspondence between the presence of a hard tail in the X-ray spectra and the position on the HID.
The behaviour of the hard X-ray tail in GX 17+2 as a function of the position in the HID is qualitatively the same as that observed for the radio emission, suggesting a common physical driver for the production of the radio and hard X-ray tail emission. In order to quantify this qualitative radio emission/hard tail correspondence, in Fig. 5 we plot the mean radio flux density at 8.5 GHz against the 2-100 keV flux of the hard tail power-law component for the observations in FB, NBlow, NB, HB, HBhigh. The three observations for which the presence of the X-ray power law and the radio emission is significantly detected show a positive correlation between the two quantities (with a correlation coefficient of 99%): the radio flux density increases as the power-law X-ray flux increases. The upper limits on the other two observations are consistent with this trend. However, given the present statistics, the correlation cannot be firmly constrained and other observations are needed in order to confirm and properly quantify the radio/hard X-ray dependence.
In BH systems, it has been suggested that the Comptonising corona gets ejected during a radio flare (e.g. Vadawale et al. 2003; Fender, Belloni & Gallo 2004); hence the transition of the source into the soft state. In the NS system GX 17+2, we appear to see a correlation between the hard X-ray tail and the radio emission, with a strong hard X-ray tail also present during a radio flare. However, although during the HBhigh observation what we see is likely the decay portion of a radio flare, thus associated with a preceding ‘transient’ ejection, the radio spectra of GX 17+2 during the other X-ray states are consistent with the emission from a ‘compact’ jet. The compact jet, which can be present also during the HBhigh, is what appears to be associated with the hard X-ray tail. Similarly, in BH systems the radio compact jet is observed in the quiescent/hard state, when also a hard Comptonizing ‘corona’ is present.
4 Conclusions
We have analysed simultaneous radio (VLA) and X-ray (RXTE)
observations covering all the three X-ray branches of the Z-type NS
XRB GX 17+2 and found:
-
•
A relation between the radio emission and the position in the HID: the radio flux density is strongest in the HB, decreases in the NB, and is weakest in the FB (Fig. 2).
-
•
A relation between the presence of a hard X-ray tail and the position on the HID: the hard power-law tail is observed in the HB, in the NB, and is not detected in the lower NB and in the FB (Fig. 4 and Table 2).
-
•
A link between X-ray state transitions and the jet activity: a jet, likely a compact jet, forms soon after the FB-to-NB transition, with a time delay of less than 2 hr (Fig. 3).
-
•
The radio emission of the jet (re-)formed after the FB-to-NB state transition stabilizes when the NBO characteristic frequency in the X-ray power spectrum also stabilizes (Fig. 3). This finding, together with the fact that in Z-sources the NBO, as well as the radio emission, has been observed in all the X-ray states with the exception of the FB, suggest a relation between the formation of the jet and the X-ray variability associated to the NBO. A similar behaviour, albeit with a longer time-scale, may be found in BH systems, where the decrease of the characteristic frequency and change of ‘type’ of the low-frequency QPO is followed by a renewed activity of the jet (see § 3.2).
-
•
An indication for a quantitative relation between radio emission and the hard tail in the X-ray spectrum: there is a positive correlation between the hard tail power-law X-ray flux and the radio flux density (Fig. 5). If further confirmed with a larger sample and improved statistics, especially in the hard X-ray tail flux measurement, this relation would point to a common mechanism for the production of the jet and the hard X-ray tails in the system.
References
- (1) Asai, K., Dotani, T., Mitsuda, K., Nagase, F., Kamado, Y., Kuulkers, E., Breedon, L.M., 1994, PASJ, 46, 479
- (2) Belloni, T., Hasinger, G., 1990, A&A, 227, L33
- (3) Belloni T., Psaltis D., van der Klis M., 2002, ApJ, 572, 392
- (4) Casella P., Belloni T., Stella L., 2005, ApJ, 629, 403
- (5) D’Amico, F., Heindl, W. A., Rothschild, R. E., Gruber, D. E., 2001a, ApJ, 547, L147
- (6) D’Amico, F., Heindl, W. A., Rothschild, R. E., Gruber, D. E., 2001b, AIP Conference Proceedings, 587, 44
- (7) Di Salvo, T., Farinelli, R., Burderi, L., Frontera, F., Kuulkers, E., Masetti, N., Robba, N. R., Stella, L., van der Klis, M., 2002, A&A, 386, 535
- (8) Di Salvo, T., Robba, N. R., Iaria, R., Stella, L., Burderi, L., Israel, G. L., 2001, ApJ, 554, 49
- (9) Di Salvo, T., Stella, L., Robba, N. R., van der Klis, M., Burderi, L., Israel, G. L., Homan, J., Campana, S., Frontera, F., Parmar, A. N., 2000, ApJ, 544, L119
- (10) Di Salvo, T. et al., 2006, ApJ, 649, L91
- (11) Fender, R.P., 2006, Compact Stellar X-Ray Sources, eds. W.H.G. Lewin and M. van der Klis, Cambridge University Press: astro-ph/0303339
- (12) Farinelli R., Titarchuk L. Frontera F., 2007, ApJ, 662, 1167
- (13) Farinelli, R., Frontera, F., Zdziarski, A. A., Stella, L., Zhang, S. N., van der Klis, M., Masetti, N., Amati, L., 2005, A&A, 434, 25
- (14) Fender, R.P. et al., 1999, MNRAS, 519, L165
- (15) Fender R.P., Belloni T., 2004, ARA&A, 42, 317
- (16) Fender R.P., Belloni T., Gallo E., 2004, MNRAS, 355, 1105
- (17) Fender R.P. et al., 2004, Nature, 427, 222
- (18) Fomalont E.B., Geldzahler B.J., Bradshaw C.F., 2001a, ApJ, 558, 283
- (19) Fomalont E.B., Geldzahler B.J., Bradshaw C.F., 2001b, ApJ, 553, L27
- (20) Hasinger, G., van der Klis M., 1989, A&A, 225, 79
- (21) Hjellming R.M. et al., 1990a, A&A, 235, 147
- (22) Hjellming R.M. et al., 1990b, ApJ, 365, 681
- (23) Homan, J., van der Klis, M., Jonker, P. G., Wijnands, R., Kuulkers, E., Méndez, M., Lewin, W.H. G., 2002, ApJ, 568,878
- (24) Homan J., Belloni T., 2005, Ap&SS, 300, 107
- (25) Iaria, R., Burderi, L., Di Salvo, T., La Barbera, A., Robba, N. R., 2001, ApJ, 547, 412
- (26) Kuulkers, E., Homan, J., van der Klis, M., Lewin, W. H. G., Méndez, M., 2002, A&A, 382, 947
- (27) Kalemci E., et al., 2005, ApJ, 622, 508
- (28) Kalemci E., Tomsick J.A., Rothschild R.E., K. Pottschmidt, Corbel S., Kaaret P., 2006, ApJ, 639, 340
- (29) Leahy, D.A., Darbro, W., Elsner, R.F., Weisskopf, M.C., Kahn, S., Sutherland, P.G., Grindlay, J.E., 1983, ApJ, 266, 160
- (30) McClintock, J.E., & Remillard, R.A., 2006, Compact Stellar X-Ray Sources, eds. W.H.G. Lewin and M. van der Klis, Cambridge University Press: astro-ph/0306213
- (31) Markoff, S., Nowak, M.A., Wilms, J., 2005, ApJ, 635, 1203
- (32) Migliari, S., Fender R.P., 2006, MNRAS, 366, 79
- (33) Migliari, S., Tomsick, J. A., Maccarone, T. J., Gallo, E., Fender, R. P., Nelemans, G., Russell, D. M, 2006, ApJ, 643, L41
- (34) Penninx W. et al. 1988, Nature, 336, 146
- (35) Poutanen, J., Coppi, P., 1998, Physica Scripta, T77, 57, Proceedings of the Nordic Symposium ”Exploiting Spectrum-X-Gamma and INTEGRAL”, Edited by N.J. Westergaard, O. Vilhu, and R. Svensson.
- (36) Shirey R.E., Bradt H.V., Levine A.M., 1999, ApJ, 517, 472
- (37) Tan J., Lewin W.H.G., Hjellming R.M., Penninx W., van Paradijs J., van der Klis M., Mitsuda, K., 1992, ApJ, 385, 314
- (38) Titarchuck L., Mastichiadis A., Kylafis M.D., 1996, A&AS, 120, 171
- (39) Titarchuck L., Zannias T., 1998, ApJ, 493, 863
- (40) Vadawale, S. V., Rao, A. R., Naik, S., Yadav, J. S., Ishwara-Chandra, C. H., Pramesh Rao, A., Pooley, G. G., 2003, ApJ, 597, 1023
- (41) van der Klis M., 1989, ARA&A, 27, 517
- (42) van der Klis M., 1995, Proceeding of the NATO Advanced Study Institute on the Lives of Neutron Stars, eds. Alpar M.A., Kiziloglu U., van Paradijs J., Publisher, Kluwer Academic.
- (43) van der Klis M., 2006, Compact Stellar X-Ray Sources, eds. W.H.G. Lewin and M. van der Klis, Cambridge University Press: astro-ph/0410551
- (44) Zhang W., Jahoda K., Swank J.H., Morgan E.H., Giles A.B., 1995, ApJ, 449, 930
| Obs ID | Start time | End time | X-ray states |
|---|---|---|---|
| 70023-01-01-01 | 2002-11-04UT18:19:28 | 2002-11-04UT22:03:28 | HBhigh/HB |
| 70023-01-01-03 | 2002-11-04UT22:37:36 | 2002-11-04UT23:37:20 | HB |
| 70023-01-01-00 | 2002-11-05UT00:28:32 | 2002-11-05UT06:02:08 | HB |
| 70023-01-02-00 | 2002-11-09UT18:11:44 | 2002-11-09UT23:46:40 | FB/NBlow |
| 70023-01-02-01 | 2002-11-10UT00:40:00 | 2002-11-10UT06:07:12 | FB/NBlow |
| 70023-01-03-00 | 2002-11-15UT18:02:40 | 2002-11-15UT21:44:32 | NB |
| 70023-01-03-01 | 2002-11-15UT22:40:00 | 2002-11-16UT05:57:20 | NB |
| Parameter | HBhigh | HB | NB | NBlow | FB |
|---|---|---|---|---|---|
| NH ( cm-2) | 2 (fixed) | 2 (fixed) | 2 (fixed) | 2 (fixed) | 2 (fixed) |
| kTBB (keV) | |||||
| NBB | |||||
| kTW | |||||
| kTe | |||||
| NComp | |||||
| EFe | |||||
| EqWFe | |||||
| NFe | |||||
| Eedge | |||||
| Max | |||||
| NPL | |||||
| FluxPL | |||||
| (d.o.f.) | 1.17 (95) | 1.22 (95) | 1.33 (95) | 0.97 (99) | 0.86 (99) |
| F-test (+PL) |