Search for the Rare Decay
Abstract
The KTeV E799 experiment has conducted a search for the rare
decay via the topology
(where
).
Due to Bose statistics of the pair and the real nature of
the photon, the decay is restricted to
proceed at lowest order by the CP conserving direct emission (DE) of an E2
electric quadrupole photon. The rate of this decay is interesting theoretically since chiral
perturbation theory predicts that this process vanishes at level .
Therefore, this mode probes chiral perturbation theory at .
In this paper we report a determination of an upper limit of
(90% CL) for .
This is approximately a factor of 20 lower than previous results.
PACS numbers: 13.20.Eb, 13.25.Es
I I. INTRODUCTION
While measurements of branching ratios for kaon decay modes such as have shown good agreement ref:0.5 with chiral perturbation theory (ChPT) calculations to order , ChPT calculation to order have been difficult to check due to the presence of the large lower order terms. Since the mode is forbidden to order in ChPT ref:0 , this mode presents an opportunity to check ChPT at higher orders. Therefore an experimental measurement of this mode’s branching ratio is of interest. At present, a chiral dimensional analysis ref:0.75 for the mode results in a branching ratio of . Because of the Bose statistics of the pair and the presence of a real direct emission , the decay proceeds at lowest order via the CP conserving direct emission of a electric quadrupole (E2) photon. This causes a large suppression of this mode relative to the associated mode. Accordingly, observation of would give a measurement of E2 quadrupole emission which is difficult to extract from the E1 and M1 dominated mode. The M1 amplitude determined from decay together with a plausible estimate for the E2 amplitude ref:1 , given by
can be used to obtain an estimate of the branching ratio for . Here and are the momenta of the pions and k and are the momentum and polarization of the photon respectively. is the coupling of the E2 amplitude. , a mass parameter that measures the extent of the region over which the interaction takes place, is assumed to be of order of the meson mass. The CP violating direct emission of a M2 magnetic quadrupole photon is much smaller than the E2 transition and can be ignored. According to Ref. ref:1 , the decay rate for can be estimated by comparing it to the M1 direct emission (DE) amplitude of the decay
| (1) |
Employing this amplitude, the ratio
| (2) |
can be formed. Using the fraction of to due to M1 direct emission of from Ref. ref:2 and a branching ratio of from the PDG ref:3 , a branching ratio for M1 DE part of the decay of (MeV) is obtained. Using Eq. 3 above, this gives an estimated branching ratio of for (under the assumption that has similar magnitude to ).
The KTeV collaboration previously reported an upper limit of of (90% CL) ref:4 for the related decay in which the direct emission E2 photon was virtual. However, we point out that this decay, in contrast to the decay where the photon is real, can proceed via an additional process forbidden for a real photon. The virtual photon is emitted in a J=0 state from the allowing a transition of the to a followed by the CP allowed decay . This is the so-called charge radius amplitude ref:5 . The rates for these two decays would have similar branching ratios except for the the charge radius amplitude.
The previous best upper limit of (90% CL) for the decay obtained by the NA31 experiment ref:7 was achieved by searching for this mode in events with five photons in the final state. Due to the particular configuration of triggers and prescale factors in the KTeV experiment, the most sensitive method was to require that one of the neutral pions undergo Dalitz decay .
II II. The KTeV E799 Experiment
The search for the mode was performed using the 1997 and 1999 runs of KTeV E799 II at Fermi National Accelerator Laboratory. The KTeV E799 experiment used two almost parallel beam lines generated by interactions of 800 GeV/c protons in a BeO target some 90 meters upstream of the KTeV spectrometer. The KTeV spectrometer consisted of a 70 meter evacuated decay tube followed by, in sequence, two stations of drift chambers, a large aperture dipole magnet, two more stations of drift chambers, a multi-plane transition radiation detector, a 3100 element CsI electromagnetic calorimeter and a muon detector.
The 1997 and 1999 runs differed in the following ways. The spill length was doubled from 20 in the 1997 run to 40 seconds in the 1999 run. The proton intensity on the BeO neutral kaon production target was increased from in the 1997 run to per spill in the 1999 run. Another important difference between the 1997 and 1999 run was that the magnetic field was decreased from a transverse deflection of 205 MeV/c in 1997 to 150 MeV/c in 1999 to increase acceptance for some of the neutral kaon modes. The trigger which demanded two charged tracks and at least four electromagnetic clusters was loosened midway during the 1997 run by changing the minimum thresholds for energy in the electromagnetic calorimeter and remained loose for the 1999 run.
II.1 II A. The Signal Criteria
The final state consists of four photons plus an pair. The KTeV analysis required six electromagnetic showers ( 0.6 GeV) in the CsI calorimeter, two of which were associated with two reconstructed charged tracks. The two charged tracks were required to be consistent with the two track trigger, form a good charged track vertex, have opposite charge, and have (where is the energy of the associated shower in the CsI calorimeter and is the momentum determined from magnetic bending).
Events passing these cuts were required to satisfy several additional cuts to select and to reject the major background due to decays. These events can contribute to the background if one of the photons was not detected or two of the photons reconstructed as single photon. Additional cuts were performed including a vertex cut determined by cycling over all and combinations in a given event for all possible vertex positions to determine the vertex where the and were closest to the mass. The vertex thus obtained was required to be between 95 and 150 meters from the BeO target in the KTeV decay volume and to have a good vertex . Another cut was made on the variable ( defined as the longitudinal momentum squared of the in the frame in which the momentum of the pair is totally transverse. If the event is a decay, ( is greater than zero. If the event is a decay, ( is less than zero (modulo resolution). Accordingly ( was required GeV2/c2 in order to select decays and reject .
The analysis cuts were varied slightly between the 1997 and 1999 run. The main changes were to alter the shape of the and signal region and to tighten the decay vertex position and the overlapping shower cuts to reject more background.
II.2 II B. Backgrounds
Monte Carlos were developed for the signal mode incorporating the model of Ref. ref:1 as well as for the various backgrounds, and the normalization mode incorporating all known features of the E799 spectrometer and beam. The various modes were generated using experimentally determined decay parameters. Trigger and analysis cuts applied to the Monte Carlos were the same as those applied to the data. Background and normalization mode Monte Carlos were generated to produce Monte Carlo samples several times the 1997 and 1999 run fluxes.
As indicated in Fig. 1, a comparisons of a and a background Monte Carlo with the 1997 data shows that the angle between the direct emission photon and one of the two ’s in the center of mass is peaked for the signal mode at cos and flat for . The same is true for the 1999 data.
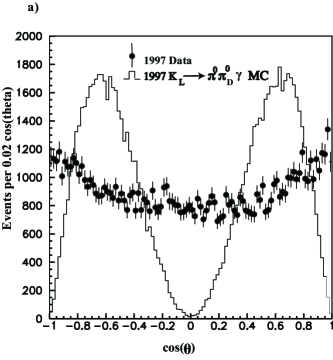
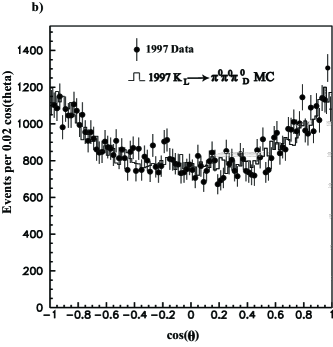
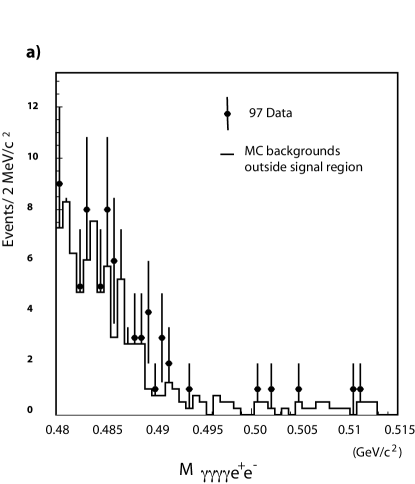
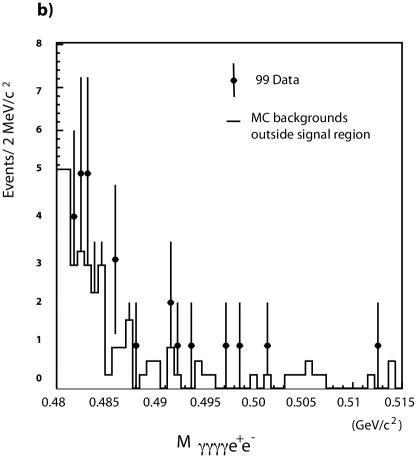
Therefore a final cut to select was made requiring events to have cos to improve signal to background. Several other decays were investigated to see if there was any contribution to background after the cuts to select . These modes included where a Dalitz pair is undetected, followed by the decay of a into an pair, followed by the decay of a into with one of the pairs undetected, decays with accidental photons, and plus accidental photons. In no case did any of these modes contribute significantly to the background. The agreement of the Monte Carlo simulation of the remaining background with the 1997 and 1999 data outside the signal region is shown in Fig. 2.
III III. Search for a Signal
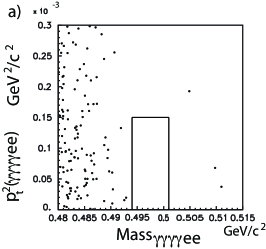
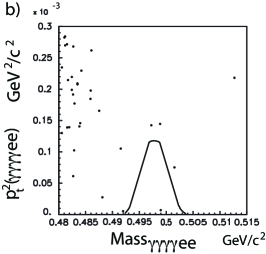
The signal regions for the 1997 and 1999 data were based on the and resolutions calculated using a signal mode Monte Carlo. Here is measured relative to the direction of the determined by the line connecting the BeO target center and the decay vertex. For the 1997 data, the signal region was chosen to be rectangular with 0.494 GeV/c M 0.501 GeV/c2 and 0.00015 (GeV/c)2. In the later analysis of the 1999 data, it was decided to use a contour containing 68% of the signal Monte Carlo events as determined from a joint probability distribution based on the signal Monte Carlo resolutions for and . Since the signal box had already been opened for the 1997 data (and no events were observed as discussed below), the rectangular signal region was kept for the 97 data.
As shown in Fig. 3a, no events were observed in the 1997 data in this region when the box was opened after the blind analysis was completed. From the background Monte Carlo, we expected background events in the 1997 run. As shown in Fig. 3b, one data event was found in the 1999 signal region while the background Monte Carlo yielded no events in the signal region for four equivalent fluxes. These Monte Carlo background estimates for the 1997 and 1999 runs are consistent with the background estimates based on mass and sideband projection from the data.
IV IV. Determination of the Upper Limit for
Since the branching ratio is well measured and since events where a photon was lost down the beam hole had the same topology as the signal and were copious, these events were used for the normalization for the experiment. The reason for selecting this topology was to minimize the systematics due to trigger and event configuration between the signal and normalization modes.
The criteria to select these normalization mode events included the same topology criteria, the vertex position cut, and the mass cuts as the signal mode. Cuts that were special to the selection of the normalization mode included a requirement that . In addition, to insure that the event was consistent with a decay with a photon going down the beam hole, the missing photon was reconstructed by assuming a kaon mass and net zero for the event. This resulted in two solutions for energy and trajectory of the missing photon. If one of the solutions for the missing photon combined with the unpaired photon in the observed event to form a mass within 0.05 GeV/c2, if the other three photons and the in the event paired to form ’s, and if the missing photon’s calculated trajectory pointed to either beam hole, the event was included in the normalization sample. Normalization mode yields of 7725 and 9024 were obtained for the 1997 and 1999 data using these criteria.
IV.1 IV A. The Single Event Sensitivity for Signal
We can avoid the extra error due to the branching ratio uncertainty in the Dalitz decay by noting that the single event sensitivities (SES) are given by
| (3) |
where A are the acceptances for the Dalitz decay mode and N are the fluxes for the 1997 and 1999 modes. The fluxes are
| (4) |
so the SES’s for are given by
| (5) |
where and are the number and the acceptance of normalization mode events in the 97 and 99 runs. The factor of 2 and 3 arise from the number of ’s that can produce a Dalitz pair in the signal and normalization modes. Note that the Dalitz decay branching ratio cancels out in the SES for .
From the and Monte Carlos, the signal and normalization acceptances were determined to be 0.101% and for the 1997 run and 0.085% and for the 1999 runs respectively. Using Eq. 6 and the measured 19.560.12% branching ratio for ref:8.5 , the 1997 and 1999 SES’s were determined to be and respectively. In addition, fluxes of 2.68 and 3.99 were obtained for the 1997 and 1999 runs. The SES’s for 97/99 were combined using
| (6) |
resulting in a combined of .
IV.2 IV B. Systematic Errors
Systematic errors for the upper limit could arise from several sources. Among them was the error in the branching ratio for . There were also disagreements between the distributions of the normalization mode data and Monte Carlo. The effect of these disagreements on the SES were studied by adjusting the Monte Carlos to eliminate the disagreements and seeing what changes in the SES took place. There could also be disagreements between the data and its Monte Carlo. A disagreement in signal mode data and Monte Carlo could not be checked directly since no signal is observed. However, from an inspection of the calculation of the SES, it can be seen that the SES is proportional to . So, to the level that the normalization and signal mode topologies are similar, it was expected that differences in acceptance between the Monte Carlo and the data would tend to cancel. Studies were done of the effect of disagreements between the signal mode and normalization mode Monte Carlos by adjusting the Monte Carlos until they agreed and determining the effect on the result.
| Error on the 3 branching ratio | 0.61% |
|---|---|
| Error on the branching ratio | 3.24% |
| Normalization Monte Carlo/data disagreements | 3.57% |
| Signal/normalization Monte Carlo disagreements | 5.35% |
| Total Systematic Error | 7.23% |
The percentage systematic errors in the SES due to these sources are shown in Table 1. Adding these systematic errors in Table I in quadrature, we obtain a total systematic error in the SES of 7.23%. Taking into account the statistical error of 1.09%, this leads to a total error of 7.31% resulting in a SES error of .
IV.3 IV C. Calculation of the Upper Limit for Signal
The method of Ref. ref:10 was used to obtain an upper limit for . If is the expected number of signal plus background events in the signal box and is the expected number of background events, then the probability for observing events is given by a Poisson distribution whose mean is
| (7) |
The expected and observed backgrounds for the 97 and 99 runs were added to form the final observed and expected backgrounds. A confidence region was constructed containing 90% of the Poisson distribution by varying the branching ratio between 0 to . Using this confidence region, a 90% CL upper limit for the BR() of was determined, assuming the E2 model of Ref. ref:1 . The SES error was incorporated by varying the SES over the 90% CL range of the SES indicated by its combined statistical and systematic error.
V V. Conclusions
In conclusion, the KTeV collaboration has obtained an upper limit for the branching ratio for the rare decay of using the 1997 and 1999 data and assuming that the decay proceeds mainly via direct E2 photon emission. This limit is approximately twenty times lower than the best published upper limit ref:7 , providing a much more stringent upper limit for ChPT theoretical calculations of the E2 amplitude.
VI VI. Acknowledgments
We thank the FNAL staff for their contributions. This work was supported by the U.S. Department of Energy, the U.S. National Science Foundation, the Ministry of Education and Science of Japan, the Fundao de Amparo a Pesquisa do Estado de So Paulo-FAPESP, the Conselho Nacional de Desenvolvimento Cientifico e Tecnologico-CNPq, and the CAPES-Ministerio da Educao.
† Correspondence should be addressed to David Smith at
poldybloom@yahoo.com
∗ Deceased
∗∗ Permanent address C.P.P. Marseille/C.N.R.S., France
References
- (1) G.D Barr et al., Phys. Lett. B351,597(1995).
- (2) R. Funck and J. Kambor, Nucl. Phys. B396, 53(1993).
- (3) G. Ecker, H. Neufeld, and A. Pich, CERN-TH.6920/93.
- (4) P. Heiliger and L.M. Sehgal, Phys. Letters B307, 182(1993).
- (5) A. Alavi-Harati et al., Phys. Rev.Lett. 86, 761(2001).
- (6) S. Eidelman et al.,Phys. Lett. B592, 629(2004).
- (7) A. Alavi-Harati et al., Phys. Rev. Lett. 89, 211801(2002).
- (8) P. Heiliger and L.M. Sehgal, Phys. Rev. D48, 4146(1993); L.M. Sehgal and M. Wanninger, Phys. Rev. D46, 1035(1992); ibid. D46, 5209(E)(1992).
- (9) G.D Barr et al., Phys. Lett. B328, 528(1994).
- (10) W.M. Yao et al., Journal of Physics G33 672(2006)and 2007 partial update for edition 2008.
- (11) G.J. Feldman and R.D. Cousins, Phys. Rev. D57, 3873(1998).