The mid–infrared emission of Seyfert galaxies. A new analysis of ISOCAM data111Based on observations with ISO, an ESA project with instruments funded by ESA Member States (especially the PI countries: France, Germany, the Netherlands and the United Kingdom) and with the participation of ISAS and NASA.
Abstract
We present mid–infrared data of a sample of 57 AGNs obtained with the instrument ISOCAM on board the satellite ISO. The images were obtained through the LW2 (6.75 µm) and LW7 (9.62 µm) filters. This is a new analysis of Clavel et al. (2000) galaxy sample, which is divided into 26 type 1 ( 1.5) and 28 type 2 ( 1.5) Seyfert galaxies, plus three QSOs. The spatial resolution of the images allow us to separate the nuclear and the extended contributions to the total emission after decomposing the brightness profiles into different morphological components. The most common components are a central point source (identified as the active nucleus) and an exponential disk. In some cases a bulge, a bar or a ring are needed. The relative contribution of the nucleus to the total emission appears larger in Seyfert 1 than in Seyfert 2. This result confirms that both types of Seyfert galaxies are different in the mid-infrared wavelength range and supports the existence of an structure which produces anisotropic emission in this wavelength range. We have also explored correlations between the mid-infrared and the radio and X–ray wavelength ranges. The well established radio/infrared correlation is mantained in our sample for the global emission of the galaxies. If only the nuclear infrared emission is considered then a non–linear correlation is apparent in the luminosity–luminosity scatter diagram. The ratio between the intrinsic hard X–ray and the nuclear mid-infrared emission presents large scatter and slightly larger values for type 2 Seyfert galaxies. These results seem to be consistent with the presence of a clumpy dusty torus surrounding the active nucleus.
1 Introduction
Despite the broad variety of type of objects included under the denomination of Active Galactic Nuclei (AGN), it seems to be possible to explain all of them under a common scenario, the so called Unification Models. The most successful models for the unification of Seyfert galaxies predict the existence of a blocking structure surrounding the nucleus (Antonucci, 1993). This structure is likely a dusty torus, whose size and structure is still a matter of debate (Fritz et al., 2006; Hönig et al., 2006). According to this, type 1 and 2 Seyfert galaxies (hereafter Sy1 and Sy2, respectively) are proposed as the same kind of objects but viewed at different angles: Sy1 are observed close to face-on such that we have a direct view of the nucleus and the Broad emission Line Region (BLR), whereas the Sy2 are seen at an inclination such that our view is blocked by the optically thick dusty torus. The dust grains in the torus will absorb the UV photons from the central engine and after reprocessing the radiation will appear as strong emission in the infrared range. In particular, the mid-infrared emission is produced by a mixture of stochastic heating from Polycyclic Aromatic Hydrocarbon (PAHs) and thermal emission from very small dust grains at high temperatures. Active galaxies are significantly stronger radiators in the mid-infrared than non AGN-dominated galaxies (Spinoglio & Malkan, 1989; Rowan-Robinson & Crawford, 1989; Fadda et al., 1998; Pérez García & Rodríguez Espinosa, 2001). Hence, this spectral range seems a natural window in which to study the properties of such a structure.
The mid-infrared spectra of Sy1 and Sy2 galaxies present important differences: whereas Sy1 spectra are characterized by a strong continuum with only weak emission features from PAH bands, most Sy2 display a weak continuum but very strong PAH emission bands (Clavel et al., 2000). Despite the strong dilution by the nuclear continuum in the case of Sy1, both types 1 and 2 share similar PAH luminosities. This molecular emission results unrelated to the nuclear activity, and arises in the interstellar medium of the underlying galactic bulge. The majority of dusty torus models predict different mid–infrared spectra for type 1 and 2 objects. In case of Sy1 the silicate feature at 10 µm is expected in emission, as recently confirmed with instruments on board of the Spitzer satellite (Siebenmorgen et al., 2005). In contrast, for Sy2 this feature is observed in absorption (Clavel et al., 2000; Jaffe et al., 2004).
In this paper, we analyze mid-infrared images of a sample of Seyfert galaxies. The data sample practically coincides with the previosly studied by Clavel et al. (2000), in which the images are complemented by spectra obtained with the instrument ISOPHOT–S (Lemke et al., 1996). Our main goal is to isolate the nuclear emission of the galaxies in the sample, and provide a better estimate of the active component. This new analysis of the data can be used for testing the unification models. In this line we have investigated correlations with photometric data obtained in different spectral ranges, namely radio and hard X–rays.
2 ISOCAM Data
We analyzed the mid-infrared morphology of a sample of AGNs, mostly Seyfert galaxies. These data were taken as part of the ISO Guaranteed Program Seyfert 1 and Seyfert 2 lead by J. Clavel. We have selected this dataset because it was taken in a homogeneous way, with all the exposures obtained in the same mode and keeping the same instrumental configuration (pixel scale and filters). Morphological classification, Seyfert type, spectroscopic redshifts and observational data (exposure and observation time) are reported in Table 1. The sample was originally drawn from the CfA hard X-ray flux limited complete sample (Piccinotti et al., 1982), but lacks the most well known objects (e.g. NGC 4151 or NGC 1068) which were obtained within the frame of other ISO guaranteed time programs. The sample is about equally divided into 26 Sy1 ( 1.5) and 28 Sy2 ( 1.5), plus a starburst galaxy and three QSOs. Taking into account only the Seyfert galaxies, the mean and rms of the redshift distributions are 0.023 0.014 and 0.016 0.011 for Sy1 and Sy2, respectively. The mean values are not significatively different, considering the width of the distributions, clarifying that the results presented in this paper are not a consequence of differences between Sy1 and Sy2 redshift distributions. In addition to this, we have compiled the total H magnitudes for all Seyferts in the sample from The Two Micron All Sky Survey (2MASS), in order to derive their luminosity distributions. The mean log(LTOT[H]) are 44.81 0.39 and 44.72 0.42, indicating that Sy1 and Sy2 luminosity, and consequently, mass distributions are very similar. The images were obtained using ISOCAM, the mid-infrared camera (Cesarsky et al., 1996) on board of the ISO spacecraft (Kessler et al., 1996). The ISOCAM images are formed by an array of 32x32 pixels, with a pixel size of 3 arcsec. The employed filters were LW2 (5-8.5 µm, covering PAHs emission) and LW7 (8.5-10.7 µm, including the silicate band), which provide an effective resolution on the difraction limit of FWHM= and , respectively. Reduced data were retrieved from the ISO data archive222http://www.iso.vilspa.esa.es/ida/.
3 Data Analysis
3.1 Brightness profile decomposition
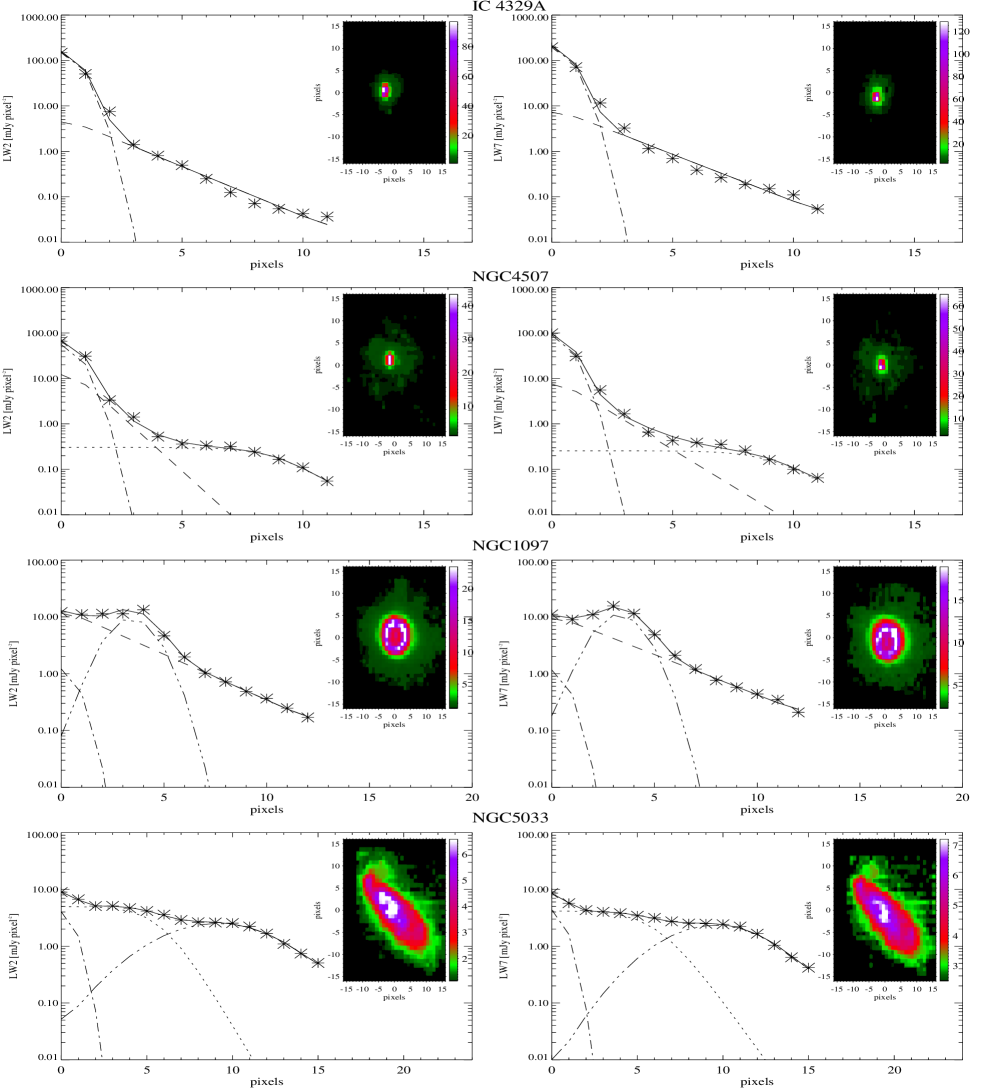
We performed an isophotal analysis of the images in both filters to obtain the surface brightness profiles, by azimuthally averaging over elliptical annuli. We fitted the isocontours of surface brightness with the ELLIPSE task in IRAF333IRAF is distributed by the National Optical Astronomy Observatories, which are operated by the Association of Universities for the Research in Astronomy, Inc., under cooperative agreement with the National science Foundation. http://iraf.noao.edu/, which employes the algorithm described in Jedrzejewski (1987). The spatial interval between two consecutive isophotes chosen was equal to the pixel size in all cases. Given the limited spatial resolution and the relatively small field of view of the camera, the brightness profiles are limited to a maximum of 15 data points, which means a relatively poor sampling of the profile. We subtracted the sky background emission, estimated as the median background value for each image. As a first approach, we assume that the profiles are the sum of two contributions: a nuclear component modeled with a Gaussian PSF of FWHM equals to 2 pixels444Here we assumed that the nominal spatial resolution cannot be achieved due to insufficient sampling of the PSF. The width of the profile for a point source should correspond to the minimum sampling criterium, i.e. 2 pixels or equivalently 6″., and central amplitude as free parameter plus an exponential component with two free parameters (central amplitude and length scale). Using this simple model we were able to reproduce correctly the brightness profiles for about half of the galaxies in our sample. In the rest of cases we could not succesfully reproduce the brightness profiles,and extra components had to be introduced in order to improve the fit. The extra components are a bulge described as a Sersic’s law; a ring described by a Gaussian profile (Buta, 1996):
where I is the amplitude, rring is the center, and lring is the width; or a flat bar profile (Prieto et al., 1997):
where I is the amplitude, rbar is the lenght, and lbar is the downward gradient.
In all cases, the fits were performed with the criterium of minimum number of components and consistency between both filters. Whenever bars or rings were employed in the fitting, we also looked at the ellipticity and orientation of the isophotes searching for abrupt changes coincident with the position of these components. However, the limited resolution of our imaging prevents a fully reliable component identification. In addition to this, we used as a guideline the morphology of the galaxies in the visible (WFPC2/HST) from Malkan et al. (1998) and in the near-infrared (NICMOS/HST) from Hunt & Malkan (2004), although in some cases we fit nuclear bars that do not agree with the optical classification, or rings that reproduce spiral arms, as in the case of NGC 1241. The maximum number of fitted parameters in our fits was seven. The fitting procedure looks for minimization of the Chi-Square function formed by the squared difference between the observed and model profile, both in logarithmic scale. The multidimensional minimization of the merit function is reached using the downhill simplex method. This is the same fitting technique employed in Melo et al. (2002) in the study of NGC 253. In Table 2 we report the fit parameters and their corresponding errors for 54 objects of the sample, in both LW2 and LW7 filters. Errors were estimated using a bootstrapping technique. This technique is based on a Monte Carlo simulation: new brightness profiles are obtained by perturbation of the measured profile, using a normal distribution of the same width as the error of the measured point. New fit parameters are determined for each one of the simulated profiles (30 simulations) and the uncertainty of each parameter is computed as the standard deviation of the resulting values. We calculated the fluxes integrating all the emission contained in each fitted component and in the total fit, for both LW2 and LW7 filters. As an additional check point, we verified that the resultant flux from the total fit was at least % of the total measured flux. All fluxes and its errors are reported in Table 3. We found that bulges are only needed in the case of three galaxies: Mrk 3, MGC6-30-15, and Mrk 841, which are morphologically classified as S0 or elliptical (see Table 1). 27 galaxies were fitted using a PSF plus an exponential component, 14 with PSF plus exponential component plus bar, 4 with exponential component plus bar, 3 with PSF plus exponential component plus ring, 2 with PSF plus bar plus ring, and one with exponential component only. The galaxies NGC 7592 and ESO137-G34 can not be fitted because of their double nucleus, NGC 5929 because of the proximity of its companion (the starburst galaxy NGC 5930), and the QSO HS1700+6416 because of their high =2.736. For these four galaxies without profile decomposition, total fluxes were obtained by means of aperture photometry, using the PHOT task, within the IRAF environment.
We show in Fig. 1 examples of brightness profile decomposition, fitting different morphological components, in both LW2 (left panels) and LW7 (right panels) filters. The origin of X-axis corresponds to the center of fitted isophotes, and distance from this origin is given in pixels, being the pixel size of 3″.
3.2 Comparison with previous studies
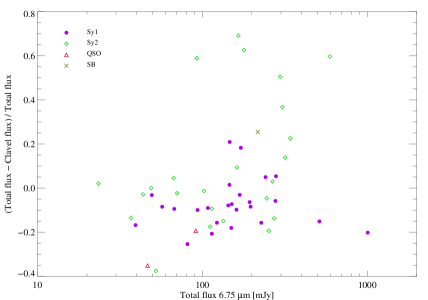
The main interest of our work is focused into a reliable measurement of the nuclear flux, as well as its relative value to the total flux for each galaxy. Once we have obtained the fluxes for each morphological component, reported in Table 3, the first task we accomplished was the comparison of our results with the previous ones obtained from the same data sample and reported by Clavel et al. (2000) (hereafter C00). Here we recall that in C00, nuclear fluxes were obtained by integrating within a circular aperture of 3 pixel radius (9″) for point–like sources, and within an aperture of 4.5 pixels (13.″5) for extended ones. In order to account for the emission in the wings of the PSF they also corrected by a factor 1.23. We note that this photometric correction makes sense for point sources, although their effect is not clear on extended sources like most of our targets are. We present in Fig. 2 the difference between our total values and C00 measurements, normalized to our total fluxes. It can be seen that for most of the galaxies, our total fluxes are underestimated about 10% compared with C00 ones. This might be due to the introduction of the correction for the PSF wings in C00 fluxes and not in our values, which is compensated by the fact that our measurements extended all over the detector, as opposite to C00, which uses a limited aperture. On the contrary, for large galaxies, as for example NGC 5033, NGC 5674, NGC 1241, and NGC 3982, our flux measurements are much higher than those reported by C00. This discrepancy is due to the use of a 4.5 pixels aperture by C00 in clearly extended sources, resulting in underestimations of %. We also present in Fig. 2 the comparison between our nuclear fluxes and the C00 values, normalized to C00 values. In this case all our nuclear fluxes are lower than C00 ones, since we have subtracted the contribution of the galaxy to the nuclear flux, and moreover the radius of our Gaussian PSF is smaller than 3 pixels (the aperture employed by COO for point-like sources). Note that for Sy1 galaxies our values are in better agreement with C00, due to the fact that the compact nuclear component is dominant relative to the total galaxy emission. Summarizing, we believe that the differences found between our flux measurements and those reported by C00 justify the need of a brightness profile decomposition in order to get a more accurate determination of the nuclear flux.
4 Results
4.1 Nuclear vs total emission
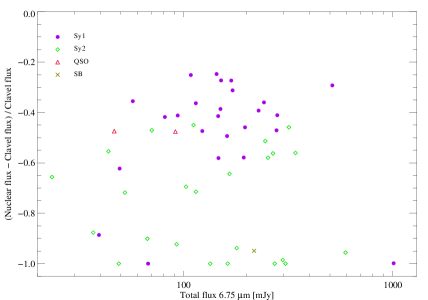
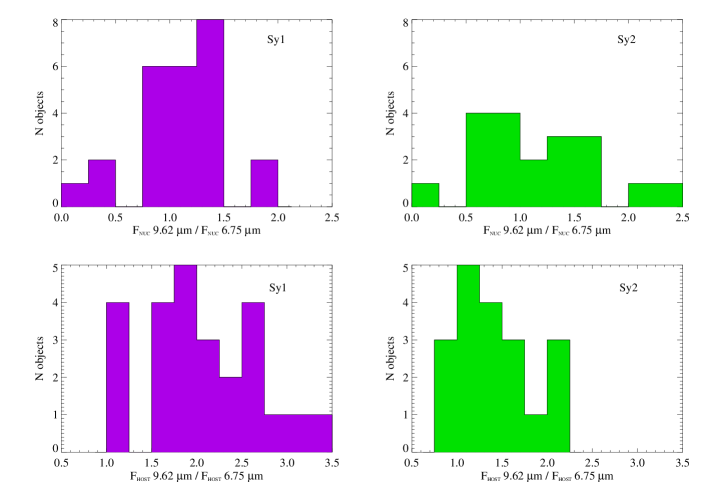
Once we have performed the profile decomposition we can measure the relative contribution of the nuclear source to the total emission for 54 objects of our sample. Note that for 7 galaxies our profile decomposition does not include a nuclear component (see Table 2), which includes 6 Sy2, namely NGC 1144, Mrk 3, NGC 1667, NGC 5728, and NGC 5953, plus the Sy1 Mrk 841 (it is an elliptical galaxy and the central component is better fitted with a bulge solely). We show in Fig. 3 the ratio of nuclear to total emission at 6.75 and 9.62 m, respectively. It can be seen in both cases that there is a clear difference between the ratios for the Seyfert types 1 and 2. In fact, the median of the ratio between nuclear and total fluxes for type 1 galaxies are 0.61 and 0.49, in the 6.75 and 9.62 m filters, respectively. These values are both 0.14 for type 2 galaxies. In case of type 2 objects, most of them are grouped around the lowest values of the nuclear vs total flux ratio, whereas for type 1, the maximum number of objects are located around or above the value 0.5. We have applied the Kolmogorov–Smirnov test to check the significance level probability of the apparent difference between Sy1 and Sy2 distributions. We found that in both wavelenght ranges, the nuclear to total flux distributions for Sy1 and Sy2 are different in a 99.9%.
We conclude that nuclear emission in the mid-infrared is a significative contribution of the total flux in Sy1 galaxies, whereas for Sy2 other components overcome the nuclear emission. This result is consistent with the unification model predictions, since the orientation of the molecular torus for type 1 Seyfert would be face-on with respect to our line of sight whereas for type 2 would be edge–on. Similar results have been found previously at different spectral ranges (Yee, 1983; Alonso-Herrero et al., 1996).
4.2 Nuclear and host galaxy mid-infrared colors
We have studied the mid-infrared color distributions for both the nuclear and the host galaxy emission. The colors of host galaxies are computed after subtracting the nuclear to the global emission. We represent in Fig. 4 the 9.62/6.75 µm color histograms for both the nuclear and the host galaxy emission, for each Seyfert type. The nuclear 9.62/6.75 µm color distributions look very similar for both types, being the median values 1.14 and 1.02 for Sy1 and Sy2, respectively. We have performed a Kolmogorov-Smirnov test, obtaining a probability of 18%, which indicates that both color distributions are not statistically different. Previous works (Spinoglio & Malkan, 1989; Fadda et al., 1998; Kuraszkiewicz et al., 2003; Alonso-Herrero et al., 2003; Lutz et al., 2004; Rigby et al., 2004) have found similar observed spectral energy distributions (SEDs) in the mid–infrared ( 5 µm) for Sy1 and Sy2 galaxies, These results are in conflict with the predictions of many compact torus models (Pier & Krolik, 1992; Granato & Danese, 1994; Efstathiou & Rowan-Robinson, 1995; Granato et al., 1997), that has promoted the search of a more distributed or complex geometry of the absorbing material around the AGN (Nenkova et al., 2002; Fritz et al., 2006; Elitzur & Shlosman, 2006; Ballantyne et al., 2006).
Despite the small number of galaxies in our sample and the proximity of the bands analised, we can conclude that the nuclear mid-infrared emission seems to be very similar and relatively flat in both types of Seyfert galaxies.
On the other hand, the color distributions of host galaxies look different, being those of type 1 redder than those of type 2 (median values of 2.00 and 1.41, respectively). The Kolmogorov-Smirnov test confirms that both distributions are different with a probability larger than 99%. This result seems to contradict the core idea of Seyfert unification scheme, which predicts no much influence of the host galaxy to determine the type of active nucleus. In the same line of our result, Hunt & Malkan (1999) pointed out that Sy1 could be older, more evolved than Sy2, since they are found more commonly in earlier morphological types.
4.3 The radio/mid–infrared correlation in our sample
A well-known correlation between global far–infrared and radio emission from galaxies apply to a wide range of Hubble types (Fitt et al., 1988; Hummel et al., 1988; Wunderlich et al., 1987). The most natural explanation for such correlation is related to star–formation activity. In addition, Elbaz et al. (2002); Gruppioni et al. (2003) found that it can be also extended to the mid–infrared range although with larger dispersion. Thus, the study of the radio/far–infrared correlation in active galactic nuclei turns out to be an useful tool for studying the starburst–AGN relationship. A priori, the presence of nuclear radio activity not related to supernova remnants should introduce departures from the mentioned correlation. Roy et al. (1998) reported that Seyfert galaxies also display the radio/far-infrared correlation, although with a larger scatter than non-active galaxies. They also found that Seyfert with compact radio cores tend to deviate from the correlation, contrary to those without compact cores. However, they noted that the correlation does not improve after subtraction of the compact radio emission.
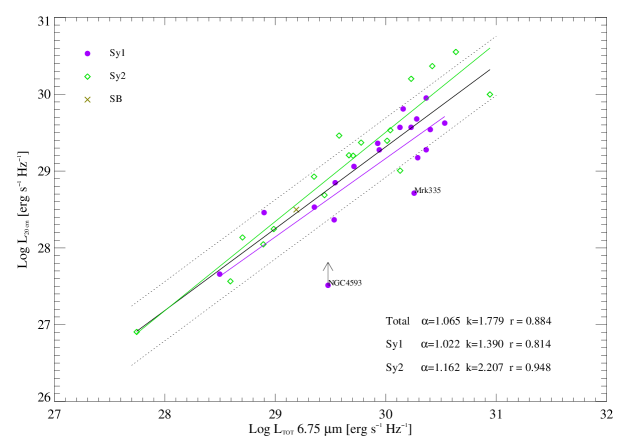
We have investigated the presence of the radio/mid-infrared correlation in our sample of Seyfert galaxies. The radio data were taken from those available in the literature. Most of them (data of 32 galaxies) come from the sample observed by Rush et al. (1996) at 20 cm using the VLA555For another 6 objects (Mrk 789, NGC 4579, ESO141-G55, NGC 4593, Mrk 509, and NGC 701) we have used VLA measurements at 20 cm, reported by different authors (Ulvestad & Wilson, 1984; Condon et al., 1998; Ho & Ulvestad, 2001; Wadadekar, 2004).. The resolution ( 1.′5) of these radio data samples the emission of large scales in the galaxy, namely 35 kpc at the median distance of the sample. From here and in all later sections, we will present results only using the LW2 filter, but we have always checked that the results obtained with both filters are practically the same. We have excluded two galaxies from subsequent analysis because their behaviour deviates from the rest of the sample. They are identified as NGC 4593 (its radio flux is a lower limit) and Mrk 335 (a S0 galaxy with a low radio emission likely due to be an early type galaxy). The luminosity-luminosity scatter diagram is presented in Fig. 5. A linear correlation appears in log-log scale, with a slope of 1.07 and a coefficient 666In order to verify that the correlation is not a distance effect, we have performed a test by upsetting in a random way the redshifts () of galaxies. If the linear correlation is merely a distance effect, it should be mantained with any distribution. In our case, the correlation disappears when the distance distribution is changed, confirming that the observed correlation is not a distance effect.. Similar correlations are found when the data are fitted for types 1 and 2, separately (see Fig. 5). The highest correlation coefficient () appears when only Sy2 are considered. In addition, we have applied a non–parametric correlation test, such as the Spearman’s rank correlation test. The results indicate that the correlation is significant () in all cases (all galaxies, and Sy1 and Sy2, separately).
We have also explored the existence of such a correlation between the same radio data and our estimations of the nuclear mid-infrared emission. The luminosity scatter diagram is presented in Fig. 6. In this case, the correlation appears worse () than when global mid-infrared luminosity is considered. Moreover, the correlation becomes distant from linear in log-log space, being the slopes different from unity (see values in Fig. 6). We also noticed that the correlation slightly improves when only Sy2 galaxies are considered. The less luminous galaxies (mostly Sy2) display an excess of radio luminosity compared to their nuclear mid-IR luminosity, indicating that most of the radio emission in these objects is not related to nuclear processes. Summarizing, the global radio emission seems to be related closely to AGN activity in the most nuclear-infrared luminous galaxies (mostly Sy1), whereas for the less luminous the radio emission would be more related to non-nuclear stellar processes. In this respect it is worth to mention the result of Baum et al. (1993), who found that extra-nuclear (several kpc) radio emission, similar to the lobes of powerful radio galaxies, appears frequently in galaxies whose properties are dominated either by an AGN or a starburst.
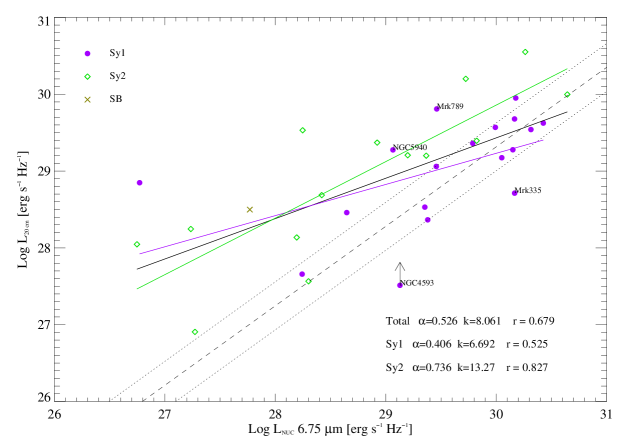
According to our results, we claim that for the less radio luminous galaxies (mostly Sy2), radio emission is more related to stellar processes, given the fact that most of the mid-infrared emission does not come from the nuclear region. However, for the more luminous galaxies (mostly Sy1),the correlation could be attributed to extended radio emission which is somewhat related to the presence of the AGN as claimed by Baum et al. (1993) and indirectly by Roy et al. (1998).
4.4 Comparison among X-rays and mid-infrared emission
The hard X–ray (2-10 keV) spectral region is of particular interest for the study of AGN. It provides a direct view to the central engine and it is believed to be a reasonable isotropic indicator of the bolometric luminosity of the nuclei. On contrast, in the simple unified models, the mid-infrared emission is expected to vary as a function, not only of the AGN luminosity, but also of the distribution of the obscuring matter along the viewing direction of the observer. As a result of this, the comparison of the mid-infrared versus the hard X–ray measurements constitutes an important test for unification models.
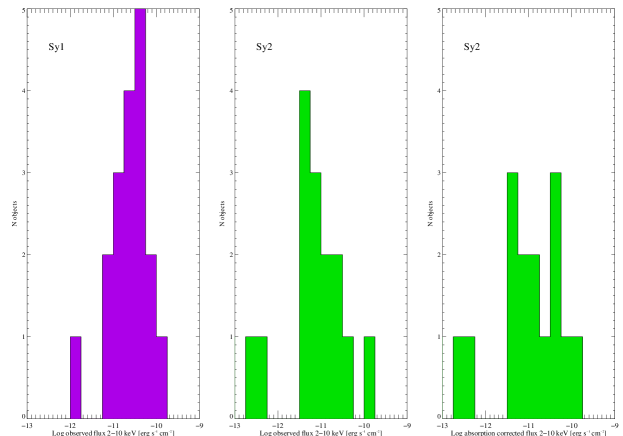
Here, we compare our mid-infrared measurements with the hard X-ray fluxes compiled by Lutz et al. (2004), obtained from various literature sources, taken by different satellites (e.g. ASCA, BeppoSAX, Chandra, XMM-Newton). They reported measurements of 35 objects which are also included in our sample, from which only 27 galaxies have intrinsic or absorption–corrected values. We represent in Fig. 7 the histograms corresponding to observed hard X–ray fluxes for Sy1 and Sy2, plus absorption corrected hard X–ray fluxes for Sy2. Given the fact that the hard X–ray emission in Sy2 galaxies is commonly strongly absorbed, it makes sense to consider the intrinsic, instead than the observed, hard X–ray fluxes. For those cases in which absorption corrected fluxes are not provided we adopt the observed flux as a lower limit. In this section we do not refer to the total infrared flux since hard X–ray emission is expected to be uniquely related to nuclear emission.
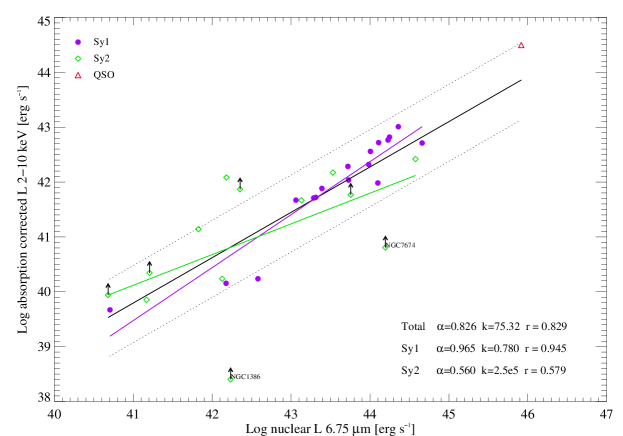
We have also looked for a correlation between X–ray and mid-infrared luminosities (see Fig. 8). The data corresponding to all galaxies display a linear correlation of slope 0.8 with correlation coefficient r = 0.83. We noticed that a good correlation appears between X–ray and nuclear mid-infrared luminosities for type 1 nuclei ( = 0.97 and r = 0.95). However, the data for type 2 nuclei present higher dispersion ( = 0.56 and r = 0.58), showing lower mid-infrared luminosities relative to their X–ray luminosities. We have also applied the Spearman’s rank correlation test, finding that the correlation is significant when all galaxies and only type 1 nuclei are considered. We have checked that this correlation is not a distance effect by upsetting in a random way the redshift distribution of the galaxies.
The ratio of hard–X ray to nuclear mid-infrared emission appears larger in the case of type 1 nuclei (), than in the case of type 2 nuclei (). Both distributions appear significatively different according to the Kolmogorov-Smirnov test. We have excluded the galaxies NGC1386 and NGC7674 due to their extremely low ratios, which in addition are lower limits.
The difference in the ratios for Sy1 and Sy2 appears contradictory to that has been claimed by Lutz et al. (2004) and Horst et al. (2006). Nevertheless, we expect to find different results when we compare with the work of Lutz et al. (2004), since they have extracted the nuclear emission by spectral decomposition of very large aperture data. We have checked that their estimations of the AGN contribution are largely overestimated compared to our measurements of the nuclear component. In the case of Horst et al. (2006), they have obtained very high resolution data in the mid-infrared range but their sample is very reduced. The small dispersion claimed by Horst et al. (2006) could be due to the limited number of galaxies included.
Our results are in qualitative agreement with the predictions of unification models. In case of type 1 nuclei we would see direct emission from the nucleus at any wavelength range. In type 2 nuclei the intrinsic hard X–ray emission would be similar, i.e., after absorption correction, to type 1. The mid-infrared emission coming from a dusty torus would depend on the viewing angle as a function of the optical depth of the obscuring structure. The predictions vary drastically for different models. The initially proposed torus models by Pier & Krolik (1992) predict large variation for both Seyfert type in the mid-infrared range. However, more recent clumpy torus models do not predict large offset between both Seyfert types (Nenkova et al., 2002; Hönig et al., 2006). This variation will be larger for shorter wavelengths where the innermost part of the torus dominates, and will be attenuated for longer wavelengths where the outermost parts dominate. This may be one of the reasons to explain why we detect large difference in the X–ray to mid-infrared ratio for types 1 and 2, contrary to that has been found by previous authors using a longer wavelength filter (Horst et al., 2006).
4.5 The mid-infrared properties of hidden broad-line region Seyfert 2 and narrow-line Seyfert 1 galaxies
According to the unification scheme of Seyfert galaxies each Sy2 galaxy should have a hidden broad–line region (HBLR), as found in the prototypical NGC 1068 (Antonucci & Miller, 1985). However, spectropolarimetric surveys of complete samples of Sy2 galaxies show that hidden type 1 nuclei have been detected in less than % of the galaxies from the CfA and 12 µm samples (Lumsden & Alexander, 2001; Moran et al., 2000; Tran, 2001, 2003). These objects with failed detection of a type 1 nuclei are known as non–hidden broad-line region (NHBLR) Sy2 galaxies. The non–detection of broad lines could be explained in the case of an edge-on line of sight or in the absence of an electron scattering region (Miller & Goodrich, 1990; Taniguchi & Anabuki, 1999). However, some large–scale characteristics of the HBLR galaxy population are not shared by the non–HBLR population. The HBLR galaxies display distinctly higher radio power relative to their far-infrared output and hotter dust temperature (F color), compared to the NHBLR Sy2 galaxies (Tran, 2003). The NHBLR galaxies also appear sistematicly as weaker radio sources than their HBLR counterparts (Thean et al., 2001). The level of obscuration, as measured by the Balmer decrement, is indistinguishable between both types of Sy2 as well as the high level of starlight domination (Moran et al., 2000). Thus, the relative number of HBLR and non–HBLR galaxies cannot be explained by different orientations, challenging the unification scheme (Tran, 2001, 2003; Lumsden & Alexander, 2001). These results strongly support the existence of two intrinsically different populations of Sy2 galaxies: one harbouring an energetic, hidden Sy1 nucleus with a broad-line region and the other, ”true” Sy2 galaxies, with a weak or absent type 1 nucleus and a strong, likely dominating starburst component (Tran, 2003).
Three galaxies from Tran (2003) with spectropolarimetric confirmed HBLR are included in our initial sample of 57 AGNs, namely NGC 4388, NGC 7674, and IR 05189-2524, and also seven NHBLR, namely Mrk 266, NGC 1144, NGC 1241, NGC 1386, NGC 1667, NGC 3982, and NGC 5929. We have investigated possible differences in the mid–infrared properties segregating both types of Sy2 galaxies in our sample. We add two Sy2 galaxies to the Tran (2003) ones, namely IC 4397 and NGC 7592, and other Seyfert types for which we have found far-infrared data in the literature (Pérez García & Rodríguez Espinosa, 2001). We present in Fig. 9 the variation of the ratio between our mid-infrared nuclear and total fluxes versus the far–infrared color . The nuclear versus total emission ratios of the HBLR are among the highest values for Sy2. On the contrary, for NHBLR these ratios are among the lowest values. The ratio of the nuclear versus total flux is below 0.02 in NGC 1241 and NGC 3982, and does not exceed 0.5 in Mrk 266, IC 4397, and NGC 1386. For the galaxies NGC 1144 and NGC 1667 we could not identify a central unresolved source, which could be associated with the presence of an AGN. NGC 5929 and NGC 7592 are excluded from this analysis because their nuclear emission cannot be isolated because of its close–by companion, and because of its double nucleus, respectively, due to our limited spatial resolution. Both galaxies appear in Fig. 9 in order to show their far–infrared colors.
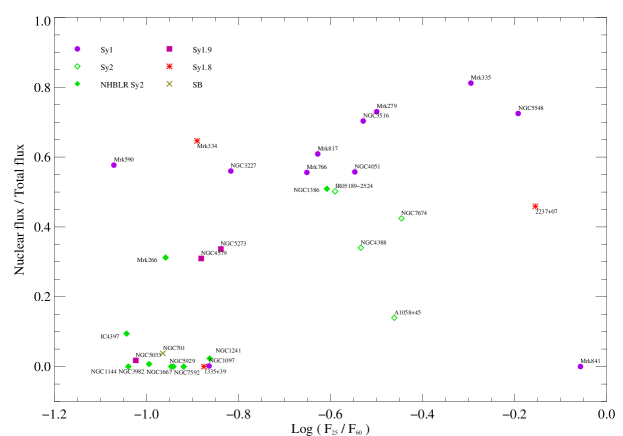
Tran (2003) found that the far–infrared colors compared to the radio flux can be used as a good discriminant between HBLR and NHBLR (Fig. 4 in Tran 2003). We present a similar diagram in Fig. 10 for the galaxies in our sample. Radio fluxes (20 cm) are the same used in Section 4.3. Despite the low number of objects, it appears that recognized HBLR Sy2 galaxies are located in the upper–right corner, whereas NHBLR galaxies tend to occupy the bottom–left corner of the diagram. As a result of the use of Figs. 9 and 10 as diagnostic diagrams we can propose new NHBLR candidates. For instance, IC 4397 and NGC 7592 are located in the left–bottom quadrant of Fig. 10, and the former also shows a low nuclear to total flux ratio. These facts would support the classification of IC 4397 and NGC 7592 as possible NHBLR Sy2 nucleus.
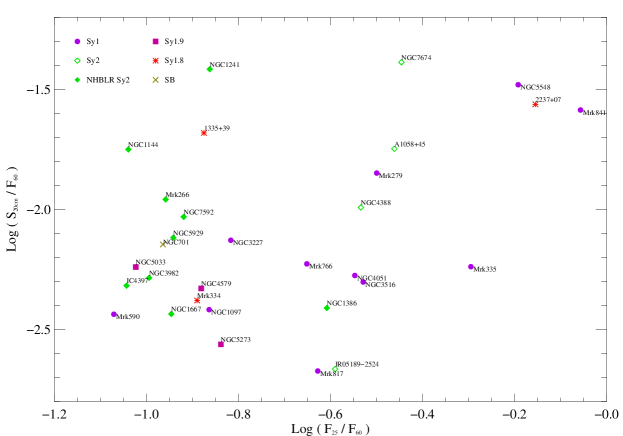
It is interesting to look at the position of intermediate Seyfert type galaxies in Fig. 10. Tran (2001) only reports pure Sy2 data, but in Fig. 10 we are including Sy1.8 and Sy1.9 too. All the three Sy1.9 have low S20cm/F60µm and F ratios, corresponding to the NHBLR region. Sy1.8 galaxies ocuppy random positions in the diagram.
Zhang & Wang (2006) suggest that NHBLR Sy2 are the counterparts of Narrow Line Seyfert 1 (NL Sy1) viewed at larger angles. The NL Sy1 class is characterized for very narrow Balmer lines [Hβ FWHM 2000 km s-1], strong [Fe II] lines (Osterbrock & Pogge, 1985), and violent variability in soft X-rays (Boller et al., 1996). We have looked for galaxies in our sample classified by them as NL Sy1 and we found three: Mrk 335, Mrk 766, and NGC 4051, whose fluxes are reported in Table 3. In our diagrams (Figs. 9 and 10) these galaxies occupy the same region as Sy1 and HBLR Sy2. According to our view this result contradicts the hypothesis of Zhang & Wang (2006).
5 Conclusions
We have presented and analyzed mid-infrared data of a sample of Seyfert galaxies obtained with the instrument ISOCAM, being able to separate the nuclear and extended contributions to the total emission. The following results were found:
-
•
The nuclear emission in the mid-infrared is a significant contribution to the total flux in Sy1 galaxies whereas for Sy2 other components overcome the nuclear emission. This result is consistent with the unification model predictions.
-
•
The mid-infrared color distribution of the host galaxies of Sy1 appears redder than that of Sy2, whereas the nuclear mid-infrared emission seems to be more similar in both types of Seyfert galaxies, being also relatively flat.
-
•
The global radio emission of Seyfert galaxies seems to be related closely to AGN activity in the most nuclear-infrared luminous galaxies (mostly Sy1), whereas for the less luminous (mostly Sy2) the radio emission would be more related to non-nuclear stellar processes.
-
•
The luminosity–luminosity scatter diagram between hard X-ray and mid-infrared emission seems to indicate a good correlation between the two quantities, at least in the case of type 1 nuclei. The ratio between the intrinsic hard X–ray and the nuclear mid-infrared emission presents large scatter and slightly larger values for type 2 Seyfert galaxies. These results seem to be consistent with the presence of a clumpy dusty torus surrounding the active nucleus.
-
•
The mid-infrared properties of HBLR and NHBLR nuclei appear different. The nuclear to total flux ratios of the HBLR objects are among the highest values for Sy2. On the contrary, for NHBLR these ratios are among the lowest values. A diagram representing the mid-infrared nuclear to total emission ratio versus the far-infrared colors seems to be a useful tool to segregate both types of Sy2 nuclei.
References
- Alonso-Herrero et al. (2003) Alonso-Herrero, A., Quillen, A. C., Rieke, G. H., Ivanov, V. D., & Efstathiou, A. 2003, AJ, 126, 81
- Alonso-Herrero et al. (1996) Alonso-Herrero, A., Ward, M.J., & Kotilainen, J.K. 1996, MNRAS, 278, 902
- Antonucci & Miller (1985) Antonucci, R. R. J. & Miller, J. S. 1985, ApJ, 297, 621
- Antonucci (1993) Antonucci, R. 1993, ARA&A, 31,473
- Ballantyne et al. (2006) Ballantyne, D. R., Shi, Y., Rieke, G. H., Donley, J. L., Papovich, C., & Rigby, J. R. 2006, ApJ, 653, 1070
- Baum et al. (1993) Baum S. A., O’Dea C. P, Dallacassa, D., De Bruyn A. G., & Pedlar, A. 1993, ApJ, 419, 553
- Boller et al. (1996) Boller, Th., Brandt, W. N., & Fink, H. 1996, A&A,305,53
- Buta (1996) Buta, R. 1996, in IAU Colloq., 157, Barred Galaxies, ed. R. Buta, D. A. Crocker, & B. G. Elmegreen (ASP Conf. Ser. 91; San Francisco: ASP), 11
- Cesarsky et al. (1996) Cesarsky, C., et al. 1996, A&A,315,32
- Chen & Wang (2004) Chen, L.-H. & Wang, J.-M. 2004, ApJ,614,101
- Clavel et al. (2000) Clavel, J., et al. 2000, A&A,357,839
- Condon et al. (1998) Condon, J. J., Cotton, W. D., Greisen, E. W., Yin, Q. F., Perley, R. A., Taylor, G. B., & Broderick, J. J. 1998, AJ,115,1693
- Efstathiou & Rowan-Robinson (1995) Efstathiou, A., & Rowan-Robinson, M. 1995, MNRAS, 273, 649
- Elbaz et al. (2002) Elbaz, D., Cesarsky, C. J., Chanial, P., Aussel, H., Franceschini, A., Fadda, D., & Chary, R. R. 2002, A&A, 384, 848
- Elitzur & Shlosman (2006) Elitzur, M., & Shlosman, I. 2006, ApJ, 648, L101
- Fadda et al. (1998) Fadda, D., Giuricin, G., Granato, G. L., & Vecchies, D. 1998, ApJ, 496, 117
- Feigelson & Berg (1983) Feigelson, E. D. & Berg, C. J. 1983, ApJ, 269, 400
- Fitt et al. (1988) Fitt, A. J., Alexander, P., & Cox, M. J. 1988, MNRAS, 233, 907
- Fritz et al. (2006) Fritz, J., Franceschini, A., & Hatziminaoglou, E. 2006, MNRAS, 366, 767
- Granato & Danese (1994) Granato, G. L., & Danese, L. 1994, MNRAS, 268, 235
- Granato et al. (1997) Granato, G. L., Danese, L., & Franceschini, A. 1997, ApJ, 486, 147
- Gruppioni et al. (1999) Gruppioni, C., Mignoli, M., & Zamorani, G. 1999,MNRAS, 304, 199
- Gruppioni et al. (2003) Gruppioni, C., Pozzi, F., Zamorani, G., Ciliegi, P., Lari, C., Calabrese, E., La Franca, F., & Matute, I. 2003, MNRAS, 341, L1
- Hönig et al. (2006) Hönig, S. F., Beckert, T., Ohnaka, K., & Weigelt, G. 2006, A&A, 452, 459
- Horst et al. (2006) Horst, H., Smette, A., Gandhi, P., & Duschl W.J. 2006, A&A, 457, L17
- Hunt & Malkan (1999) Hunt, L.K., & Malkan, M.A. 1999, ApJ, 516, 660
- Hunt & Malkan (2004) Hunt, L.K., & Malkan, M.A. 2004, ApJ, 616, 707
- Jaffe et al. (2004) Jaffe, W., Meisenheimer, K., Röttgering, H. J. A., et al. 2004, Nature, 429, 47
- Jedrzejewski (1987) Jedrzejewski, R. I. MNRAS, 226, 747
- Kessler et al. (1996) Kessler, M. F., et al. 1996, A&A, 315, 27
- Krabbe et al. (2001) Krabbe, A., Böker, T., & Maiolino, R. 2001, ApJ, 557, 626
- Kuraszkiewicz et al. (2003) Kuraszkiewicz, J. K. 2003, ApJ, 590, 128
- Ho & Ulvestad (2001) Ho, L. C., & Ulvestad, J. S. 2001, ApJS, 133, 77
- Hummel et al. (1988) Hummel, E., Davies, R. D., Pedlar, A., Wolstencroft, R. D., & van der Hulst, J. M. 1988, A&A, 199, 91
- Laor et al. (1997) Laor, A., et al. 1997, ApJ, 477, 93
- Lemke et al. (1996) Lemke, D., et al. 1996, A&A, 315, 64
- Lumsden & Alexander (2001) Lumsden, S. L. & Alexander, D. M. 2001, MNRAS, 328, 32
- Lutz et al. (2004) Lutz, D., Maiolino, R., Spoon, H. W. W., & Moorwood, A. F. M. 2004, A&A, 418, 465
- Malkan et al. (1998) Malkan, M. A., Gorjian, V., & Tam, R. 1998, ApJS, 117, 25
- Melo et al. (2002) Melo, V. P., Pérez García, A. M., Acosta-Pulido, J. A., Mu oz-Tu ón, C., & Rodríguez Espinosa, J. M. 2002, ApJ, 574, 709
- Miller & Goodrich (1990) Miller, J. S. & Goodrich, R. W. 1990,ApJ, 355, 456
- Moran et al. (2000) Moran, E. C., Barth, A. J., Kay, L. E., & Filippenko, A. V. 2000, ApJ, 540, L73
- Nenkova et al. (2002) Nenkova, M., Ivezić, ., Elitzur, M. 2002, ApJ, 570, L9
- Oliver et al. (2000) Oliver, S., et al. 2000, MNRAS, 316, 749
- Osterbrock & Pogge (1985) Osterbrock, D. E. & Pogge, R. W. 1985, ApJ, 297, 166
- Pérez García & Rodríguez Espinosa (2001) Pérez García, A. M. & Rodríguez Espinosa, J. M. 2001, ApJ,557,39
- Piccinotti et al. (1982) Piccinotti, G., Mushotzky, R. F., Boldt, E. A., Holt, S. S., Marshall, F. E., Serlemitsos, P. J., & Shafer, R. A. 1982,ApJ, 253, 485
- Pier & Krolik (1992) Pier, E. A., & Krolik, J. H. 1992, ApJ, 401, 99
- Prieto et al. (1997) Prieto, M., Gottesman, S. T., Aguerri, J.-A.L., & Varela, A.-M. 1997, AJ, 114, 1413
- Rigby et al. (2004) Rigby, J. R., et al. 2004, ApJS, 154, 160
- Rowan-Robinson & Crawford (1989) Rowan-Robinson, M., & Crawford, J. 1989, MNRAS, 38, 523
- Roy et al. (1998) Roy, A. L., Norris, R. P., Kesteven, M. J., Troup, E. R., & Reynolds, J. E. 1998, MNRAS, 301, 1019
- Rush et al. (1996) Rush, B., Malkan, M. A., & Edelson, R. A. 1996, ApJ, 473, 130
- Siebenmorgen et al. (2005) Siebenmorgen, R., Haas, M., Krügel, E., & Schulz, B. 2005, A&A, 436, L5
- Spinoglio & Malkan (1989) Spinoglio, L., & Malkan, M. A. 1989, ApJ, 342, 83
- Taniguchi & Anabuki (1999) Taniguchi, Y. & Anabuki, N. 1999, ApJ,521,103
- Thean et al. (2001) Thean, A., Pedlar, A., Kukula, M. J., Baum, S. A., & O’Dea, C. P. 2001, MNRAS, 325, 737
- Tran (2001) Tran, H. D. 2001, ApJ, 554, 19
- Tran (2003) Tran, H. D. 2003, ApJ, 583, 632
- Ulvestad & Wilson (1984) Ulvestad, J. S., & Wilson, A. S. 1984, ApJ, 285, 439
- Ulvestad & Wilson (1989) Ulvestad, J. S., & Wilson, A. S. 1989, ApJ, 343, 659
- Ulvestad & Ho (2001) Ulvestad, J. S., & Ho, L. C. 2001, ApJ, 558, 561
- Wadadekar (2004) Wadadekar, Y. 2004, A&A, 416, 35
- Wang et al. (1999) Wang, J.-M., Szuszkiewicz, E., Lu, F.-J., & Zhou, Y.-Y. 1999, ApJ, 522, 839
- Wunderlich et al. (1987) Wunderlich E.,Wielebinski R., Klein U. 1987, A&AS, 69, 487
- Yee (1983) Yee, H. K. C. 1983, ApJ, 473, 473
- Zhang & Wang (2006) Zhang, E.-P. & Wang, J.-M. 2006, accepted 2006 June 5 by ApJ
| TARGET | Morphology | Type | Exptime (s) | Start Time (UT) | |
|---|---|---|---|---|---|
| NGC1097 | RSB(r)b | Sy1 | 0.00425 | 516 | 01 01 1997 02:20:48 |
| NGC1125 | SAB0 | Sy2 | 0.01100 | 516 | 01 02 1998 13:42:51 |
| NGC1144 | RSApec | Sy2 | 0.02885 | 516 | 13 07 1997 05:44:46 |
| NGC1241 | SB(rs)b | Sy2 | 0.01351 | 516 | 04 01 1998 15:03:35 |
| Z 1335.5+3925 | S? | Sy1.8 | 0.02009 | 516 | 09 06 1996 12:45:19 |
| NGC1386 | SB(s)0+ | Sy2 | 0.00289 | 516 | 27 01 1998 02:50:27 |
| NGC1566 | RSAB(rs)bc | Sy1 | 0.00499 | 516 | 18 05 1997 18:08:52 |
| NGC1667 | SAB(r)c | Sy2 | 0.01517 | 516 | 02 10 1997 21:32:21 |
| Mrk266 | pec | Sy2/SB | 0.02786 | 516 | 04 05 1996 16:04:24 |
| Mrk279 | S0 | Sy1.5 | 0.02940 | 514 | 05 02 1996 07:26:57 |
| NGC3227 | SAB(s)pec | Sy1.5 | 0.00386 | 516 | 25 04 1996 04:32:37 |
| Mrk334 | pec/HII | Sy1.8 | 0.02196 | 516 | 12 12 1996 00:59:23 |
| Mrk335 | S0/a | Sy1.2 | 0.02564 | 516 | 12 12 1996 01:29:13 |
| NGC3516 | RSB(s)0 | Sy1.5 | 0.00884 | 524 | 12 03 1996 11:32:22 |
| NGC3982 | SAB(r)b | Sy2 | 0.00370 | 524 | 08 04 1996 06:14:36 |
| 3C382 | BLRG | Sy1 | 0.05787 | 514 | 16 02 1996 18:30:26 |
| Mrk3 | S0: | Sy2 | 0.01351 | 516 | 04 09 1997 11:12:01 |
| NGC4051 | SAB(rs)bc | Sy1.5 | 0.00242 | 516 | 09 05 1996 09:36:57 |
| IC4329A | SA0+ | Sy1.2 | 0.01605 | 514 | 14 02 1996 16:25:00 |
| NGC4388 | SA(s)b | Sy2 | 0.00842 | 516 | 09 07 1996 06:18:36 |
| IC4397 | S? | Sy2/HII | 0.01474 | 514 | 07 02 1996 19:08:30 |
| NGC4507 | SAB(s)ab | Sy2 | 0.01180 | 514 | 04 02 1996 12:06:42 |
| NGC4579 | SAB(rs)b | Sy1.9/LINER | 0.00507 | 516 | 13 07 1996 00:03:03 |
| NGC4593 | RSBb(rs)b | Sy1 | 0.00900 | 516 | 14 07 1996 06:20:04 |
| NGC5033 | SA(s)c | Sy1.9 | 0.00292 | 516 | 25 06 1996 12:13:25 |
| Mrk509 | Compact | Sy1.2 | 0.03440 | 516 | 18 10 1996 03:03:22 |
| NGC526A | S0pec? | Sy1.5 | 0.01922 | 516 | 24 11 1996 03:13:59 |
| NGC5273 | SA(s)0 | Sy1.9 | 0.00352 | 516 | 25 06 1996 11:51:23 |
| NGC5548 | RSA(s)0/a | Sy1.5 | 0.01717 | 514 | 07 02 1996 16:57:22 |
| NGC5674 | SABc | Sy1.9 | 0.02492 | 514 | 07 02 1996 14:05:36 |
| NGC5728 | RSAB(r)a | Sy2 | 0.00930 | 514 | 07 02 1996 08:49:23 |
| Mrk590 | SA(s)a | Sy1.2 | 0.02638 | 516 | 03 07 1997 15:11:27 |
| NGC5929 | Sab: pec | Sy2 | 0.00831 | 514 | 05 02 1996 13:31:51 |
| NGC5940 | SBab | Sy1 | 0.03405 | 514 | 07 02 1996 15:06:16 |
| NGC5953 | SAa pec | Sy2/LINER | 0.00656 | 514 | 07 02 1996 16:24:58 |
| Mrk673 | S? | Sy2/LINER/HII | 0.03651 | 514 | 07 02 1996 19:55:02 |
| NGC701 | SB(rs)c | SB | 0.00610 | 516 | 18 12 1997 00:35:41 |
| NGC7314 | SAB(rs)bc | Sy1.9 | 0.00474 | 516 | 29 04 1996 12:42:14 |
| NGC7592 | S0+pec | Sy2 | 0.02444 | 516 | 15 11 1996 15:56:53 |
| NGC7603 | SA(rs)b pec | Sy1.5 | 0.02952 | 516 | 18 05 1996 05:47:11 |
| Mrk766 | RSB(s)a | Sy1.5 | 0.01293 | 516 | 02 06 1996 04:17:32 |
| NGC7674 | SA(r)bc pec | Sy2/HII | 0.02906 | 516 | 28 05 1996 06:39:23 |
| Mrk789 | Irregular | Sy1/HII | 0.03145 | 516 | 16 12 1996 12:51:04 |
| Mrk817 | SBc | Sy1.5 | 0.03145 | 514 | 05 02 1996 14:04:02 |
| Mrk841 | E | Sy1.5 | 0.03620 | 514 | 07 02 1996 15:54:02 |
| A 1058+45 | Sa | Sy2 | 0.02908 | 516 | 18 04 1996 09:51:17 |
| Ark 120 | Sb/pec | Sy1 | 0.03273 | 516 | 20 08 1997 13:05:38 |
| ESO137-G34 | SAB(s)0/a? | Sy2 | 0.00916 | 514 | 09 02 1996 08:31:18 |
| ESO141-G55 | Sc | Sy1 | 0.03600 | 524 | 04 03 1996 18:04:15 |
| FAIRALL9 | S | Sy1 | 0.04702 | 516 | 06 05 1996 09:28:16 |
| H 1821+643 | QSO/Sy1 | 0.29700 | 514 | 05 02 1996 10:11:07 | |
| HS0624+6907 | QSO | 0.37000 | 516 | 04 09 1997 09:06:18 | |
| HS1700+6416 | QSO | 2.73574 | 826 | 18 10 1996 19:52:33 | |
| IR 05189-2524 | pec | Sy2 | 0.04256 | 516 | 18 10 1997 00:57:35 |
| IR 12495-1308 | Sa | Sy1 | 0.01463 | 516 | 19 12 1996 11:29:20 |
| IR 22377+0747 | SBa | Sy1.8 | 0.02460 | 516 | 18 05 1996 09:26:28 |
| MCG+8-11-11 | SB0 | Sy1.5 | 0.02048 | 516 | 14 10 1997 23:51:53 |
| MGC-6-30-15 | E-S0 | Sy1.2 | 0.00775 | 514 | 14 02 1996 17:51:30 |
| GALAXY | PSF int. | Exp. length scale | Bar length scale | Bar falling slope | Ring radial offset | Ring width | ||||||
|---|---|---|---|---|---|---|---|---|---|---|---|---|
| LW2 | LW7 | LW2 | LW7 | LW2 | LW7 | LW2 | LW7 | LW2 | LW7 | LW2 | LW7 | |
| NGC1097 | 1.211.31 | 1.161.30 | 2.700.10 | 3.070.26 | 3.410.11 | 3.270.08 | 0.750.11 | 0.790.18 | ||||
| NGC1125 | 14.24.5 | 9.672.63 | 14.74.9 | 14.74.9 | 2.161.43 | 3.100.85 | 0.620.35 | 0.330.24 | ||||
| NGC1144 | 7.592.11 | 7.502.10 | 2.980.56 | 2.880.08 | 0.060.02 | 0.060.05 | ||||||
| NGC1241 | 1.871.45 | 1.720.81 | 9.450.46 | 10.33.1 | 1.440.21 | 2.011.32 | 1.140.72 | 1.000.68 | 0.880.37 | 1.000.50 | ||
| Z 1335.5 | 1.340.06 | 1.320.06 | ||||||||||
| NGC1386 | 46.72.4 | 43.81.7 | 2.240.05 | 3.160.07 | ||||||||
| NGC1566 | 18.25.8 | 7.952.53 | 1.420.20 | 1.520.11 | 10.02.0 | 10.02.0 | 2.000.40 | 2.000.40 | ||||
| NGC1667 | 2.100.20 | 2.620.62 | 7.630.64 | 8.710.65 | 1.190.18 | 1.180.22 | ||||||
| Mrk266 | 13.35.4 | 13.75.3 | 1.210.13 | 1.760.17 | ||||||||
| Mrk279 | 22.22.0 | 29.36.7 | 1.840.10 | 1.180.09 | ||||||||
| NGC3227 | 58.26.7 | 54.65.5 | 1.290.15 | 1.300.20 | 0.400.10 | 0.400.10 | 13.22.6 | 13.03.0 | ||||
| Mrk334 | 26.83.0 | 17.13.9 | 0.990.06 | 0.880.05 | ||||||||
| Mrk335 | 43.34.8 | 34.65.0 | 1.230.10 | 1.200.10 | ||||||||
| NGC3516 | 59.68.2 | 76.310.3 | 1.450.11 | 1.420.09 | ||||||||
| NGC3982 | 1.500.20 | 2.360.34 | 5.300.30 | 5.540.23 | 1.690.07 | 1.750.05 | ||||||
| 3C382 | 15.03.1 | 17.54.2 | 1.320.19 | 2.020.41 | ||||||||
| Mrk3 | (8.770.59) | (8.970.33) | (2.400.10) | (2.020.09) | ||||||||
| NGC4051 | 58.49.1 | 65.015.8 | 13.03.0 | 12.93.4 | 0.301.10 | 0.291.02 | 0.750.28 | 0.800.30 | ||||
| IC4329A | 15532 | 20932 | 1.980.13 | 2.100.10 | ||||||||
| NGC4388 | 44.23.6 | 38.84.9 | 19.64.5 | 20.05.0 | 2.500.40 | 2.200.30 | 0.300.10 | 0.300.10 | ||||
| IC4397 | 2.370.26 | 1.690.25 | 3.370.11 | 3.700.10 | ||||||||
| NGC4507 | 55.88.4 | 89.416.2 | 0.900.20 | 1.340.15 | 9.340.44 | 9.570.59 | 0.900.20 | 0.950.24 | ||||
| NGC4579 | 12.01.3 | 16.41.7 | 2.010.07 | 2.770.16 | ||||||||
| NGC4593 | 32.913.1 | 43.58.0 | 0.990.26 | 1.020.11 | ||||||||
| NGC5033 | 4.050.49 | 4.380.44 | 5.540.24 | 5.920.33 | 0.870.15 | 1.040.18 | 9.130.34 | 9.600.30 | 3.060.16 | 2.700.10 | ||
| Mrk509 | 44.15.3 | 42.87.8 | 1.440.16 | 1.200.10 | ||||||||
| NGC526A | 32.82.7 | 35.25.9 | 1.640.15 | 1.520.15 | ||||||||
| NGC5273 | 2.960.46 | 2.900.80 | 3.210.33 | 2.920.35 | ||||||||
| NGC5548 | 40.63.3 | 42.24.1 | 1.580.08 | 1.490.07 | ||||||||
| NGC5674 | 1.971.47 | 2.591.93 | 1.970.19 | 1.280.31 | 8.002.00 | 7.501.00 | 1.000.10 | 2.000.10 | ||||
| NGC5728 | 6.063.45 | 6.003.00 | 0.600.50 | 0.600.50 | 0.650.16 | 0.610.07 | ||||||
| Mrk590 | 31.58.9 | 47.711.1 | 2.670.30 | 3.520.40 | ||||||||
| NGC5940 | 2.380.26 | 1.581.04 | 32.01.0 | 32.50.7 | 4.970.21 | 3.192.20 | 0.060.17 | 1.500.70 | ||||
| NGC5953 | 1.500.80 | 2.113.25 | 2.430.86 | 2.181.12 | 0.250.14 | 0.440.29 | ||||||
| Mrk673 | 7.593.80 | 2.002.00 | 1.761.92 | 5.204.60 | 1.260.92 | 1.570.71 | 0.680.26 | 0.460.25 | ||||
| NGC701 | 5.571.22 | 2.120.95 | 4.180.16 | 4.550.19 | ||||||||
| NGC7314 | 8.214.99 | 8.722.52 | 7.304.30 | 7.004.00 | 1.000.10 | 1.300.30 | 0.580.21 | 0.050.03 | ||||
| NGC7603 | 32.91.9 | 29.31.7 | 2.600.40 | 2.600.40 | ||||||||
| Mrk766 | 33.58.2 | 42.410.6 | 4.501.90 | 4.541.89 | 1.000.10 | 1.050.99 | 0.600.20 | 0.610.24 | ||||
| NGC7674 | 42.46.2 | 58.616.2 | 2.130.15 | 2.510.28 | ||||||||
| Mrk789 | 6.795.36 | 3.363.59 | 6.008.00 | 5.897.68 | 2.300.90 | 2.310.92 | 0.630.40 | 0.630.40 | ||||
| Mrk817 | 27.73.9 | 53.14.9 | 1.230.08 | 1.510.08 | ||||||||
| Mrk841 | (5.720.83) | (6.560.61) | (1.870.40) | (1.660.28) | ||||||||
| A 1058+45 | 1.960.37 | 3.111.13 | 2.940.17 | 3.180.23 | ||||||||
| Ark 120 | 43.524.7 | 17.813.7 | 1.590.60 | 1.410.18 | ||||||||
| ESO141-G55 | 22.62.9 | 21.711.4 | 13.03.1 | 15.04.0 | 0.611.13 | 0.500.90 | 0.850.30 | 0.610.29 | ||||
| FAIRALL9 | 47.39.2 | 53.59.9 | 1.330.16 | 1.470.10 | ||||||||
| H 1821+643 | 21.21.6 | 27.42.1 | 1.360.06 | 1.280.05 | ||||||||
| HS0624+6907 | 12.32.1 | 14.62.5 | 1.350.14 | 1.470.15 | ||||||||
| IR 05189-2524 | 47.110.1 | 71.522.8 | 3.190.39 | 3.410.58 | 1.850.13 | 1.870.85 | 0.020.04 | 0.180.22 | ||||
| IR 12495-1308 | 7.250.56 | 10.71.1 | 4.060.46 | 3.510.44 | ||||||||
| IR 22377+0747 | 7.513.93 | 6.303.30 | 0.890.32 | 0.651.82 | 8.953.11 | 9.112.17 | 0.291.65 | 0.561.21 | ||||
| MCG+8-11-11 | 54.714.7 | 47.921.0 | 0.840.18 | 0.730.11 | 12.30.5 | 12.50.5 | 0.540.73 | 0.530.72 | ||||
| MGC-6-30-15 | 43.116.3 | 54.111.5 | (7.350.75) | (8.130.37) | (1.120.27) | (1.000.10) | ||||||
| GALAXY | PSF flux | Exp. comp. flux | Bar flux | Ring flux | Total flux | |||||
|---|---|---|---|---|---|---|---|---|---|---|
| LW2 | LW7 | LW2 | LW7 | LW2 | LW7 | LW2 | LW7 | LW2 | LW7 | |
| NGC1097 | 1.701.60 | 3.102.90 | 44810 | 49023 | 543113 | 55586 | 100829 | 105432 | ||
| NGC1125 | 38.1 6.3 | 25.5 4.4 | 7.820.45 | 28.01.0 | 26.021.0 | 31.025.0 | 70.4 9.6 | 83.05.0 | ||
| NGC1144 | 89.05.0 | 86.21.4 | 70.04.0 | 62.09.0 | 1664 | 1555 | ||||
| NGC1241 | 4.142.27 | 2.400.90 | 15521 | 16680 | 22.09.0 | 17.41.9 | 17911 | 19710 | ||
| Z 1335.5+3925 | 47.42.8 | 56.72.8 | 49.03.1 | 57.32.8 | ||||||
| NGC1386 | 1255 | 1173 | 1202 | 1722 | 2468 | 2875 | ||||
| NGC1566 | 48.611.3 | 11.62.7 | 73.011.0 | 1289 | 29.11.3 | 1138 | 14713 | 26519 | ||
| NGC1667 | 47.08.0 | 69.010.0 | 26024 | 26221 | 30710 | 33411 | ||||
| Mrk266 | 36.010.0 | 36.09.0 | 78.016.0 | 89.018.0 | 11414 | 12613 | ||||
| Mrk279 | 59.43.3 | 79.011.0 | 22.71.4 | 54.07.0 | 81.34.6 | 13314 | ||||
| NGC3227 | 15613 | 14612 | 80.014.0 | 1405 | 48.07.0 | 57.60.7 | 27814 | 35517 | ||
| Mrk334 | 72.05.0 | 46.08.0 | 40.05.0 | 77.010.0 | 1117 | 1289 | ||||
| Mrk335 | 1179 | 93.010.0 | 31.04.0 | 81.08.0 | 14412 | 17613 | ||||
| NGC3516 | 16015 | 20320 | 66.05.0 | 1218 | 22820 | 33226 | ||||
| NGC3982 | 2.140.26 | 4.310.53 | 27911 | 3069 | 29710 | 3277 | ||||
| 3C382 | 40.05.7 | 46.012.0 | 18.03.0 | 21.015.0 | 57.2 7.3 | 67.3 10.6 | ||||
| Mrk3 | 1347 | 24515 | ||||||||
| NGC4051 | 15617 | 17434 | 45.70.8 | 51.08.0 | 28023 | 36130 | ||||
| IC4329A | 41845 | 56345 | 11614 | 20315 | 51365 | 75366 | ||||
| NGC4388 | 1178 | 10318 | 1929 | 1833 | 36.012.0 | 65.021.0 | 34211 | 35016 | ||
| IC4397 | 6.330.42 | 4.500.60 | 60.41.3 | 93.7 2.2 | 67.11.1 | 99.92.1 | ||||
| NGC4507 | 14817 | 24135 | 92.016.0 | 11120 | 71.93.2 | 68.0 6.0 | 31817 | 40425 | ||
| NGC4579 | 31.82.2 | 43.4 3.7 | 71.12.3 | 91.0 3.0 | 1033 | 1355 | ||||
| NGC4593 | 87.023.0 | 11721 | 10829 | 12828 | 19417 | 24014 | ||||
| NGC5033 | 10.50.6 | 11.5 0.5 | 2206 | 2057 | 3649 | 32511 | 5945 | 5414 | ||
| Mrk509 | 1188 | 11511 | 34.04.0 | 83.010.0 | 15112 | 19416 | ||||
| NGC526A | 88.4 4.5 | 94.0 12.0 | 23.0 2.0 | 51.0 4.0 | 1087 | 14411 | ||||
| NGC5273 | 7.91 0.95 | 7.60 1.50 | 14.9 0.9 | 25.0 2.0 | 23.5 1.3 | 34.0 2.3 | ||||
| NGC5548 | 1096 | 1137 | 43.8 2.6 | 1026 | 1508 | 22511 | ||||
| NGC5674 | 2.921.41 | 6.88 3.32 | 51.05.0 | 40.08.0 | 38.06.0 | 63.32.2 | 92.09.0 | 1135 | ||
| NGC5728 | 41.06.0 | 1222 | 12148 | 74.15.9 | 16212 | 20010 | ||||
| Mrk590 | 84.0 18.0 | 12421 | 57.0 7.0 | 18114 | 14623 | 30325 | ||||
| NGC5929 | 12.40.1 | 13.00.1 | ||||||||
| NGC5940 | 5.24 0.77 | 4.171.68 | 8.46 0.66 | 28.7 1.1 | 25.05.0 | 46.014.0 | 39.41.9 | 81.05.0 | ||
| NGC5953 | 86.028.0 | 80.048.0 | 18679 | 14370 | 2724 | 2232 | ||||
| Mrk673 | 20.09.0 | 4.101.90 | 2.722.04 | 21.07.0 | 30.011.0 | 49.021.0 | 52.36.0 | 75.0 7.0 | ||
| NGC701 | 8.241.28 | 3.090.98 | 2104 | 2125 | 2175 | 2155 | ||||
| NGC7314 | 18.06.0 | 23.06.0 | 11219 | 1043 | 33.08.0 | 22.05.0 | 16610 | 16311 | ||
| NGC7592 | 1611 | 1431 | ||||||||
| NGC7603 | 87.92.2 | 78.510.1 | 28.80.4 | 90.011.0 | 1144 | 1684 | ||||
| Mrk766 | 89.610.8 | 11318 | 21.30.6 | 54.017.0 | 55.95.2 | 95.09.0 | 16117 | 26023 | ||
| NGC7674 | 11310 | 15730 | 1478 | 22218 | 26719 | 37641 | ||||
| Mrk789 | 15.3 7.3 | 6.004.00 | 7.76 0.73 | 22.09.0 | 51.06.0 | 47.014.0 | 76.011.0 | 75.0 8.0 | ||
| Mrk817 | 75.07.0 | 1429 | 45.03.0 | 81.0 3.0 | 12310 | 22612 | ||||
| Mrk841 | 67.6 7.0 | 1197 | ||||||||
| A 1058+45 | 5.170.79 | 8.19 1.78 | 31.61.7 | 45.3 2.1 | 37.01.7 | 54.63.7 | ||||
| Ark 120 | 96.033.0 | 26.013.0 | 73.029.0 | 14726 | 17137 | 18027 | ||||
| ESO137-G34 | 1381 | 94.60.5 | ||||||||
| ESO141-G55 | 61.0 6.0 | 59.018.0 | 4.75 1.47 | 6.001.00 | 30.012.0 | 83.035.0 | 93.75.9 | 13620 | ||
| FAIRALL9 | 12615 | 14416 | 40.07.0 | 85.012.0 | 16924 | 22923 | ||||
| H 1821+643 | 57.1 2.9 | 73.4 9.8 | 32.6 2.4 | 54.0 7.0 | 91.33.6 | 1255 | ||||
| HS0624+6907 | 33.1 3.8 | 39.0 4.0 | 12.9 0.7 | 31.0 3.0 | 46.6 5.2 | 63.3 3.2 | ||||
| HS1700+6416 | 3.300.10 | 4.800.10 | ||||||||
| IR 05189-2524 | 12714 | 19342 | 62.05.0 | 78.04.0 | 68.013.0 | 13426 | 25318 | 41142 | ||
| IR 12495-1308 | 19.2 0.9 | 28.61.9 | 30.91.6 | 53.83.5 | 49.4 1.4 | 84.03.0 | ||||
| IR 22377+0747 | 20.1 5.8 | 16.84.9 | 18.03.0 | 28.04.0 | 8.02 1.97 | 22.13.3 | 43.78.7 | 66.0 19.0 | ||
| MCG+8-11-11 | 14729 | 12744 | 61.09.0 | 17918 | 38.31.8 | 65.91.2 | 24221 | 36833 | ||
| MGC-6-30-15 | 11536 | 14424 | 19613 | 272 11 | ||||||