Testing the Topology of Reionization
Abstract
The central overlap phase of cosmological hydrogen reionization is fundamentally a change in the topology of ionized regions. Before overlap, ionized bubbles grew in isolation. During overlap, they merge into a percolating ionized medium, which fills an ever-increasing volume and eventually replaces neutral gas throughout the intergalactic medium. Overlap can therefore be well studied using topological statistics, and in particular the genus number of the neutral-ionized interface. The most promising observational tools for applying such tests are (a) Lyman- galaxies, and (b) 21 cm tomography. Lyman- galaxies will be detected whenever they inhabit bubbles with sizes , and their presence can therefore be used to map such bubbles. Such large bubbles are expected during the overlap phase, and moreover, each one should contain a few detectably bright Lyman- galaxies. The 21cm line in principle affords better spatial resolution, but the required sensitivity and foreground subtraction may be an issue. Upcoming Lyman- surveys in the near-infrared could thus provide our first look at the topology of reionization.
1 Introduction
The hydrogen that fills the universe became neutral at the epoch of recombination (). It remained so until the first luminous objects turned on, at perhaps . Then, ultraviolet light from the first stars, galaxies, and quasars began to carve out ionized bubbles in the neutral gas. At first, these bubbles grew in isolation. The central period of the reionization process came later, when the bubbles began to overlap.
The overlap phase is fundamentally a change in the topology of the ionized regions. Thus, topological tests may provide the best diagnotics of when and how the overlap phase of reionization actually occurred (Rhoads 2003). Indeed, defining overlap as the moment when the ionized regions of the intergalactic medium become multiply connected provides a robust criterion for assessing the progress of reionization. Clustering of galaxies can result in bubbles containing multiple ionizing sources even at very early times, and recent work has highlighted the importance of such effects on ionized bubble sizes (Wyithe & Loeb 2005; Furlanetto, Zaldarriaga, & Hernquist 2004; Furlanetto & Oh 2005). Still, many bubbles must form independently in the early phases of reionization, and must merge before the universe achieves the high level of ionization seen at all redshifts . Thus, an overlap phase is an inevitable part of the reionization process.
The spatial distribution of neutral and ionized regions during reionization can be studied with a wide range of statistics. Considerable attention has been given already to quantitatively characterizing the size distribution of ionized bubbles (Furlanetto et al 2004; Furlanetto & Oh 2005) and the power spectrum of the neutral hydrogen distribution, as traced by 21cm emission (see early work by Madau, Meiksin, & Rees 1997; Gnedin & Ostriker 1997; Shaver et al 1999; Tozzi et al 2000; and the recent review by Furlanetto, Oh, & Briggs 2006). Here, we suggest the application of a quantitative topological statistic, the genus number, to the ionized / neutral interface during reionization. This will allow us to study properties of the distribution that are not retained by the other statistics.
Testing topology depends on the dimensionality of the data available. Given a two phase medium in three dimensions, it is possible for either one of the two phases to percolate; this is the “spongelike” topology that Gott, Melott, & Dickinson (1986) predicted for the cosmic density field. In a two-dimensional space, at most one phase can percolate, while in one dimension, both phases are necessarily broken into a set of disjoint regions.
Large scale structures have been studied with the three-dimensional genus curve statistic (Gott, Melott, & Dickinson 1986 [GMD]; Hamilton, Gott, & Weinberg 1986 [HGW]) and its two-dimensional analog (Melott et al 1989 [M89]).
The conventional Gunn-Peterson test provides a one dimensional section through the IGM along the line of sight to a bright quasar. Ionized cavities of size in the IGM will produce sections of spectrum with Lyman- optical depths , which can be easily identified. (Throughout the paper we denote a physical Mpc by pMpc and comoving megaparsec by cMpc; .) Given enough continuum sources at , we could determine the volume fraction of ionized gas as a function of redshift. However, the surface density of suitably bright continuum sources is much too low to expect information on multiple sight lines through any single ionized bubble.
Fortunately, other probes of reionization exist and can more naturally provide two- and three-dimensional information. We will focus primarily on low-luminosity Lyman- emitters as a tool for mapping neutral gas, but much of the discussion in this paper also applies to tomographic maps of the interstellar hydrogen made through redshifted 21 cm line observations (section 5).
Counts of Lyman- emitting galaxies will be sharply reduced in a neutral IGM, because Lyman- photons propagating through neutral gas are resonantly scattered by atomic hydrogen. Even the red wing of a Lyman- emission line can be hidden by the red damping wing of a substantially neutral IGM (Miralda-Escudé 1998; Miralda-Escudé & Rees 1998). This obscures most Lyman- photons from view. While the resonantly scattered photons will eventually redshift in the Hubble flow and escape to infinity, their “photosphere” is expected to subtend (Loeb & Rybicki 1999), resulting in an essentially undetectable surface brightness. Most Lyman- sources detected in a neutral IGM will instead be found using the modest fraction of Lyman- photons that escape scattering altogether. The red wing of the emission line may suffer from a net optical depth between one and a few (Haiman 2002). The net reduction in line flux is a factor . Given the steep Lyman- line luminosity function, this obscuration will dramatically reduce Lyman- source counts in a neutral IGM. This method was first applied to a statistical sample by Rhoads & Malhotra (2001) to demonstrate . We next applied this test at (Malhotra & Rhoads 2004), where we showed that the Lyman- luminosity function is consistent with that at and inconsistent with reduction of all Lyman- fluxes by a factor . This implies that the IGM is at most neutral. Kashikawa et al (2006) reapplied the test using larger samples. They found a deficeit of bright galaxies, and suggest that half the Lyman- may be scattered by the IGM. However, other interpretations for this modest reduction remain viable, including both true luminosity function evolution (Dijkstra et al 2006) and field-to-field variations in the galaxy number density. Other Lyman- reionization tests favor substantial ionized gas at . The volume test (Malhotra & Rhoads 2006) associates an ionized volume (about 1 pMpc in radius) with each observed Lyman- source. The volume neutral fraction is then , where is the number density of Lyman- galaxies. This yields at . Tests based on the spatial correlations of Lyman- galaxies (Furlanetto, Zaldarriaga, & Hernquist 2006; McQuinn et al 2007) work by looking for the apparent increase in Lyman- galaxy clustering caused by patches of still-neutral IGM. The first application of these (McQuinn et al) again favors an ionized IGM at .
Lyman- emitters can be discovered effectively by at least four techniques: (1) Narrowband imaging (e.g., Cowie & Hu 1998, Rhoads et al 2000, Kudritzki et al 2000, Ouchi et al 2001, Malhotra & Rhoads 2002); (2) slitless spectroscopy (e.g., Kurk et al 2004, Rhoads et al 2005, Pirzkal et al 2007); (3) slit spectroscopy (e.g., Santos et al 2004, Martin & Sawicki 2006); (4) integral field spectroscopy (van Breukelen, Jarvis, & Venemans 2005). Narrowband imaging is the most mature, and provides a two-dimensional projection of the Lyman- galaxy distribution from a slice of redshift space. Narrowband surveys thus provide natural data sets for two- dimensional genus statistics. Spectroscopic searches, or complete spectroscopic followup of narrowband samples, can provide three dimensional distributions.
The scale of interest is , which is roughly the minimum bubble size that will render low-luminosity Lyman- sources visible. At , a bandpass corresponds to a comparable scale along the line of sight (), while the transverse scale is . Modern large format CCD cameras yield fields of view of order , and surveying is feasible with narrowband filters. For now, spectroscopic searches yield smaller fields, but a slitless grism on a wide field space telescope would be a uniquely powerful tool for the type of study we are considering here. Such a search might be possible as a byproduct of several proposed missions. These include the Joint Dark Energy Mission concepts DESTINY (Benford & Lauer 2006) and ADEPT, and the parallel instrument Mag30Cam for the TPF-C mission (Brown et al 2006), all of which plan near-infrared grism surveys reaching impressive depths over many square degrees.
2 Genus Statistics and Reionization
The (3D) genus statistic provides a quantitative measure of the topology of a two-dimensional surface (typically an isodensity surface) embedded in a three-dimensional space. It is heuristically described as the number of “donut holes” in the surface minus the number of disconnected components. The two dimensional analog is the number of closed contours enclosing high density regions minus the number enclosing low density regions. Both are measured by integrating the curvature of the contour surface and applying the Gauss-Bonnet theorem, which relates the genus number to this integral (GMD; HGW; M89). It is typical to measure the genus number as a function of the contour threshold, and to parametrize the threshold level by the fraction of volume above threshold. This yields a genus curve (HGW; Weinberg, Gott, & Melott 1987). When the genus measured is for an isodensity surface of a Gaussian random phase field, HGW show that the genus number per unit volume is . Here is the contour threshold in standard deviations from the mean density, and depends only on the two-point correlation function of the field being studied.
The commonest astrophysical application of genus statistics has been the characterization of density fields, usually traced by galaxies (e.g., Gott et al 1989) and/or galaxy clusters (e.g., Rhoads, Gott & Postman 1994). Additional applications of the 2D statistic have been made or proposed for microwave background maps and for gravitational lensing shear measurements (e.g., Jain & Matsubara 2001).
There is also a one-dimensional analog, the threshold crossing statistic, which has been applied to quasar spectra at (Fan et al 2002).
3 Requirements for a Lyman Topological Test of Reionization
To successfully identify the topological signature of ionized bubble overlap in a search for Lyman- emitters, a few conditions must be fulfilled. First, the typical ionized bubble radius must be large enough that a substantial fraction of flux escapes from Lyman- emitters in the bubble. The optical depth of Lyman- damping wing absorption from neutral gas outside a ionized bubble is
| (1) |
for Lyman- photons emitted at a velocity offset from the systemic velocity of a galaxy located a physical distance (or comoving distance ) from the edge of the ionized bubble.
A bubble radius of results in a line center optical depth (e.g., Rhoads & Malhotra 2001). Bubbles of this size or larger will be apparent in the observed distribution of Lyman- galaxies, while substantially smaller bubbles will not. The characteristic bubble size, based on a Press-Schechter style model, goes from to as the volume neutral fraction drops from down to (Furlanetto et al 2004). Thus, the bubbles are large enough to allow substantial transmission of Lyman- around the epoch of 50% neutral fraction.
Second, each bubble must contain at least a few detectable Lyman- sources. Like the first constraint, this one is basically a requirement on the typical ionized bubble size. Lyman- luminosity functions are typically modeled as Schechter functions, If we consider a survey with luminosity threshold , the resulting requirement is
| (2) |
Here is the upper incomplete Gamma function, and are the characteristic bubble radius and volume, and 4 is a working minimum number of sources per bubble for genus curve measurements. A bubble (cf. eq. 1) has volume . To meet condition 2, then, we would like above a survey’s detection threshold. Observed Lyman- luminosity functions at are fit by , (Malhotra & Rhoads 2004; Kashikawa et al 2006) and from (MR04) to (Kashikawa et al 06). The desired number density is then achieved for –. A rise in the number density of faint Lyman- galaxies at has recently been suggested (Stark et al 2007), which would help with condition 2 if confirmed.
Third, as shown by Gott and collaborators (GMD, HGW, M89), galaxy distributions have their own characteristic topological signatures. Before overlap, the topological signature of the neutral and ionized regions may be strong enough to completely dominate the topology of Lyman- emitters. During and after overlap, however, this is unlikely to remain true. By using a control sample of continuum-selected galaxies alongside the Lyman- sample, we can separate the topological signatures of the intergalactic medium from those of the galaxy distribution itself. This could be accomplished through a deep Lyman break galaxy survey. The smoothed Lyman- galaxy density field would then be divided by the smoothed density field of continuum-selected galaxies. Such a method would work best if the continuum sample has a higher volume density than the Lyman- selected sample; otherwise, the uncertainties in the experiment would increase quite substantially.
Of course, if these conditions are not all fulfilled, a topological study of the large scale Lyman- source distribution will still reveal interesting information about galaxy formation and reionization. In particular, if the topological signature of isolated bubbles is not observed at any redshift, it will indicate that the sources of ionizing radiation are of low luminosity and the bubbles they produce are consequently small.

4 The Genus Curve of the Ionized-Neutral Interface
The genus number for the neutral-ionized interface can be predicted as a function of the ionized volume fraction based on simple physical arguments that describe the way reionization progresses. Formally, we define this “interface” as a fixed contour level in the local neutral fraction, . So long as the boundaries of HII regions are thin, as expected when reionization is driven primarily by stellar photons, the exact choice of matters little.
After reionization begins but well before overlap, the IGM consists of a collection of isolated, ionized bubbles embedded in a matrix of neutral gas. Each bubble may correspond to a single ionizing source, or to the ensemble of all ionizing sources in a particular peak of the density field (FZH; FO), or something in between. In this regime, the genus number of the neutral-ionized interface per unit volume is simply times the number density of (surviving) ionized bubbles. Of course, any practical measurement will depend on the ionized regions achieving some minimum detectable size, and the relevant number density should really be measured above this minimum size. The size will be closely related to the total ionizing photon production of the bubble, given by , the product of ionizing luminosity and source age or lifetime. However, it will also depend on the local gas density.
Once bubbles grow beyond the immediate neighborhood of the ionizing sources, the likely pattern of reionization depends on details of the model. Miralda-Escud’e et al (2000) used a semi-analytic approach based on a statistical description of the IGM density distribution. They argued that ionizing photon production is substantially balanced by recombinations. Because the recombination rate per ion scales with the density of ionized gas, they conclude that the low-density regions will ionize first, and that a large fraction of ionizing photon production will be balanced by recombinations at the neutral-ionized interface where the ionized gas is densest. As time goes by and the ionizing photon production rate rises, reionization gradually proceeds to the highest density regions.
More recently, studies based on numerical simulations (e.g., Iliev et al 2006) have concluded that reionization proceeds from the highest density regions, where the ionizing photon production is strongly concentrated, to the lowest density regions. In this picture, the clustering of ionizing sources is more important than the density variations in intergalactic gas.
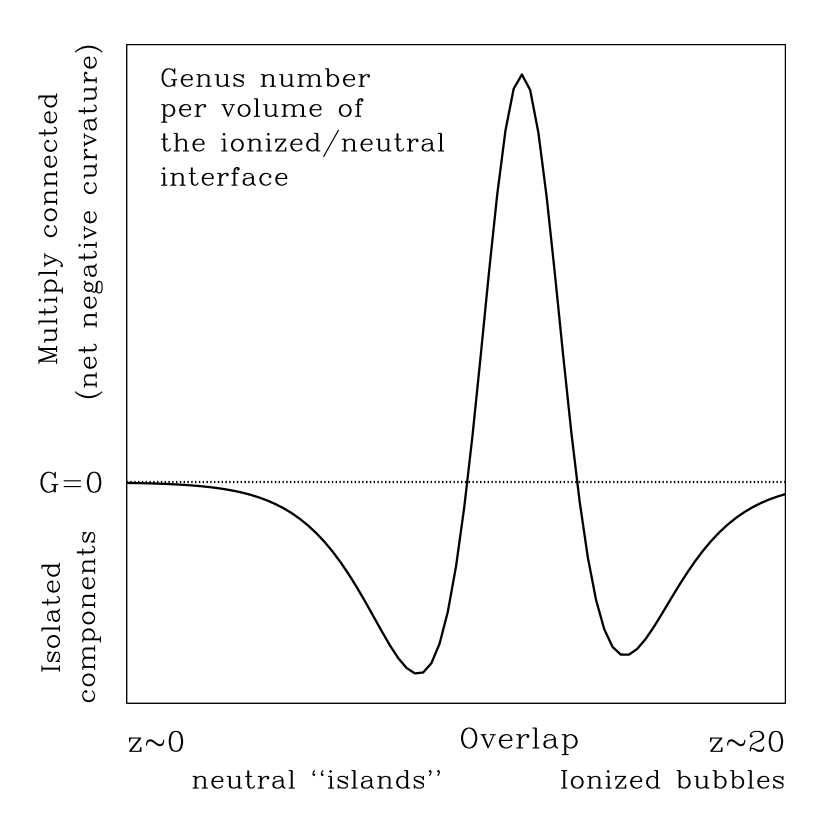
Fortunately, whether reionization proceeds “inside out” or “outside in,” the neutral-ionized interface will approximately follow the cosmic density field. This reduces the problem to the well-studied case of the genus number of the galaxy distribution in the linear (or nearly linear) regime. Because the genus curve of the density field is itself symmetric for gaussian random phase initial conditions, we expect the genus number of the neutral-ionized interface to behave similarly with volume ionized fraction in either scenario. In the central phases of reionization, the 3D genus number of the interface will become positive, reflecting the transition to a multiply-connected topology for both the ionized and neutral phases of the IGM.
The amplitude of the neutral-ionized interface genus number can be estimated from two characteristic lengths: The typical bubble size , and the effective smoothing scale of the observations. For Lyman- galaxy tests, radiative tranfer implies a line-of-sight smoothing with . The requirements discussed in section 3 suggest a comparable smoothing length should be applied in the transverse directions. Then the expected genus number density becomes (see, e.g., eq. 8 of Rhoads, Gott, & Postman 1994). Since modern narrowband surveys with half-degree cameras cover volumes per field, a Lyman- survey of a few contiguous fields should contain enough volume for an interesting measurement of the neutral-ionized interface genus number. If , we would need to substitute for in our estimated genus number density.
A sketch of the expected genus evolution is shown in figure 2. A detailed prediction for the magnitude of the genus number and its evolution with redshift depends on the many unknown details of the reionization process (feedback effects, possible dependence of the escape fraction on galaxy mass, etc), so we do not attempt a detailed analytical treatment here. The best way to make model the genus number in this phase will be genus curve “measurements” in reionization simulations, preferably coupled with a realistic algorithm for assigning Lyman- galaxies to dark matter halos.
5 The 21 cm Line and the Topology of Reionization
The 21 cm emission line from the hyperfine transition of neutral hydrogen offers a complementary probe of ionized region topology. Sufficiently sensitive 21 cm line maps would allow much smaller ionized bubbles to be measured, for two reasons. First, there is no discreteness in the HI emission, unlike the Lyman- emitters, and so there is no corresponding requirement that an identifiable bubble be large enough to contain multiple sources. Second, the typical velocity resolution of radio telescopes is a few km s-1. Bubbles whose expansion velocity is larger than this should be visible to sufficiently sensitive 21 cm mapping. This is much smaller than the minimum bubble expansion velocity scale for the Lyman- test, which may be estimated as (see section 3).
A more fundamental limit to the resolution of 21 cm mapping along the line of sight is set by the peculiar motions of the IGM. The velocities within ionized gas bubbles are not relevant, of course, since the emission comes only from the neutral regions. The velocity in the neutral regions is unlikely to be affected by nongravitational physics at any level much greater than , which is the velocity corresponding to the ionization potential of hydrogen. Gravitationally driven velocities are similarly unlikely to much exceed tens of km s-1 outside virialized halos, which consititute a very small fraction of baryons at the epoch of reionization. Thus, 21 cm mapping could identify bubbles down to at least proper size ( comoving), and probably smaller, provided sensitivity and foreground contamination issues can be overcome.
The primary concern in 21 cm reionization tests is contamination from foreground radio sources and from free-free emission in the ionized bubbles at the epoch of reionization. The best strategy for removing both foregrounds may be mapping in frequency space, because the contaminating signals vary as featureless power laws on velocity scales up to several thousand km s-1. Still, the foregrounds are dramatically brighter than the reionization signals, and exquisite foreground subtraction is needed. Current 21cm experiments (e.g., LOFAR [Falcke et al 2006], the Mileura Widefield Array [MWA; Morales et al 2006], and the Primeval Structure Telescope [PAST; Peterson, Pen, & Wu 2005]) are all aiming first for statistical detections of the 21cm reionization signature, with bubble mapping a possible future step only if radio interference and astronomical foregrounds prove sufficiently tractable.
6 Summary and Future Outlook
The overlap phase of reionization can be defined topologically and sought using a topological statistic, the genus number. By doing so, we can identify the central period of the reionization process. The topological signature of overlap will work whether reionization proceeds from high- to low-density regions or vice versa. Topological tests could be applied using any method that allows mapping ionized and neutral regions during the epoch of reionization. Both 21cm emission from neutral gas and obscuration of Lyman- galaxies by neutral gas could provide such maps. Each tool has its own strengths: The 21cm maps can in principle map smaller bubbles, but difficulties associated with foreground removal will not be fully resolved before the first test data from new experiments becomes available.
We have given particular attention to applications of this test based on mapping the distribution of Lyman- emitting galaxies. For reasonable expectations, the ionized bubbles during overlap will be large enough to permit transmission of Lyman- flux through an otherwise neutral medium. Moreover, the number density of Lyman- emitting galaxies provides a sample of several objects per bubble. Complementary surveys for Lyman break selected galaxies can provide control samples to separate the topological signature of structure formation from that of reionization.
Applications of this test are practical at redshifts up to with CCD cameras, and at least to with the new generation of large format near-infrared detectors now becoming available. Indeed, several surveys for Lyman- galaxies at are already underway. Thus, Lyman- galaxies could well provide our first direct evidence for individual ionized bubbles in the epoch of reionization. Topological tests for the overlap phase would be practical once a contiguous volume corresponding to several bubbles had been mapped.
References
- (1) Benford, D. J., & Lauer, T. R. 2006, in Proc. SPIE v. 6265, p.626528, Space Telescopes and Instrumentation I: Optical, Infrared, and Millimeter, John C. Mather, Howard A. MacEwen, & Mattheus W. de Graauw, Eds.; astro-ph/0608413
- (2) Brown, R., et al 2006, Final Report of an Instrument Concept Study for a Wide-Field Camera for TPF-C, http://sco.stsci.edu/tpf_downloads/WFC_ICS_final_report.pdf
- (3) Cowie, L. L., & Hu, E. M. 1998, AJ, 115, 1319
- (4) Falcke, H., et al 2006, in Highlights of Astronomy, v. 14; astro-ph/0610652
- (5) Fan, X., Narayanan, V. K., Strauss, M. A., White, R. L., Becker, R. H., Pentericci, L., & Rix, H.-W. 2002, AJ 123, 1247
- (6) Furlanetto, S., Zaldarriaga, M., & Hernquist, L. 2004, ApJ 613, 1
- (7) Furlanetto, S. R., & Oh S. P. 2005, MNRAS 363, 1031
- (8) Furlanetto, S., Zaldarriaga, M., & Hernquist, L. 2006 MNRAS 365, 1012
- (9) Furlanetto, S. R., Oh, S. P., & Briggs, F. H. 2006, Physics Reports, 433, 181
- (10) Gnedin, N. Y., & Ostriker, J. P., 1997, ApJ 486, 581
- (11) Gott, J. R., Melott, A. L. & Dickinson, M. 1986, ApJ 306, 341 [GMD]
- (12) Gott, J. R. III, et al 1989, ApJ 340, 625
- (13) Haiman, Z., 2002, ApJ 576, L1
- (14) Hamilton, A. J. S., Gott, J. R., & Weinberg, D. 1986, ApJ 309, 1 [HGW]
- (15) Hamilton, A. J. S., Gott, J. R. III, & Weinberg, D. 1986, ApJ 309, 1
- (16) Iliev, I., Mellema, G., Pen, U.-L., Merz, H., Shapiro, P. R., & Alvarez, M. A. 2006, MNRAS 369, 1625
- (17) Jain, B., & Matsubara, T. 2001, ApJ 522, L89
- (18) Kashikawa, N., et al 2006, ApJ 648, 7
- (19) Kudritzki, R.-P., Mendez, R. H., Feldmeier, J. J., Ciardullo, R., Jacoby, G. H., Freeman, K. C., Arnaboldi, M., Capaccioli, M., Gerhard, O., & Ford, H. C. 2000, ApJ 536, 19
- (20) Kurk, J. D., Cimatti, A., di Serego Alighieri, S., Vernet, J., Daddi, E., Ferrara, A., & Ciardi, B. 2004, A&A422, L13
- (21) Loeb, A. & Rybicki, G. B. 1999, ApJ 524, L527
- (22) Madau, P., Meiksin, A., & Rees, M. J. 1997, ApJ 475, 429
- (23) Malhotra, S., & Rhoads, J. E. 2002 ApJ 565, L71
- (24) Martin, C. L., Sawicki, M., Dressler, A., & McCarthy, P. J. 2006, New Astronomy Reviews 50, 53
- (25) Melott, A. L., Cohen, A. P., Hamilton, A. J. S., Gott, J. R., & Weinberg, D. H. 1989, ApJ 345, 618 [M89]
- (26) Miralda-Escudé, J. 1998, ApJ 501, 15
- (27) Miralda-Escudé, J., & Rees, M. 1998, ApJ 497, 21
- (28) Morales, M., Bowman, J. D., Cappallo, R., Hewitt, J. N., & Lonsdale, C. J. 2006, New Astronomy Reviews, 50, 173
- (29) Ouchi, M. et al. 2001, ApJ, 558, 83
- (30) Peterson, J., Pen, U.-L., & Wu, X.-P. 2005, astro-ph/0502029
- (31) Rhoads, J. E., Gott, J. R. III, & Postman, M. 1994, ApJ 421, 4.
- (32) Rhoads, J. E., Malhotra, S., Dey, A., Stern, D., Spinrad, H., & Jannuzi, B. T. 2000, ApJ 545, L85
- (33) Rhoads, J. E. 2003, “Probing Reionization History with Topological Tests,” at the Zurich conference on “Stars and Structure Formation: From First Light to the Milky Way,” http://www.exp-astro.phys.ethz.ch/ETH_Astro_2003/ Abstracts_as_pdf/rhoads.pdf
- (34) Rhoads, J. E., et al 2005, ApJ 621, 582
- (35) Santos, M. R., Ellis, R. S., Kneib, J.-P., Richard, J., & Kuijken, K. 2004, ApJ 606, 683
- (36) Shaver, P. A., Windhorst, R. A., Madau, P., & de Bruyn, A. G. 1999, A&A 345, 380
- (37) Stark, D., Ellis, R. S., Richard, J., Kneib, J.-P., Smith, G. P., & Santos, M. R. 2007, ApJ 663, 10.
- (38) Tozzi, P., Madau, P., Meiksin, A., & Rees, M. J. 2000, ApJ 528, 597
- (39) van Breukelen, C., Jarvis, M. J., & Venemans, B. P. 2005, MNRAS 359, 895
- (40) Wyithe, S., & Loeb, A. 2005, ApJ 625, 1