Reaction-limited Colloidal Aggregation Induced by Salt and Inert Polymers
Abstract
Salt-induced aggregation of 20 nm colloidal silica is followed by light transmission, which shows an a kinetic form , where and is an empirical time constant which reflects the colloidal stability. We found a power law dependence of on ionic strength, which can be explained by the classical DLVO theory. The neutral polymers polyethylene glycol (PEG) accelerate the aggregation rate, and those with higher molecular weight are more effective in inducing the aggregation with similar stretched exponential form of kinetics. Current theories of polymer-mediated interactions provide a reasonable interpretation of the effect of PEG. The stretched exponential kinetics of the light transmission is found to be consistent with a cluster-size dynamic scaling model of aggregation.
pacs:
64.70.Nd, 64.75.+g, 82.70.Dd, 87.64.CcI Introduction
If a particle in solution is small enough, the gravitational potential energy over a macroscopic length is less than the thermal energy. Such colloidal particles distribute themselves evenly in a vial by thermal diffusion. If the colloid were to have no surface charge, the particles would collide, stick together, and eventually deposit at the bottom of the vial. Adequately charged colloidal particles repel each other and stay in suspension essentially forever. This property of colloidal stability is of immense practical relevance to real world materials such as food, adhesives, cosmetics, inks, and paints. The silica nanoparticle is of longstanding technological significance Alexander (1967) and in a sense is the ancestor of the modern nanoparticle. Today it has uses ranging from chemical-mechanical polishing of silicon wafers to serving as a DNA carrier in non-viral transfection Luo and Saltzman (2006).
Colloidal silica aggregates with the addition of salt, which lowers the particle surface potential and Debye screening length. The presence of a non-adsorbing polymer can also induce aggregation. This is understood as a ”depletion force”, ”entropic force”, or ”molecular crowding” generated by a contest for space between the colloid and the free polymer. Asakura and Oosawa (AO) Asakura and Oosawa (1954); Barrat and Hansen (2003) were the first to interpret this simple physical concept. Further theoretical progress has been made over the past decades, including those using the methods of integral equation theory Fuchs and Schweizer (2002) and the scaling/renormalization approach deGennes (1979); Schäfer (1999); Tuinier et al. (2002); Tuinier and Lekkerkerker (2001).
Here we study the destabilization of colloidal silica by both monovalent salt and the polymer PEG. We should mention here that PEG is also of ascending importance in the science of biomaterials. In enzymology, it has been used to study hydration effects, steric hindrance, and molecular crowding. When covalently bound to a surface it serves as a biocompatible passivation layer.
Charged colloidal particles in saline solution are typically modeled as bodies with repulsive (stabilizing) Coulomb interactions and attractive short-range dispersion forces, an approximation known as the classical Derjaguin, Landau, Verwey and Overbeek (DLVO) theory Verwey and Overbeek (1948); Israelachvili (1985). The electrostatic potential is modeled by the Poisson-Boltzmann (PB) equation, which describes the relation between charge density and electrical potential, under the assumption that the saline ionic charges deviate from their bulk concentration according to Boltzmann’s law. For moderately charged spherical particles, the external electrostatic potential is of the form , where is the Debye screening length. In a monovalent salt solution, where is the solution dielectric constant and the number concentration of salt. In aqueous 1 M monovalent salt solution, for example, . Increasing ionic strength also lowers the particle surface potential . These two factors combine to decrease the electrostatic interaction potential and hence lower the stability of a colloidal suspension.
Attractive dispersion forces are the result of induced dipole-dipole interactions; these are responsible for the irreversible binding in aggregation. For two volume elements of material the interaction force is proportional to where is the Hammaker constant. The resulting potential is also called the van der Waals potential . The total interaction is then .
With increased ionic strength the colloidal particles undergo irreversible formation of larger and larger clusters, a process known as aggregation. It has been shown Broide and Cohen (1990); Lin et al. (1990) that the cluster kinetics, size distribution as a function of time, and cluster fractal dimension fall into two universal classes: diffusion limited aggregation (DLA) and reaction limited aggregation (RLA). In RLA single particles and clusters collide many times before joining together irreversibly. In the DLA limit, particles and clusters aggregate the first time they collide, so particle diffusion limits the rate of aggregation. The clusters generated in these two regimes have different qualitative appearance; the fractal dimension of DLA particles is and for RLA Broide and Cohen (1990); Lin et al. (1990); Barrat and Hansen (2003). These two classes also exhibit different time evolution scaling laws in cluster-size distribution Lin et al. (1990); Broide and Cohen (1990). Cluster growth had been experimentally observed for quite some time Enüstün and Turkevich (1963), but did not have the benefit of a modern conceptual framework.
As the clusters have fractal dimension less than 3, it is possible for a small concentration of particles to span the sample volume. The cluster radius of gyration where is the monomer radius and is the number of particles in the cluster. As the bulk monomer density approaches the cluster particle density , the clusters in effect span the sample volume.
There are similarities and differences between aggregation and a second-order phase transition. As the process of aggregation proceeds, the particle size becomes larger and larger. In a second-order phase transition, the correlation length (analogous to cluster size) diverges, but the correlations are dynamic, in that particles are free to leave and rejoin large clusters, whereas in aggregation the particles irreversibly join a cluster. A salient feature of increasing cluster size is increasing light scattering. The scattered light for Barrat and Hansen (2003) where is the scattering wave vector related to the scattering angle. The total scattered light ( integrated over ) determines the turbidity of the sample, and it has been used to characterize the correlation length at the critical region in colloid-polymer phase separation Chen et al. (2001).
The surface of silica in basic aqueous solution is negatively charged. Silica reacts with water to create silanol surface groups Iler (1979). At a high pH, protons are pulled from the surface, leaving negatively charged silane groups , thereby lending colloidal stability.
A table-top example of the above concepts is provided by a 4 % w/w solution of 20 nm colloidal silica at pH 10. As the monovalent salt KCl is increased past 200 mM, the colloidal particle surface potential and electrostatic screening length decrease, and the silica particles begin to combine into larger and larger clusters. As a result, the turbidity (light scattering) progressively increases. In the presence of PEG, the turbidity occurs more readily. We elaborate on this simple demonstration to further our understanding of colloidal stability and polymer-mediated interactions.
The rest of this paper is as follows. We first continue with a more detailed account of the necessary theoretical background. After a description of the experimental materials and methods, the data is presented and interpreted in terms of DLVO theory and the two-particle Smoluchowski equation, the depletion force, and the dynamics of cluster-size distribution in the RLA limit.
II Theoretical background
II.1 The surface charge of colloidal silica
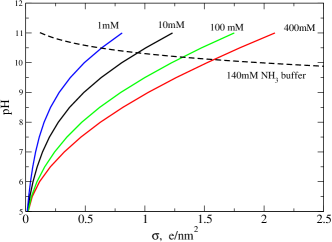
Acid titration data of colloidal silica provides some surprising details about the nature of its surface G.H.Bolt (1957); Kobayashi et al. (2005). The results can be qualitatively explained as follows: At increased pH, the chemical potential of the solution proton gas is lower, and the silica surface protons are able to enter the solution, leaving behind a more negatively charged surface. With increasing ionic strength, the electrostatic potential for a given surface charge is less, so the particle can assume more charge for a given pH. The relationship between surface charge, surface potential, and ionic strength is explained with the PB equation. However, it does not explain the titration data. By proposing a surface capacitance, the Stern model is successful in modeling the titration data. The details of this calculation are in Appendix A. In Fig. 1 we present the results of this calculation for a solution of 4 % w/w 20 nm silica with 140 mM ammonia buffer. It should be emphasized that this family of curves accurately models the experimental titration data G.H.Bolt (1957); Kobayashi et al. (2005) for colloidal silica. The success of the Stern model in explaining this titration data lends confidence that we know reasonable values for the surface charge density.
II.2 Two-particle interactions
The two-particle interaction is modeled with a electrostatic repulsion and a short-range dispersion attraction, and the polymer-mediated interaction is treated as an AO depletion attraction.
We use estimates of the two-particle electrostatic interaction based on linear superposition approximations Sader et al. (1995); Russell et al. (1989):
| (1) |
where is the particle radius, is the particle center-to-center separation and h is the surface-to-surface separation . is the electrostatic potential at the particle-solution interface. An essentially identical interaction is obtained following the work of Behrens and Grier Behrens and Grier (2001). In the Appendix it is shown how to obtain the surface charge density and hence from given pH and ionic strength.
For two spherical particles, the van der Waals attraction potential is where is the Hammaker constant Verwey and Overbeek (1948). This formula results from the integration of the force described in the Introduction.
For we use the results of the PRISM theory according to Fuchs and Schweitzer Fuchs and Schweizer (2002)
| (2) |
where . is the polymer mesh length or equivalently the polymer density-density correlation Fuchs and Schweizer (2002). In the dilute limit it is the Gaussian radius . We use radius of gyration values for 35 kD PEG and for 4 kD PEG. marks the semidilute polymer concentration where the molecules begin to overlap, i.e. . We use values of 0.92 % w/w and 5.25 % w/w respectively.
II.3 Aggregation and the Smoluchowski equation
The aggregation of colloidal particles is a stochastic process. For a spherically symmetric configuration the Smoluchowski equation Verwey and Overbeek (1948); Russell et al. (1989) provides a continuum description of net flux of two particles:
| (3) |
where is the center-to-center particle separation, is the particle density, is the diffusion constant, and is the particle-particle interaction potential. This equation is of the form and can be solved by using the integrating factor . The boundary conditions are and . That is, the particles fall into a sink when they touch, and at a large separation the particle density is the bulk value. Assuming the quasi-equilibrium condition of constant , the specific solution is Verwey and Overbeek (1948)
| (4) |
Here is an arbitrary cutoff value to cope with divergence of at .
II.4 Cluster size population kinetics
Given the high ratio between the observed time scale of turbidity and the Brownian collision time of 4 % w/w silica particles, Verwey and Overbeek (1948), the cluster growth under consideration is certainly RLA.
In the most general scheme, both RLA and DLA cluster size population kinetics can be characterized by dynamic scaling: where is the fraction of clusters of size , and is an increasing cluster size characteristic of the system at a given time Family (1986); Leyvraz (1986), where is time scaled by the the initial monomer-monomer aggregation rate. The RLA cluster size dynamics is known to have a power law distribution described by the following three equations Leyvraz (1986); Broide and Cohen (1990); Thorn and Seesselberg (1994):
| (5) |
| (6) |
| (7) |
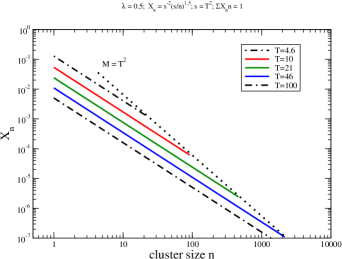
Eqn. (5) is the constraint of mass conservation. represents the number of particles in the biggest cluster of the entire system; it evolves in time according to Eqn. (6). The third equation shows that depends on in a power-law fashion with the characteristic exponent . The scaling exponent unites the evolution of both and the the size limit . is chosen to satisfy mass conservation. Given a power law distribution of , the continuum integral shows that ; it can also be seen that is proportional to the cluster size. This is summarized graphically in Fig. 2 for . Eqns. (7) and (6) can be derived from a scaling approach to the cluster aggregation process Leyvraz (1986).
II.5 Light scattered by a fractal cluster
For an individual cluster of size the total scattered light of wavelength is
| (8) |
where is scattering structure factor Ferri et al. (1988); Fisher and Burford (1967) and the scattering vector . For a cluster of fractal dimension Ferri et al. (1988); Schaefer et al. (1984); Fisher and Burford (1967); Sorensen and Wang (1999)
| (9) |
Thus the total scattering increases and the low angle scattering becomes greater as the cluster size becomes larger.
The normalized scattered light from a volume element of sample (the turbidity) would then be
| (10) |
where is a constant Ferri et al. (1988). The spacial derivative of the light intensity , thus the transmitted light follows a Beer’s Law behavior, for arbitrary .
III Materials and Methods
In order to follow the aggregation of many samples of colloidal silica over a long time course, a carrousel was constructed to carry up to 32 standard 3 mL plastic sample cuvettes with a 1 cm optical path length. One cuvette served as the water reference. An incandescent bulb served at the measuring light source. Light was collected with a lens and focused into a pencil which passed through the rotating cuvettes. The transmitted light was detected with a photodiode; a slit in front of this photodetector made a 30 mrad angle of acceptance. A picoammeter recorded the photodiode current and was interfaced with a personal computer. The computer also controlled the rotation of the carrousel, allowing the light transmission to be recorded for a chosen time schedule. Temperature was controlled to be slightly above ambient, 30∘C. 20 nm colloidal silica was purchased from Alfa-Aesar (stock number 12727). PEG (Sigma 03557 and Alfa-Aesar A16151) was used as received from the vendors. Chemicals were of reagent grade.
To initiate aggregation, 3M KCl was introduced by slow addition (0.1 mL/min) with a syringe pump to the 3 mL volume of silica while being throughly mixed with a magnetically driven stirring propeller. A glass test tube of 1 cm inside diameter was used to contain the solution while mixing. The solution was then transfered to a plastic cuvette and capped with tape. 140 mM ammonia was used as the buffer for both the silica solution and the 3M KCl stock solution. Silica concentration was 4 % w/w. By investigating slow aggregation, practical concerns about the exact initial conditions and the mixing process were minimized. The samples were never mechanically disturbed or shaken after the initial mixing. When PEG was part of the solution, it was added before the salt.
A table-top demonstration of the acceleration of aggregation by PEG can be done by 1:1 v/v mixing of 4 % w/w silica with 20 % w/w 35 kD PEG. Both solutions have 200 mM KCl and 140 mM ammonia buffer. This silica suspension is undergoing aggregation, but very slowly. By layering a lighter PEG solution on top of a denser silica solution, a whitish band of rapidly aggregating silica is observed at the interface.
The diffusion constant, which is inversely proportional to viscosity, plays a role in the Smoluchowski model of aggregation. Viscosity data is available for 2 kD to 6 kD PEG in the literature Bhat and Timasheff (1992), but the range of concentrations measured do not extend into the semidilute deGennes (1979) regime . Because our measurements extended into this concentration range for 35 kD PEG, whose semidilute concentration starts at about 0.9 % w/w, the specific viscosities for PEG 4 kD and 35 kD PEG were measured. Viscosity measurements were performed with a 30 gauge stainless steel flow tube at 25∘C. Water, 23 % w/w sucrose, and 46 % w/w sucrose served as calibration standards. Our results are consistent with the published data Bhat and Timasheff (1992). There was no change in the quadratic trend of the specific viscosity for concentration of 35 kD PEG in the range 0 to 4.5 % w/w. The relative viscosity for 35 kD can be fit with and 4 kD PEG with the equation where is the % w/w concentration in the range 0 to 4.5 %.
The radially symmetric PB equation was numerically integrated as previously described Hosek and Tang (2004). The solutions were found to agree with Eqn. (14) for relevant values of pH and surface charge. The routines D01GAF and D01AJF from The Numerical Algorithms Group (http://www.nag.co.uk/, Oxford UK) were used to perform numerical integrations.
IV Results
IV.1 Ionic strength and aggregation kinetics
Fig. 3 presents a data set illustrating the effects of ionic strength on the aggregation kinetics of 20 nm silica. Each time course of the light transmission is empirically described with the function .
![[Uncaptioned image]](/html/0708.2919/assets/x3.png)
![[Uncaptioned image]](/html/0708.2919/assets/x5.png)
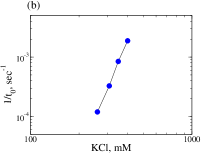
We use the salt-induced aggregation time courses, shown in Fig. 3(a), as a means to evaluate our understanding of the interaction . A log representation of the dependence of on ionic strength (Fig. 3(b)) demonstrates a power law with an exponent value of 6.5. Such a power-law relationship has been known for some time to exist over a limited range of salt concentration and is explained by the DLVO theory Verwey and Overbeek (1948).
Eqn. (4) predicts the initial rate of dimer formation to be a function of . We do observe a quadratic dependence of on silica concentration (data not shown).
IV.2 Polymer-mediated interaction
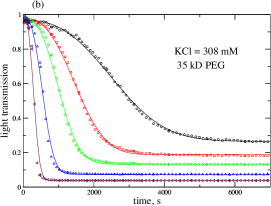
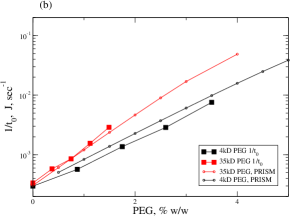
By setting the aggregation rate at a practical value with ionic strength, we can evaluate polymer-mediated effects. In Fig. 4(a) and (b) we demonstrate the faster development of turbidity caused by 4 kD and 35 kD PEG, respectively. Notably, the stretched exponential power term is preserved for all polymer concentrations. However, the final turbidity increases with increasing polymer concentration, whereas the final turbidity for the salt-only data is almost constant. Clearly 35 kD PEG is more effective than 4 kD PEG in accelerating aggregation.
V discussion
V.1 Kinetics and the two-particle interaction
As the integrand in Eqn. (4) is of the form , it is expected that the electrostatic interaction will have a strong effect on the aggregation rate. The dramatic effect of scaling the interaction by a constant is seen in Fig. 5(a). It is found empirically that an adjusted interaction
| (11) |
demonstrates a reasonable agreement with the values of Fig. 3(b). These numerical integrations of Eqn. (4) use the interaction potential , with based on the values for derived from Fig. 1. A cutoff value nm was used in Eqn. (4) as diverges at . We use a Hammaker constant , which is close to the commonly accepted Hammaker constant for silica particles in water of Israelachvili (1985).
The depletion interactions predicted by the PRISM integral equation theory were added to , and the resulting compared with the experimental values of from Fig. 4. Calculations were also performed using the the RG theory according to Tuinier et al.Tuinier et al. (2002). Similar results were obtained (not shown).
Both the RG and PRISM theories seem to overestimate the interaction. The experimental results may be matched by using 0.6 as a constant scaling factor. In summary
| (12) |
| (13) |
where is numerically obtained from Eqn. (4). The effective rate of aggregation includes a factor of the relative viscosity, which is a function of the PEG concentration. In Fig. 4(b) there is a rough agreement between the calculated aggregation rate and the measurement.
Because there is no indication of Kramer inversion Barrat and Hansen (2003) we believe that using macroscopic relative viscosity on the microscopic scale is proper.
![[Uncaptioned image]](/html/0708.2919/assets/x7.png)
V.2 Origin of the stretched exponential
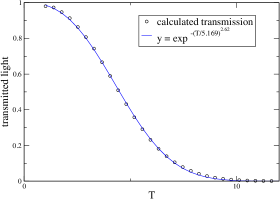
The stretched exponential decay of light transmission
can be explained by combining the analysis of parts C and D.
Numerical evaluation of , Eqn. (10),
with limits of integration ,
, , and ,
with the cluster size distribution
of Eqns. (5), (7), and (6)
yields the light transmission ,
This calculation, shown in Fig. 6,
closely resembles a stretched exponential form with
quite well.
Various stretched exponentials may be obtained
from different values of and (Table 1). We find the
kinetics of light transmission is set primarily by , not .
This can be understood by evaluation of the term in Eqn.(10).
This integral is much more sensitive to than , and the distribution of
is set by .
| - | - | ||
| - | - | ||
The calculations indicate zero light transmission as the aggregation proceeds, whereas the data, especially the salt-only data, show a limit in turbidity even after gelation is reached. This is certainly diffusion of photons in the medium Durian (1994) which we do not take into account.
We have used three time scales here. is the empirical fitting parameter for the measured light transmission; is the dimensionless time of the dynamic cluster growth model; and then is the dimer formation time scale from the DLVO/Smoluchowski theory. Simulation Thorn and Seesselberg (1994) as well as numerical evaluation of the scaling model (Eqns. (5)-(6)) indicates , i.e., the time scale of dimer formation is basically . So we can reasonably conclude . The extreme sensitivity of to the two-particle interaction potential (as seen in Fig. 5) implies a rough accuracy in time scale is adequate to characterize the physics, so we can treat and as the same.
V.3 Polymer effects and
For salt-induced aggregation (Fig. 3) it appears the process is primarily characterized by . Presumably the geometry of the aggregation (the cluster distribution and fractal dimension) at a given turbidity is the same for all ionic strengths; the ionic strength is simply setting the rate at which the process is played out. The nearly constant final turbidity implies the sample is proceeding to one common state regardless of salt concentration.
The effect of PEG is more complex. Whereas salt-induced aggregation has only a small difference in turbidity at long time (Fig. 3), PEG-induced aggregation shows increased final turbidity with increased PEG concentration (Fig. 4). But remarkably the interplay of and seems to preserve the time-scaling of the turbidity. According to Ball et al.Ball et al. (1987), is stabilized by the adjustment of . To paraphrase: Imagine an increase in , which leads to relatively more small clusters, as stated in Eqn. (7). These smaller clusters interpenetrate the larger clusters, which combine to form more compact objects of higher . The resulting decrease in available surface area slows the growth, i.e., decreases , which is consistent with Eqn. (6).
V.4 Flavors of RLA
Experimentally has been found with very small colloid volume fractions, but with low colloidal stability set by either divalent ions or high concentration of NaCl Lin et al. (1990); Broide and Cohen (1990). In these experiments, clusters seldom meet, but combine when they do meet. In our case, and in other experiments Rarity et al. (1989); Sorensen and Wang (1999), NaCl is about 100 mM, so clusters can meet many times before combining, and we find . Two flavors of RLA are consistent with the analysis of Meakin and Family Meakin and Family (1988).
It should be noted that 20 nm silica particles have a ”hairy” nature presumably due to dangling poly(silicilic acid) chains on the surface Kobayashi et al. (2005). Larger silica particles are seen to be ”harder” and aggregates formed from such particles show a well-defined particle morphology Kobayashi et al. (2005). One might expect these smaller silica particles to form ”large floppy clusters” Meakin and Family (1988) which have .
VI conclusions
To our knowledge this is the first study to combine the classical DLVO interpretation of colloidal stability with cluster-size dynamic scaling to further understanding of the AO depletion interaction.
We are able to explain both the stretched exponential nature of the light transmission data and the AO depletion interaction by qualitative adaption of current theories.
VII Acknowlegements
We wish to thank Prof. John Carini for helpful comments.
Appendix A The Stern Model
Here we explain in detail a model which explains the titration data of colloidal silica as typified by Fig. 1. It combines the PB theory of electrolyte solutions, the Stern theory of surface capacitance, and the lattice model of the silica surface.
In a solution of monovalent salt of concentration , the electrostatic potential surrounding a body with surface charge can be found by integrating the PB equation:
with the boundary conditions and . By solving this equation, we can find the surface charge as a function of surface potential , particle radius , and Debye screening length Behrens and Grier (2001):
| (14) | |||
Because monotonically increases with , we can also readily obtain .
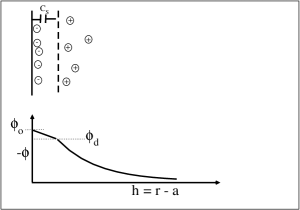
Without specifying an exact physical mechanism, the Stern model proposes a capacitance between the inner charged layer and the solution phase. The potential of the surface charge is then
| (15) |
is the apparent surface potential experienced by the surrounding solution; is the potential of the charged surface groups.
We find it instructive to write the free energy for one silica sphere in equilibrium with an ideal gas of protons in solution Yu and Carlsson (2003):
| (16) | ||||
where there are sites on the silica surface; is the number of bound protons forming silanol (SiOH) sites. The successive terms are: the electrostatic charging energy; the binding energy for protons, each forming a silanol group; the configuration entropy for indistinguishable protons distributed on possible surface sites; and lastly, protons in solution are treated as an ideal gas of volume . This is simply Langmuir adsorbtion with an electrostatic term. is clearly a function of , and by minimizing we find the surface charge .
This Stern model, with free parameters density of surface sites , proton binding energy , and surface capacitance , is quite effective in explaining the pH titration data of colloidal silica particles for varying monovalent ionic strength G.H.Bolt (1957); Kobayashi et al. (2005). The results shown in Fig. 1 represent the titration curves for several monovalent ionic strengths obtained by numerically minimizing using the accepted values of , pK, and G.H.Bolt (1957); Kobayashi et al. (2005).
The energetics of the silica charged surface is typically dealt with in terms of chemical potential Behrens and Grier (2001). At equilibrium, the chemical potentials of a proton in the gas (solution) phase and a proton on the silica surface are identical, or equivalently . Also, the practical terms and are normally employed, hence the term ”one-pK Stern model.”
In summary, for the given pH and
ionic strength ,
we can use the Stern model to find and in turn
calculate the particle-particle electrostatic interaction
of Eqn. (1).
References
- Alexander (1967) G. Alexander, Silica and Me: the Career of an Industrial Chemist (Doubleday, Garden City, N.Y., 1967).
- Luo and Saltzman (2006) D. Luo and W. M. Saltzman, Gene Therapy 13, 585 (2006).
- Asakura and Oosawa (1954) S. Asakura and F. Oosawa, J. Chem. Phys. 22, 1255 (1954).
- Barrat and Hansen (2003) J.-L. Barrat and J.-P. Hansen, Basic Concepts for Simple and Complex Liquids (Cambridge University Press, Cambridge, U.K. ; New York, 2003).
- Fuchs and Schweizer (2002) M. Fuchs and K. S. Schweizer, Journal of Physics: Condensed Matter 14, R239 (2002).
- deGennes (1979) P. deGennes, Scaling Concepts in Polymer Physics (Cornell University, Ithaca, 1979).
- Schäfer (1999) L. Schäfer, Excluded Volume Effects in Polymer Solutions (Springer Verlag, Berlin, 1999).
- Tuinier et al. (2002) R. Tuinier, H. N. W. Lekkerkerker, and D. G. A. L. Aarts, Phys. Rev. E 65, 060801 (2002).
- Tuinier and Lekkerkerker (2001) R. Tuinier and H. Lekkerkerker, Eur. Phys. J. E 6, 129 (2001).
- Verwey and Overbeek (1948) E. J. W. Verwey and J. T. G. Overbeek, Theory of the Stability of Lyophobic Colloids (Elsevier, Amsterdam, 1948).
- Israelachvili (1985) J. Israelachvili, Intermolecular and Surface Forces (Academic Press, 1985).
- Broide and Cohen (1990) M. L. Broide and R. J. Cohen, Phys. Rev. Lett. 64, 2026 (1990).
- Lin et al. (1990) M. Y. Lin, H. M. Lindsay, D. A. Weitz, R. C. Ball, R. Klein, and P. Meakin, Phys. Rev. A 41, 2005 (1990).
- Enüstün and Turkevich (1963) B. V. Enüstün and J. Turkevich, J. Am. Chem. Soc. 85, 3317 (1963).
- Chen et al. (2001) B.-H. Chen, B. Payandeh, and M. Robert, Phys. Rev. E 64, 042401 (2001).
- Iler (1979) R. Iler, The Chemistry of Silica (John Wiley:New York, 1979).
- G.H.Bolt (1957) G.H.Bolt, J. Phys. Chem. 61, 1166 (1957).
- Kobayashi et al. (2005) M. Kobayashi, F. Juillerat, P. Galletto, P. Bowen, and M. Borkovec, Langmuir 21, 5761 (2005).
- Sader et al. (1995) J. E. Sader, C. L. Carnie, and D. Y. C. Chan, Journal of Colloid and Interface Science 171, 46 (1995).
- Russell et al. (1989) W. B. Russell, D. A. Saville, and W. R. Showalter, Colloidal Dispersions (Cambridge University Press, Cambridge, England, 1989).
- Behrens and Grier (2001) S. H. Behrens and D. G. Grier, J. Chem. Phys. 115, 6716 (2001).
- Family (1986) F. Family, in On Growth and Form: Fractal and Non-Fractal Patterns in Physics, edited by H. Stanley and N. Ostrowsky (Nijhoff, Dordrecht, 1986), pp. 231–236.
- Leyvraz (1986) F. Leyvraz, in On Growth and Form: Fractal and Non-Fractal Patterns in Physics, edited by H. Stanley and N. Ostrowsky (Nijhoff, Dordrecht, 1986), pp. 136–144.
- Thorn and Seesselberg (1994) M. Thorn and M. Seesselberg, Phys. Rev. Lett. 72, 3622 (1994).
- González (1993) A. E. González, Phys. Rev. Lett. 71, 2248 (1993).
- Meakin and Family (1988) P. Meakin and F. Family, Phys. Rev. A 38, 2110 (1988).
- Rarity et al. (1989) J. G. Rarity, R. N. Seabrook, R. J. G. Carr, and D. A. Weitz, Proceedings of the Royal Society of London. Series A, Mathematical and Physical Sciences 423, 89 (1989).
- Schaefer et al. (1984) D. W. Schaefer, J. E. Martin, P. Wiltzius, and D. S. Cannell, Phys. Rev. Lett. 52, 2371 (1984).
- Ferri et al. (1988) F. Ferri, M. Giglio, E. Paganini, and U. Perini, Europhysics Letters 7, 599 (1988).
- Fisher and Burford (1967) M. E. Fisher and R. J. Burford, Phys. Rev. 156, 583 (1967).
- Sorensen and Wang (1999) C. M. Sorensen and G. M. Wang, Phys. Rev. E 60, 7143 (1999).
- Bhat and Timasheff (1992) R. Bhat and S. Timasheff, Protein Sci. 1 (9), 1133 (1992).
- Hosek and Tang (2004) M. Hosek and J. X. Tang, Phys. Rev. E 69, 051907 (2004).
- Durian (1994) D. J. Durian, Phys. Rev. E 50, 857 (1994).
- Ball et al. (1987) R. C. Ball, D. A. Weitz, T. A. Witten, and F. Leyvraz, Phys. Rev. Lett. 58, 274 (1987).
- Yu and Carlsson (2003) X. Yu and A. E. Carlsson, Biophys. J. 85, 3532 (2003).