Recombination fluorescence in ultracold neutral plasmas
Abstract
We present the first measurements and simulations of recombination fluorescence in ultracold neutral plasmas. In contrast with previous work, experiment and simulation are in significant disagreement. Comparison with a recombination model suggests that the disagreement could be due to the high energy portion of the electron energy distribution or to large energy changes in electron/Rydberg scattering. Recombination fluorescence opens a new diagnostic window in ultracold plasmas because it probes the deeply-bound Rydberg levels, which depend critically on electron energetics.
pacs:
34.80.Lx, 52.27.Gr, 52.27.CmUltracold neutral plasmas can provide new insights into relaxation phenomena in strongly coupled Coulomb systems. They are created by photoionizing laser cooled atoms and therefore have very precisely controlled initial temperatures and densities Killian et al. (1999); Simien et al. (2004); Cummings et al. (2005a); Killian (2007). Photoionization causes an impulsive hardening of the interparticle potential Murillo (2006), and the pathway to (non)equilibrium can be studied in detail Pohl et al. (2005); Pohl and Pattard (2006).
The electron system equilibrates on the shortest time scales and largely determines how the plasma expands Kuzmin and O’Neil (2002a); Robicheaux and Hanson (2002); Mazevet et al. (2002); Pohl et al. (2004); Fletcher et al. (2006). Indirect measurements of the electron temperature agree well with simulations Robicheaux and Hanson (2002); Roberts et al. (2004); Gupta et al. (2007). Disorder-induced heating, three body recombination (TBR), and electron/Rydberg scattering are important heating mechanisms in the plasma. The latter two are thought to occur on times that are long compared to the electron plasma frequency. Thus TBR can probe the electron system at early times in the plasma evolution after disorder-induced heating has occurred Fletcher et al. .
In higher temperature plasmas, the TBR picture is an electron and ion colliding in the presence of another electron. The TRB rate is the two-body collision frequency () multiplied by the probability that a third body is one collision distance away (). The collision distance and cross section depend on the electron temperature ( and ), giving the well-known TBR rate , where is the TBR rate coefficient for (2002).
In a strongly-coupled system, this binary collision picture breaks down. When the nearest-neighbor potential energy exceeds the kinetic energy (), the plasma is strongly coupled. The average distance between electrons becomes comparable to the collision distance . The electrons are in a constant collision and TBR becomes, in a sense, many-body recombination. A numerical simulation of early-time recombination suggest that even moderate initial coupling in the electron system changes the recombination rate by perhaps a factor of two Kuzmin and O’Neil (2002b). Other theoretical treatments suggest larger changes Hahn (1997, 2000). However, there is no experimental evidence that TBR departs from the standard formulas com .
In this paper we present a new study of three-body recombination in ultracold neutral plasmas. We measure the time-dependent fluorescence emitted by the plasma following electron/ion recombination for a range of initial plasma densities and electron temperatures. The fluorescence signal is the end result TBR, electron-Rydberg collision, and radiative cascade. Thus, it is sensitive to the details of the evolving electron system. We compare these results with a numerical simulation and find significant disagreement. A recombination model suggests that this is related to the high-energy portion of the electron energy distribution or to large energy changes in electron/Rydberg scattering.
Our ultracold plasmas are created by photoionizing laser-cooled calcium atoms in a magneto-optical trap Cummings et al. (2005a, b). The plasma density profile is approximately Gaussian and spherically symmetric with the density and mm. The initial ion temperature is equal to the neutral atom temperature (1 mK). The initial electron energy is equal to the difference between the photoionization laser photon energy and the atomic ionization energy. The lower limit is set by the laser bandwidth and by continuum lowering effects to approximately K. Our two-step photo-ionization process ionizes nearly 100% of the atoms in the MOT, and our maximum plasma density is set by the MOT density to cm-3.
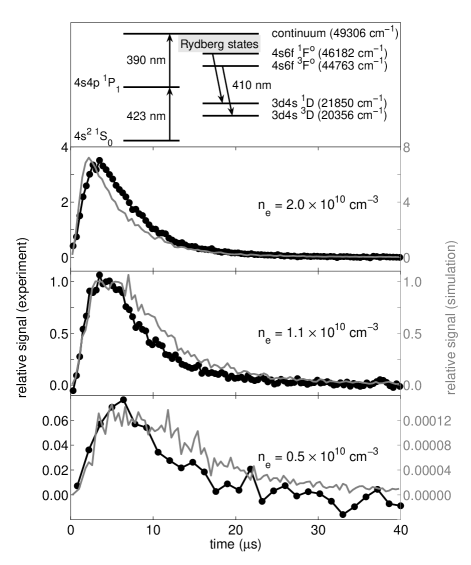
Fluorescence from the plasma is collected by a fast lens system and detected using a PMT. An interference filter blocks light from the lasers and the MOT. Most of the fluorescence results from emission at 410 nm. A typical fluorescence signal and partial energy level diagram are shown in Fig. 1. At early times, the fluorescence signal grows as recombination proceeds. After a few s the plasma expands and the density decreases. The fluorescence signal falls as recombination slows down and the plasma moves out of the view of the fluorescence collection optics.
The fluorescence signal is the end product of a series of collision events Robicheaux (2004). Free plasma electrons and recombined Rydberg atoms are in a quasi-equilibrium. Collisions form and then ionize Rydberg atoms, most of which have a binding energy roughly equal to . This collisional equilibrium gives rise the so-called “thermal bottleneck,” which is a minimum in the Rydberg state distribution near Kuzmin and O’Neil (2002b). A collision occasionally occurs that puts the atom in a Rydberg state below the bottleneck. Additional collisions and radiative cascades move a fraction of these atoms into the fluorescing state.
We have performed a numerical simulation of recombination and fluorescence in the plasma using a method similar to Refs. Robicheaux and Hanson (2002, 2003). Like the experiment, we assume the plasma to be nearly charge neutral with a spherically symmetric Gaussian density distribution. The electrons are in thermal equilibrium at a temperature . The plasma expands self-similarly, and the density can be written as . The equations of motion at this level of approximation are described in Sec. IIIc of Ref. Robicheaux and Hanson (2003). The main trends are that the expansion decreases the thermal energy of the electrons while increasing the radial speed of the ions. When recombination occurs, the density decreases slightly and the temperature increases. An electron collision with an atom that decreases the atom’s energy increases the electron temperature and vice versa.
We compute the evolution of the atom population using a Monte Carlo technique. During a time step, we compute the probability of formation of an atom at each position and which state it is in using the method of Sec. IV of Ref. Robicheaux and Hanson (2003). The method gives more atoms formed at the center of the plasma where the density is high and the atoms are mostly formed in high Rydberg states Pajek and Schuch (1997, 1999). The radial velocity of the atom is taken to be the radial velocity of an ion at the position the atom is formed; after the atom is formed, we track its position and velocity so we know the correct electron density near each atom and we know whether the atom is within the detection region when the photon is emitted. After the atom is formed, its state changes due to electron collisions and radiative decay. The electron collisions can reionize the atom, excite it to higher energies, or de-excite it. The electron collision processes are computed with a Monte Carlo technique using the rates of Ref. Mansbach and Keck (1969). One difference with Ref. Robicheaux and Hanson (2003) is that we used the exact radiative decay rates for for . We did this because the states are not necessarily statistically mixed for lower and the fluorescence signal depends on getting the cascade correct. When an atom’s principle quantum number drops below 5 it is counted as a fluorescence photon and removed from the simulation. The calculation has only one free parameter related to the location of the thermal bottleneck. The formulas in Refs. Pajek and Schuch (1997, 1999) lead to a bottleneck at . Changing this value changes the shape of the fluorescence curves somewhat because the details of the fluorescence signal depend on the high energy portion of the electron distribution. However, there was no choice for the bottleneck that allowed us to reproduce all of the measurements.
The simulation and experiment are compared in the lower three panels of Fig. 1. In these data, the initial electron temperature is , and the initial plasma size is mm. Qualitatively, the simulation and experiment are in reasonable agreement. For the lower two densities, the rising edge of the simulation and experiment have the same time dependence. However, there are quantitative mismatches. The relative change in signal strength with density is completely different for the simulation and experiment. In addition, the time dependence of the high density simulation does not match the experiment.
This disagreement is surprising. Previous work has demonstrated good agreement between this simulation and the experiment. This simulation and related approaches give the proper plasma expansion velocity, electron temperature, and even the high Rydberg state distribution. However, recombination fluorescence opens a new window in these ultracold plasmas because it probes the deeply-bound Rydberg levels. The population in these levels depends critically on the high-energy portion of the electron distribution.
Some insight can be gained by comparing to a simple rate equation model. The rate at which Rydberg atoms are formed in the plasma can be written as
| (1) |
where is the collisioinal ionization rate, is the three-body recombination rate coefficient, is the Rydberg atom (electron) density, and is the electron temperature. This simplified model treats all Rydberg levels as essentially equal and neglects transitions between different levels. It neglects radiative decay and assumes the plasma is charge neutral. Recombination increases the electron temperature, and the corresponding rate equation can be written as
| (2) |
where , , and are the initial electron temperature, strong coupling parameter, and electron density. The total energy gained in one recombination event is the sum of the colliding electron energy and the correlation energy. We use the relation to write these coupled differential equations for and in terms of known parameters mod .
The relationship between the Rydberg atom density and the fluorescence emission rate is non-trivial. However, there is some evidence from our simulation that a single collision de-excites the Rydberg atom to radiating states. This suggests that the Rydberg atom density at a time is proportional to the fluorescence signal integrated to a time ,
| (3) |
A comparison of this simplified rate equation model to the experiment is shown in Fig. 2. For this comparison, we choose early enough that the plasma has not started to expand.
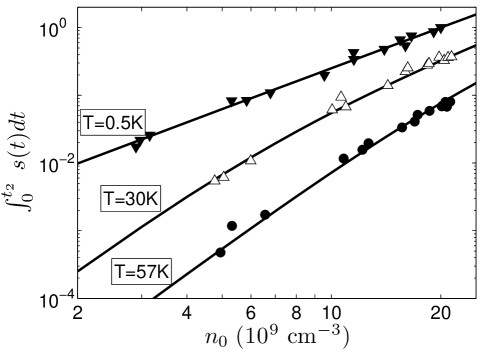
The relatively good agreement between the rate equation model and the data and the poorer agreement of the simulation deserve some attention. The simulation is much more complete than the model. It uses the most widely accepted approach for Rydberg atom formation, for Rydberg/electron collisions, and for Rydberg state distribution. It uses the exact hydrogenic decay rates. It also includes geometrical effects of the fluorescence collection optics. On the other hand, the rate equation model doesn’t include any effects due to Rydberg state distribution or to the cascade down into fluorescing states. Perhaps, then, the simulation tells us something about effects beyond the “standard” cold plasma model. It is likely that these are related to details of the high-energy portion of the electron distribution. A non-Maxwellian tail would change the location of the thermal bottleneck, the deeply-bound Rydberg state distribution, and the cascade rates.
A simulation in Ref. Kuzmin and O’Neil (2002b) suggested that strong coupling in the initial electron system might change the three-body recombination rate by perhaps a factor of two. Guided by the rate equation model, we can explore this possibility. For early enough times, the collisional ionization term, , in Eq. 1 can be neglected because the recombined Rydberg atom density is small. With this assumption, the Rydberg atom density is . Using Eq. 3 and the definition of the strong coupling parameter, we can write
| (4) |
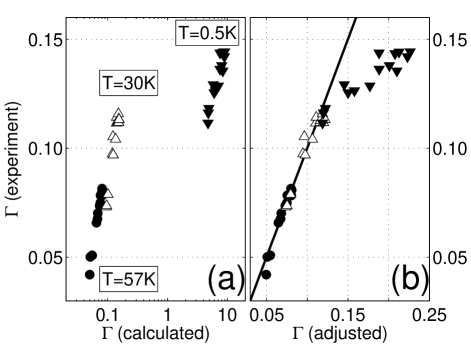
For the low density, high temperature data, the strong coupling parameter can be reliably calculated from the initial experimental values Gupta et al. (2007). However, when the plasma is generated closer to the strongly-coupled regime, the electron temperature rapidly increases and the density decreases to values that can be significantly different from the initial ones. However, it is expected that the recombination rates are smooth functions of the strong coupling parameter.
In Fig. 3(a) we plot the strong coupling parameter extracted from the experiment vs. the calculated value. The experimental data is scaled to agree with the calculated value for the smallest . The higher data are in obvious disagreement. However, by adjusting the electron temperature in the calculation, the experimental can be made to vary smoothly as shown in Fig 3(b). Beginning at the experimental falls well below the adjusted value. This is what one would expect if the three-body recombination rate is depressed due to many body interactions. Of course, this is also what one would expect if the electron temperature is simply higher than expected. An independent and accurate electron temperature measurement at early times is obviously needed, although if the tail of the electron distribution is non-Maxwellian, the meaning of the temperature measurement becomes less clear.
In conclusion, we have demonstrated a new fluorescence technique to study three-body recombination in ultracold neutral plasmas. This method probes the evolution of deeply-bound Rydberg states. In contrast with previous work, where the evolution of plasma parameters can be predicted using simple fluid models, we find substantial disagreements. This work suggests that the high energy electron distribution or the Rydberg state distribution is different from that predicted by the standard cold plasma simulation. We note that when the ultracold plasmas start with the electron strong coupling parameter in the range of , the early time evolution of the electron and Rydberg state distributions are not well known. Measuring the plasma fluorescence provides an opportunity to study this regime.
This work is supported in part by Brigham Young University, the Research Corporation, the National Science Foundation (Grant No. PHY-0601699) and the Chemical Sciences, Geosciences, and Biosciences Division of the Office of Basic Energy Sciences, U.S. Department of Energy.
References
- Killian et al. (1999) T. C. Killian, S. Kulin, S. D. Bergeson, L. A. Orozco, C. Orzel, and S. L. Rolston, Phys. Rev. Lett. 83, 4776 (1999).
- Simien et al. (2004) C. E. Simien, Y. C. Chen, P. Gupta, S. Laha, Y. N. Martinez, P. G. Mickelson, S. B. Nagel, and T. C. Killian, Phys. Rev. Lett. 92, 143001 (2004).
- Cummings et al. (2005a) E. A. Cummings, J. E. Daily, D. S. Durfee, and S. D. Bergeson, Phys. Rev. Lett. 95, 235001 (2005a).
- Killian (2007) T. C. Killian, Science 316, 705 (2007).
- Murillo (2006) M. S. Murillo, Phys. Rev. Lett. 96, 165001 (2006).
- Pohl et al. (2005) T. Pohl, T. Pattard, and J. M. Rost, Phys. Rev. Lett. 94, 205003 (2005).
- Pohl and Pattard (2006) T. Pohl and T. Pattard, J. Phys. A: Math. Gen. 39, 4751 (2006).
- Kuzmin and O’Neil (2002a) S. G. Kuzmin and T. M. O’Neil, Phys. Rev. Lett. 88, 065003 (2002a).
- Robicheaux and Hanson (2002) F. Robicheaux and J. D. Hanson, Phys. Rev. Lett. 88, 055002 (2002).
- Mazevet et al. (2002) S. Mazevet, L. A. Collins, and J. D. Kress, Phys. Rev. Lett. 88, 055001 (2002).
- Pohl et al. (2004) T. Pohl, T. Pattard, and J. M. Rost, Phys. Rev. A 70, 033416 (2004).
- Fletcher et al. (2006) R. S. Fletcher, X. L. Zhang, and S. L. Rolston, Phys. Rev. Lett. 96, 105003 (2006).
- Roberts et al. (2004) J. L. Roberts, C. D. Fertig, M. J. Lim, and S. L. Rolston, Phys. Rev. Lett. 92, 253003 (2004).
- Gupta et al. (2007) P. Gupta, S. Laha, C. E. Simien, H. Gao, J. Castro, T. C. Killian, and T. Pohl, Phys. Rev. Lett. 99, 075005 (2007).
- (15) R. S. Fletcher, X. L. Zhang, and S. L. Rolston, eprint arXiv:0706.2672v1 [physics.atom-ph].
- for (2002) NRL Plasma Formulary (Naval Research Laboratory, Washington, DC, 2002), URLhttp://wwwppd.nrl.navy.mil/nrlformulary/.
- Kuzmin and O’Neil (2002b) S. G. Kuzmin and T. M. O’Neil, Physics of Plasmas 9, 3743 (2002b).
- Hahn (1997) Y. Hahn, Physics Letters A 231, 82 (1997).
- Hahn (2000) Y. Hahn, Physics Letters A 264, 465 (2000).
- (20) Early experimental publications suggested that the recombination rate was in disagrement with plasma theory, however later simulations that included both recombination and scattering brought theory and experiment into agreement.
- Cummings et al. (2005b) E. A. Cummings, J. E. Daily, D. S. Durfee, and S. D. Bergeson, Physics of Plasmas 12, 3501 (2005b).
- Robicheaux (2004) F. Robicheaux, Phys. Rev. A 70, 022510 (2004).
- Robicheaux and Hanson (2003) F. Robicheaux and J. D. Hanson, Phys. Plasmas 10, 2217 (2003).
- Pajek and Schuch (1997) M. Pajek and R. Schuch, Hyperfine Interactions 108, 185 (1997).
- Pajek and Schuch (1999) M. Pajek and R. Schuch, Phys. Scr. T80B, 307 (1999).
- Mansbach and Keck (1969) P. Mansbach and J. Keck, Phys. Rev. 181, 275 (1969).
- (27) For the rate equation model m3/s Mansbach and Keck (1969) and m6/s for (2002).