Multiphase plasma in Sub-Damped Lyman-Alpha Systems: A Hidden Metal Reservoir111Based on observations taken under programme IDs 072.A-0442(A) and 078.A-0164(A) with the Ultraviolet and Visual Echelle Spectrograph (UVES) on the Very Large Telescope (VLT) Unit 2 (Kueyen) at Paranal, Chile, operated by ESO.
Abstract
We present a VLT/UVES spectrum of a proximate sub-damped Lyman- (sub-DLA) system at toward the quasar Q0331-4505 (). Absorption lines of O I, Si II, Si III, Si IV, C II, C III, C IV, Fe II, Al II, and O VI are seen in the sub-DLA, which has a neutral hydrogen column density log . The absorber is at a velocity of km s-1 from the quasar; however, its low metallicity [O/H]=, lack of partial coverage, lack of temporal variations between observations taken in 2003 and 2006, and non-detection of N V imply the absorber is not a genuine intrinsic system. By measuring the O VI column density and assuming equal metallicities in the neutral and ionized gas, we determine the column density of hot ionized hydrogen in this sub-DLA, and in two other sub-DLAs with O VI drawn from the literature. Coupling this with determinations of the typical amount of warm ionized hydrogen in sub-DLAs, we confirm that sub-DLAs are a more important metal reservoir than DLAs, in total comprising at least 6–22% of the metal budget at .
Subject headings:
intergalactic medium – quasars: absorption lines – galaxies: halos – galaxies: high-redshift1. Introduction
Highly ionized gas is ubiquitous in galactic halos at high redshift. This is known from the detection of C IV and O VI absorption in damped Lyman- (DLA, i.e. systems with log ; Ledoux et al., 1998; Wolfe & Prochaska, 2000; Fox et al., 2007a, b) and sub-DLAs (systems with 19.0log ; Dessauges-Zavadsky et al., 2003; Péroux et al., 2003, 2007). These studies have found that C IV is present in every DLA where data exists, and that O VI absorption, tracing a hotter phase of gas, is present in at least 40% of DLAs. Detections of C IV and O VI absorption have also been reported (Bergeron et al., 1994; Kirkman & Tytler, 1997, 1999) in Lyman Limit Systems (LLSs), a lower H I column density class of QSO absorber that may be tracing the extended outer regions of galactic halos.
Physically, there are two principal processes that are expected to generate hot plasma in galactic halos. The first is star formation, which leads to supernovae and the subsequent production of hot, shock-heated interstellar gas, possibly in the form of winds (Oppenheimer & Davé, 2006; Kawata & Rauch, 2007; Fangano et al., 2007). The second is accretion, which results in the shock-heating of infalling intergalactic gas to temperatures of 105-7 K (Davé et al., 2001; Fang & Bryan, 2003; Kang et al., 2005). Given the low metallicities and low densities expected in these hot halo environments, the cooling times will be very long ( yr for gas at K, 0.01 solar metallicity, and cm-3), enabling metals to become locked up. Indeed, approximately half of the metals produced in stars by a redshift of two are yet to be observed (Bouché et al., 2005, 2006, 2007; Sommer-Larsen & Fynbo, 2007), and hot halos represent a potential harbor for these metals.
It has recently become apparent that sub-damped Lyman- systems (sub-DLAs, with , also known as a Super-LLSs) play a significant role in the metal budget (Péroux et al., 2005, 2007; Prochaska et al., 2006; Kulkarni et al., 2007), but the contribution of the O VI-phase in sub-DLAs has not been studied before; indeed, we are aware of only one other published detection of O VI in a sub-DLA (Simcoe et al., 2002). We present in this paper observations and ionization modelling of a sub-DLA showing a detection of O VI.
2. Observations
The spectra of QSO Q0331-4505 (catalog ) were taken with the Ultraviolet-Visual Echelle Spectrograph (UVES; Dekker et al., 2000) at the 8.2m Very Large Telescope Unit 2 (VLT/UT2) at Paranal, Chile during observing runs in 2003 and 2006. The data reduction was performed using the UVES pipeline described in Ballester et al. (2000). The spectra were co-added in wavelength regions covered in both runs, and have a spectral resolution (FWHM) of 6.6 km s-1 (=45 000).
A strong Lyman- absorber exists in the spectrum at . This redshift is measured using the velocity of the strongest component of absorption in Si II 1304, and defines the velocity zero-point in the following discussion. Using a Voigt profile fit to the damping wings of the Lyman- line, we find log , identifying the absorber as a sub-DLA. In Figure 1 we show the absorption line profiles of O I, C II, Si II, Fe II, Al II, Fe III, C III, Si III, Si IV, C IV, and O VI, which all show detections in the sub-DLA. No C II∗, Al III, or N V absorption is seen. Both lines of the O VI doublet display identical optical depth profiles over a velocity range of 175 km s-1, verifying the genuine detection of O VI absorption, free from blending with the Lyman- forest. Voigt profile fits were conducted using the VPFIT software package222Available at http://www.ast.cam.ac.uk/rfc/vpfit.html, and are included in Figure 1. The fits to each ion were completely independent. A summary of the key properties of the sub-DLA is given in Table 1.
| Property | Value | Property | Value |
|---|---|---|---|
| 2.65618 |
aa is an average of all the QSO emission lines measured.
|
||
| 7.1 MpcbbEstimated distance from the QSO, assuming Hubble flow (see text).
|
– | km s-1 | |
| log | log | ||
|
ccVelocity width containing 90% of the integrated optical depth.
|
km s-1 |
ccVelocity width containing 90% of the integrated optical depth.
|
km s-1 |
| log | log | ||
| log dd is derived from CLOUDY
photoionization modelling to the low-ion column densities (see text).
|
|||
| log eeThe lower limits to are found using the maximum allowed O VI ionization fraction (=0.2), and then calculating . | 20.09 | / | 1.9 |
| log | 20.38 | / | 3.6 |
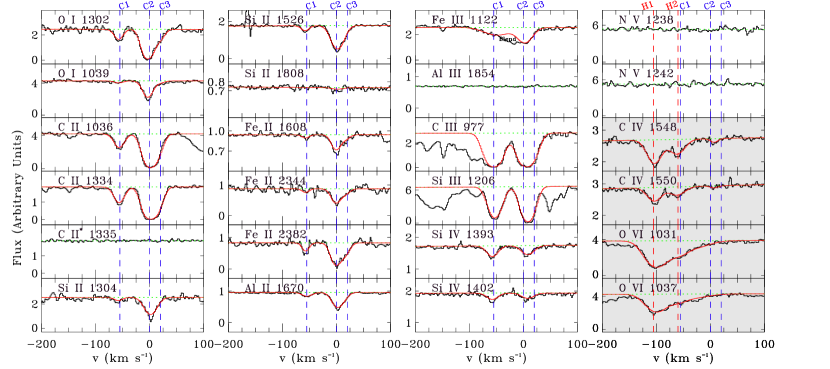
We identify three principal components of low-ion absorption, at 55, 0, and 20 km s-1, which we name C1, C2, and C3, respectively. C2 is the strongest component. C3 is implied by the need to fit the positive-velocity wing of the low-ion lines, but its column density is relatively low, so we ignore it in the following discussion. C1 and C2 are all seen in O I, Si II, Al II, Fe II, C II, C III, Si III, and Si IV, and C IV. We also identify two components of high-ion absorption seen in O VI and C IV, at 100 and 60 km s-1, which we designate H1 and H2, respectively. The C IV seen near 60 km s-1 may have contributions from both H2 and C1.
3. Proximity to the Quasar
Proximate absorbers separated from the background quasar by d5 000 km s-1 [sometimes d3 000 km s-1, where d=] are often removed from samples of intervening absorbers because they may be either ejected or ionized (or both) by the QSO itself (Weymann et al., 1979; Foltz et al., 1986). We measured the observed wavelengths of the N V, O I, C IV, He II, and C III] QSO emission lines in the Q0331-4505 (catalog ) spectrum, and derived the QSO redshift by accounting for the average velocities of these lines (relative to the systemic redshift) as listed in Tytler & Fan (1992). This yielded 333Improving the estimate of =2.6 by Maza et al. (1993)., implying the sub-DLA is separated from the quasar by a velocity of d km s-1. Assuming a WMAP 3-year cosmology (=73 km s-1 Mpc-1, =0.24, =0.76; Spergel et al., 2007), we use the relation given in Phillipps et al. (2002) to find that the Hubble parameter at is =257 km s-1 Mpc-1. Therefore, assuming the sub-DLA motion is purely due to Hubble flow (i.e., ignoring peculiar velocities), we find a separation of Mpc from the quasar.
Despite the proximity to the quasar, several lines of evidence suggest this sub-DLA is not an intrinsic system arising near the central engine of the AGN: (1) the metallicity is too low (Petitjean, Rauch, & Carswell, 1994); (2) N V, which is expected in intrinsic systems (Hamann, 1997), is not detected; (3) no excited states (e.g. C II∗ or Si II∗) are seen in absorption, as would be detected in intrinsic absorbers (e.g. Srianand & Petitjean, 2000); (4) there is no evidence of partial coverage of the background source, which is found in intrinsic absorbers (Arav et al., 2005); (5) there is no evidence for temporal variability between our two observation epochs in 2003 and 2006.
4. Metallicity and Photoionization Modelling
We use the O I/H I ratio to determine the metallicity of the gas. Under interstellar conditions, O I is thought to follow H I closely due to charge exchange reactions (Field & Steigman, 1971), implying that the O I/H I ratio accurately determines O/H without having to apply ionization corrections. Using a Voigt profile fit to O I 1302 and 1039, we find log (O I)=14.840.05 (total over the three components). Coupling this with log (H I)=19.820.05, we find [O I/H I]=[O/H]=1.640.07444Throughout this paper we use the solar oxygen abundance (O/H) from Asplund et al. (2004).
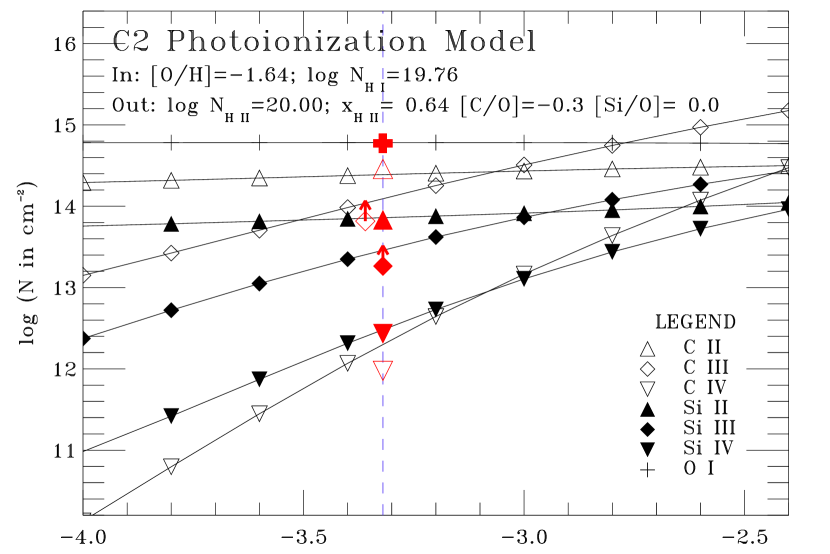
To determine the ionization balance in the photoionized gas, we ran a grid of CLOUDY (version C06.02, described in Ferland et al., 1998) photoionization models to component C2 at different ionization parameter . The models assume the gas exists in a plane-parallel, uniform slab, and take the metallicity [O/H] and as fixed inputs. We assume the fraction of the total H I column that exists in C2 is the same as the fraction of the total O I column in C2, which is 86%. To specify the radiation field, we take an unattenuated quasar (QSO) spectrum, i.e. a power-law with the form at 1216 Å (Haardt & Madau, 1996) normalized by the measured QSO -band magnitude of 17.9 and , which yield a total QSO luminosity at the Lyman Limit = erg s-1 Hz-1 when extrapolating the -band flux as described in Guimarães et al. (2007). Making use of the QSO-absorber luminosity distance of 7.1 Mpc, we then find that the flux of ionizing radiation from the QSO at the absorber is = erg cm-2 s-1 Hz-1, lower than the extragalactic background (EGB) at =2.65, which has = erg cm-2 s-1 Hz-1 (Haardt & Madau, 1996). The QSO radiation field contains more high-energy photons than the EGB, boosting the production of Si IV and C IV, so the radiation field we use in the CLOUDY modelling includes both the EGB and the normalized QSO contribution.
We found the value of log that matches the Si IV/Si II column density ratio measured in C2. This value, log =3.320.10, also matches the observed O I column density. We then found that [C/O]=0.3 was necessary to reproduce the column densities of C II and (within a 2 error) C IV. Finally we checked that the model is consistent with the C III and Si III lower limits. This model is shown in Figure 2 and is characterized by a hydrogen ionization fraction =0.64, and an ionized hydrogen column density log =20.00. We assume the same conditions apply in C1 and C3, giving a total log =20.06.
The ionization level we derive in the low-ion phase (64%) is no larger than the levels derived in intervening sub-DLAs by other authors (Prochaska, 1999; Péroux et al., 2007), reinforcing the idea that this sub-DLA does not show unusual properties because of its proximity to the quasar. The idea that many proximate DLAs (and by extension sub-DLAs) may be representative of the intervening population has been proposed before (e.g. Moller et al., 1998), though see Prochaska et al. (2007).
5. A Highly Ionized Plasma Phase
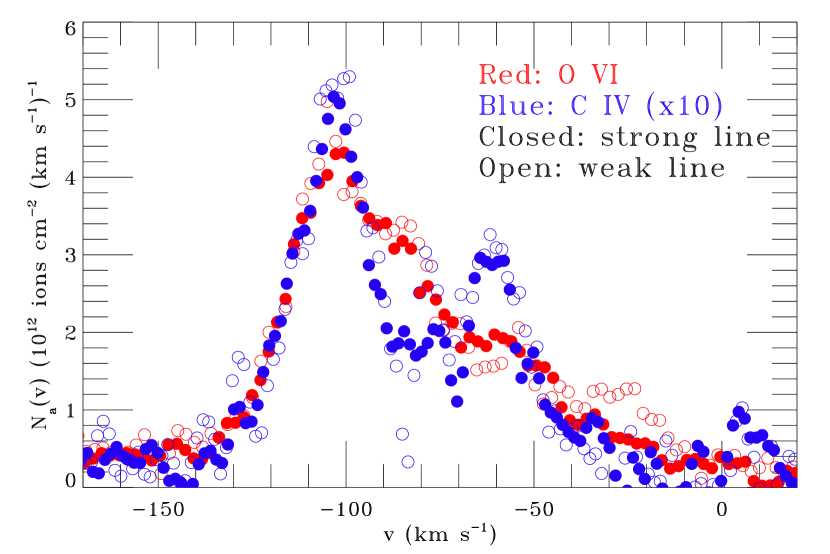
The O VI and C IV profiles are clearly different from the low-ion profiles, with the strongest high-ion component (H1) separated by 100 km s-1 from the strongest low-ion component. O VI and C IV show similar profiles at 150 to 100 km s-1, but the O VI absorption is smoother and broader than the C IV in the range 100 to 0 km s-1. This can be seen in Figure 3, where we compare the apparent column density profiles of the two ions. The difference in the profiles implies that the O VI and C IV are not fully co-spatial, i.e. the two ions trace different temperature regions of a multi-phase structure555Similar differences between the profiles of C IV and O VI have been found before in many other environments, including the Milky Way halo (Fox et al., 2003), the Large Magellanic Cloud (Lehner & Howk, 2007), LLSs (Kirkman & Tytler, 1997, 1999), DLAs (Fox et al., 2007a), and some intergalactic absorbers (Simcoe et al., 2002).. We derive a lower limit on in the O VI-bearing gas using , with an O VI ionization fraction (the maximum allowed by collisional ionization models; see the Appendix in Tripp & Savage, 2000) and assuming that O/H in the high-ionization gas is the same as O/H in the low-ionization gas. This method yields log 20.09 (total over H1 and H2).
To explore how the O VI properties of our sub-DLA relate to other systems, we investigated the only intervening sub-DLA with a published O VI detection: the system at toward Q1442+2931 (catalog ) (Simcoe et al., 2002), and the previously unpublished O VI profile in the sub-DLA at =2.139 toward Q1037-270 (catalog ) (Srianand & Petitjean, 2001). The three sub-DLAs are described in Table 2. Following the same calculation as used here, the ratio takes the value 12 in the Q1442+2931 (catalog ) sub-DLA, and 1.0 in the Q1037-270 (catalog ) sub-DLA, vs 1.9 for the sub-DLA in this paper. From this we conclude that (i) in sub-DLAs, there are more baryons in the O VI phase than there are in the form of H I atoms, and (ii) there is no evidence that radiation from the quasar is creating more O VI in the Q0331-4505 (catalog ) sub-DLA than in intervening sub-DLAs.
6. Contribution of Sub-DLAs to
The latest determination of the cosmic density in H I atoms in sub-DLAs is = (O’Meara et al., 2007). In order to fully account for the contribution of ionized gas in sub-DLAs, it is necessary to determine the average ionized-to-neutral ratio , where . The value of has been investigated by Péroux et al. (2007), who report a mean ionization fraction of 0.68 in 26 sub-DLAs modelled with CLOUDY, corresponding to =2.1. The value of the is not well constrained: as discussed in §5, the derived values in the three existing sub-DLAs with O VI are 1.0, 1.9 and 12. Assuming that the mean in sub-DLAs lies somewhere between these measurements, we find that is between 3.1 and 14. Thus, the total baryon content of sub-DLAs is between and .
The total contribution of sub-DLAs to the metal budget then follows according to: . Assuming a typical sub-DLA metallicity of =0.8 (Kulkarni et al., 2007), then is between and , i.e between 6% and 22% of all the metals produced by star formation up to (using a value for the total from star formation of ; Ferrara et al., 2005). For comparison, (including both the neutral and highly ionized phases; Prochaska et al., 2005; Fox et al., 2007a). This calculation shows that globally there are at least three times more metal atoms in sub-DLAs than DLAs, owing to both the higher mean metallicity and the higher mean ionization level in sub-DLAs.
There are several reasons why this estimate of in sub-DLAs could rise. First, recent detections of sub-DLAs with super-solar metallicity (Khare et al., 2004; Prochaska et al., 2006; Péroux et al., 2006) may imply the mean sub-DLA metallicity is higher than 0.8. Second, the typical temperature of the O VI-bearing gas in sub-DLAs may be above K, implying the O VI ionization fraction will be lower than 0.2 (Sutherland & Dopita, 1993). Finally, if the O VI-bearing gas was generated by the accretion and shock-heating of intergalactic gas, the ionized gas may have lower metallicity than the neutral gas (increasing ). Each of these effects would serve to increase above the 6–22% level discussed here.
References
- Arav et al. (2005) Arav, N., et al. 2005, ApJ, 620, 665
- Asplund et al. (2004) Asplund, M., et al. 2004, A&A, 417, 751
- Ballester et al. (2000) Ballester, P., et al. 2002, The Messenger, 101, 31
- Bergeron et al. (1994) Bergeron, J., et al. 1994, ApJ, 436, 33
- Bouché et al. (2005) Bouché, N., Lehnert, M. D., & Péroux, C. 2005, MNRAS, 364, 319
- Bouché et al. (2006) Bouché, N., Lehnert, M. D., & Péroux, C. 2006, MNRAS, 367, L16
- Bouché et al. (2007) Bouché, N., et al. 2007, MNRAS, 378, 525
- Davé et al. (2001) Davé, R., et al. 2001, ApJ, 552, 473
- Dekker et al. (2000) Dekker, H, et al. 2000, SPIE, 4008, 534
- Dessauges-Zavadsky et al. (2003) Dessauges-Zavadsky, M., et al. 2003, MNRAS, 345, 447
- Fang & Bryan (2003) Fang, T., & Bryan, G. L. 2003, ApJ, 561, L31
- Fangano et al. (2007) Fangano, A. , Ferrara, A., & Richter, P. 2007, MNRAS, submitted
- Ferland et al. (1998) Ferland, G. J., et al. 1998, PASP, 110, 761
- Ferrara, Scannapieco, & Bergeron (2005) Ferrara, A., Scannapieco, E., & Bergeron, J. 2005, ApJ, 634, L37
- Field & Steigman (1971) Field, G. B., & Steigman, G. 1971, ApJ, 166, 59
- Foltz et al. (1986) Foltz, C. B, et al. 1986, ApJ, 307, 504
- Fox et al. (2003) Fox, A. J., et al. 2003, ApJ, 582, 793
- Fox et al. (2007a) Fox, A. J., et al. 2007a, A&A, 465, 171
- Fox et al. (2007b) Fox, A. J., et al. 2007b, A&A, in press (astro-ph/0707.4065)
- Guimarães et al. (2007) Guimarães, R. et al. 2007, MNRAS, 377, 657
- Haardt & Madau (1996) Haardt, F., & Madau, P. 1996, ApJ, 461, 20
- Hamann (1997) Hamann, F. 1997, ApJS, 109, 279
- Kang et al. (2005) Kang, H., Ryu, D., Cen, R., & Song, D. 2005, ApJ, 620, 21
- Kawata & Rauch (2007) Kawata, D., & Rauch, M. 2007, ApJ, 663, 38
- Khare et al. (2004) Khare, P., et al. 2004, ApJ, 616, 86
- Kirkman & Tytler (1997) Kirkman, D., & Tytler, D. 1997, ApJ, 489, L123
- Kirkman & Tytler (1999) Kirkman, D., & Tytler, D. 1999, ApJ, 512, L5
- Kulkarni et al. (2007) Kulkarni, V. P., et al. 2007, ApJ, 661, L88
- Ledoux et al. (1998) Ledoux, C., et al. 1998, A&A, 337, 51
- Lehner & Howk (2007) Lehner, N., & Howk, J. C. 2007, MNRAS, 377, 687
- Maza et al. (1993) Maza, J., et al. 1993, RMxAA, 25, 51
- Moller et al. (1998) Moller, P., Warren, S., & Fynbo, J. 1998, A&A, 330, 19
- O’Meara et al. (2007) O’Meara, J. M., et al. 2007, ApJ, 656, 666
- Oppenheimer & Davé (2006) Oppenheimer, B., & Davé, R. 2006, MNRAS, 373, 1265
- Péroux et al. (2003) Péroux, C, et al. 2003, MNRAS, 345, 480
- Péroux et al. (2005) Péroux, C., et al. 2005, MNRAS, 363, 479
- Péroux et al. (2006) Péroux, C., et al. 2006, A&A, 450, 53
- Péroux et al. (2007) Péroux, C., et al. 2007, MNRAS, in press (astro-ph/0707.2697)
- Petitjean, Rauch, & Carswell (1994) Petitjean, P., Rauch, M., & Carswell, R. F. 1994, A&A, 291, 29
- Phillipps et al. (2002) Phillipps, S., Horleston, N. J., & White, A. C., MNRAS, 336, 587
- Prochaska (1999) Prochaska, J. X. 1999, ApJ, 511, L71
- Prochaska, Herbert-Fort, & Wolfe (2005) Prochaska, J., Herbert-Fort, S., & Wolfe, A. 2005, ApJ, 635, 123
- Prochaska et al. (2006) Prochaska, J. X., et al. 2006, ApJ, 648, L97
- Prochaska et al. (2007) Prochaska, J. X., et al. 2007, ApJ, submitted (astro-ph/0703594)
- Simcoe et al. (2002) Simcoe, R. A., Sargent, W., & Rauch, M. 2002, ApJ, 578, 737
- Sommer-Larsen & Fynbo (2007) Sommer-Larsen, J., & Fynbo, J. P. U. 2007, MNRAS, submitted
- Spergel et al. (2007) Spergel, D. N., et al. 2007, ApJS, 170, 377
- Srianand & Petitjean (2000) Srianand, R., & Petitjean, P. 2000, A&A, 357, 414
- Srianand & Petitjean (2001) Srianand, R., & Petitjean, P. 2001, A&A, 373, 816
- Sutherland & Dopita (1993) Sutherland, R. S., & Dopita, M. A. 1993, ApJS, 88, 253
- Tripp & Savage (2000) Tripp, T. M., & Savage, B. D. 2000, ApJ, 542, 42
- Tytler & Fan (1992) Tytler, D, & Fan, X.-M. 1992, ApJS, 79, 1
- Weymann et al. (1979) Weymann, R. J., et al. 1979, ApJ, 234, 33
- Wolfe & Prochaska (2000) Wolfe. A. M., & Prochaska, J. X. 2000, ApJ, 545, 591
| QSO | Type | log | [O/H] | log | Ref. | |||
|---|---|---|---|---|---|---|---|---|
| Q0331-4505 | 2.674 | 2.656 | Proximate | 19.820.05 | 1.640.07 | 14.430.02 | 1.9 | 1 |
| Q1442+2931 | 2.669 | 2.439 | Intervening | 19.780.30 | 1.820.40 | 15.000.01 | 12.0 | 2 |
| Q1037-270 | 2.201 | 2.139 | Intervening | 19.700.05 | 0.310.05 | 15.350.30 | 1.0 | 3 |