Role of disorder in the size-scaling of material strength
Abstract
We study the sample size dependence of the strength of disordered materials with a flaw, by numerical simulations of lattice models for fracture. We find a crossover between a regime controlled by the fluctuations due to disorder and another controlled by stress-concentrations, ruled by continuum fracture mechanics. The results are formulated in terms of a scaling law involving a statistical fracture process zone. Its existence and scaling properties are only revealed by sampling over many configurations of the disorder. The scaling law is in good agreement with experimental results obtained from notched paper samples.
pacs:
62.20.Mk,05.40.-a, 81.40NpThe fracture strength of materials depends on various characteristic length-scales of the specimen, and represents a fundamental open problem of science and engineering. Probably the oldest scientific study of this issue was performed by Leonardo da Vinci, who measured the carrying-capacity of metal wires of varying length da Vinci (Hoepli Milano 1940). The simple observation was that the longer the wire, the less weight it could sustain. The reason for this behavior is rooted in the structural disorder present in the material: the strength is dominated by the weakest part of the sample and its distribution is related to extreme value statistics Gumbel (2004). Longer wires are more likely to contain weak parts and are thus bound to fail earlier on average. While the physical mechanism behind this extreme-value based statistical size effect is clear, obtaining mathematical laws for it is still a formidable task. In quasi-brittle materials, such as concrete and many other composites, this issue is particularly important and it is complicated by the significant damage accumulation preceding sample failure.
The most important setting to study size effects involves a specimen containing a pre-existing flaw, a notch. Failure in this case is determined by the competition between deterministic effects, due to the stress enhancement created by notch, and the stochasticity coming from the disorder Bazant and Planas (1997). For a sufficiently large notch, stress enhancement around the crack tip dominates the process. It is then customary to consider disorder as a small perturbation, by defining a Fracture Process Zone (FPZ) around the crack tip, where all the damage accumulation is confined. For quasi-brittle materials, however, the size of the FPZ may not be negligible when compared to the system size. Conversely, for small notches failure is influenced by statistical effects, and may for instance initiate far from the pre-existing notch due to nucleated microcracks. Several formulations to account for the size effects have been proposed in the literature Bazant (2004); Hu and Wittmann (1992); Karihaloo (1999); Morel et al. (2000, 2002); Carpinteri and Pugno (2005). These approaches are mainly based on the ad hoc extensions of linear elastic fracture mechanics (LEFM). This is a well established framework to understand cracks in homogeneous media but encounters fundamental problems when disorder is strong and homogenization methods are not applicable.
In LEFM the stability of a flaw against failure is given by the Griffith’s energy criterion for the critical stress, , where is the linear size of the crack and the critical stress intensity factor is a function of the fracture toughness and the elastic modulus Griffith (1920). A scaling law for the size-effect has been proposed by Bazant for quasi-brittle materials Bazant (2004). One generalizes the Griffith expression by postulating an additional length-scale due to the presence of a FPZ
| (1) |
Equation (1) tries to incorporate two natural, important effects: First, in the large notch limit one should recover an expression that follows the LEFM scaling, in which the strength is inversely proportional to . Second, for a vanishing external flaw size , the average strength should still remain finite.
Here we investigate the role of the disorder in the failure of notched quasi-brittle specimens, providing a microscopic justification and establishing the limits of validity of Eq. (1). We study the size scaling of strength by the extensive numerical simulations, a difficult task due to the different length scales involved and to the need of significant statistical averaging. We vary the disorder, which we model as a locally varying random failure threshold, and show that it plays a crucial role in determining the size effect, influencing the fracture toughness . Furthermore, the lengthscale naturally emerges from the simulations and can be shown to be directly related to the FPZ size. Finally, for notch sizes smaller than a critical length , we observe a cross-over to the inherent, sample-size dependent strength of the unnotched sample. We present a scaling formula that incorporates all these effects and confirm its validity by comparing the simulations to experiments on notched paper samples.
To simulate a disordered elastic solid, we consider the simplest case where disorder and LEFM-like stress enhancements can be incorporated. We perform extensive simulations of the random fuse model (RFM) de Arcangelis et al. (1985); Alava et al. (2006). The RFM represents a quasi-brittle failure process by an electrical analogue composed of a network of fuses. We consider a triangular lattice of linear size with a central notch of length . The fuses have unit conductance (which would correspond to in the elastic system) and random breaking thresholds . These represent a locally varying fracture toughness/strength. The lie between 0 and 1, with a cumulative distribution , where represents a quantitative measure of disorder. The larger is, the stronger the disorder. In the simulation, the burning of a fuse occurs irreversibly, whenever the electrical current in the fuse exceeds its threshold . An external current is increased applying a voltage difference between the top and the bottom lattice bus bars and applying periodic boundary conditions along the other direction. Damage accumulates until a connected fracture path disconnects the network and one can define the strength as the total peak current divided by the length of the bus bar. We also perform numerical simulations for the random spring model (RSM) Nukala et al. (2005), similar to the mesoscale models used routinely for concrete Lilliu and van Mier (2003). The RSM is similar to the RFM but the fuses are replaced by elastic springs that break when their elongation reaches a random threshold. While the RSM represents more faithfully the elastic continuum, the statistical properties of the fracture process are analogous to those of the RFM Nukala et al. (2005).
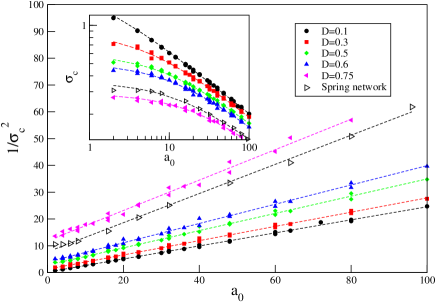
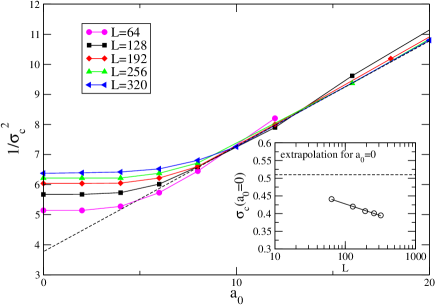
The inset of Fig. 1 reports the strength, averaged over different configurations, with varying , , and . The most instructive way of plotting is to consider the inverted square strength, . Assuming Eq. (1), it is clear that should become a linear function of for large enough notches. Plotting the data in such a manner in Fig. 1 reveals four interesting features: (i) for , the scaling of Eq. (1) is recovered asymptotically; (ii) the linear part of the data when extrapolated towards reveals a disorder-dependent intercept , that should be related to the size of the FPZ; (iii) the slope of the linear part of the data is disorder-dependent, which implies a disorder-dependent fracture toughness ; and finally, (iv) a careful observation (see Fig. 2) reveals that for small less than a critical crack size , the strength scaling crosses-over from a stress concentration dominated LEFM scaling (Eq. 1) to a disorder dominated scaling. In particular, the data presented in the inset of Fig. 2 indicates that the strength of the unnotched system (for ) is smaller than the LEFM limit (where is the slope and is the intercept of the lines in Fig. 1 based on Eq. (1)). Hence, in order to extrapolate the typical sample-size dependent strength from notched experiments it is necessary to know . As can be seen, these features are also exhibited by RSM results.
The cross-over at a critical crack size marks the important role of structural disorder or internal damage on the size-effect, and relates to the size-effect in unnotched samples. For the RFM, the size-effect without a notch has been shown by simulations and theoretical arguments to have a logarithmic dependence on the linear system size, Duxbury et al. (1986); Alava et al. (2006). For many engineering materials, one resorts to the Weibull theory Weibull (1939) as an empirical starting point.
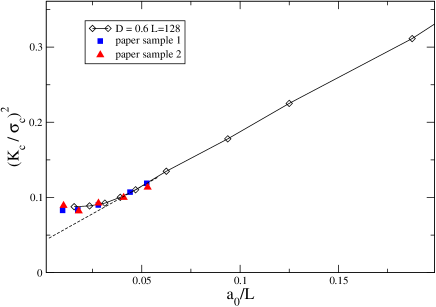
This cross-over from LEFM dominated strength scaling to disorder dominated strength scaling is illustrated in Fig. 3, where we compare the simulation data to experimental results on paper samples with varying center notch sizes. The paper data is from Ref. Wathén (2003). The two data sets presented are for strips of cm cut from laboratory-made handsheets, of fine paper-type, with center defects of nominal sizes of 0.5, 1, 1.5, 2, and 2.5 mm. Tensile tests were performed on 100 samples, in order to average the results. In Fig. 3, we observe clearly the presence of , below which the notches have a negligible role on , and for crack sizes larger than fracture is ruled by LEFM. We have also fitted the simulation data to these experiments, by considering similar ratios and varying the to obtain reasonable agreement with the experimental data.
The observations from Figs. 1 and 2 can be summarized into a single scaling theory by noticing that there must be a scale above which the LEFM holds and follows Eq. (1). For the strength scaling deviates significantly from Eq. (1) and saturates to a value that depends only on disorder and the sample size, . This is the strength of the unnotched system of size and disorder . The cross-over from LEFM scaling (Eq. (1)) occurs at a notch size which can be obtained from Eq. (1) as . It is possible to describe this crossover by the following scaling form, valid for all such that
| (2) |
where the scaling function fulfills the limits
| (5) |
The length-scale corresponds to a cross-over scale below which material strength is governed by disorder strength and system size. When the notch size exceeds this cross-over length scale (), fracture is governed by LEFM. At fixed , stronger disorder will increase since the strength of unnotched samples decays faster than the decrease in . This is understandable since the disorder masks more efficiently the stress concentration due to the notch. Likewise, at fixed , increases with increasing .
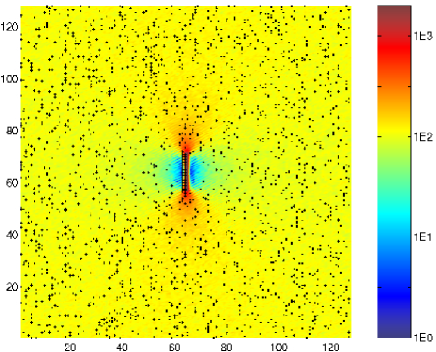
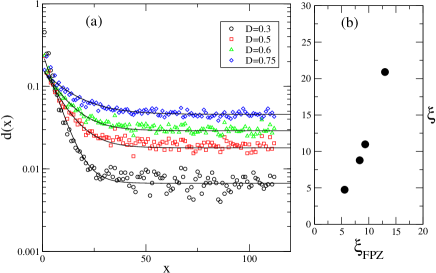
Simulations of the RFM allow us to access the damage evolution prior to failure and can thus be used to visualize the development of the FPZ. As shown in Fig. 4, for a single realization of the disorder, at maximum stress we only see diffuse damage, without apparent localization so that the FPZ can not be observed. When we average the damage over different configurations, however, a clear FPZ emerges in front of the crack tip (see Fig. 4). Hence the FPZ should be considered a statistical concept, visible only when averaging over disorder, while the effect of the FPZ is nevertheless seen in the size-effect (). To measure the FPZ size, we consider a projection of the average damage along the crack direction and obtain a profile that is decaying exponentially towards a homogeneous background value: (see Fig. 5a). We have analyzed the data for different values of and checked that the profiles do not depend on as long as this is not too far from . The LEFM stress intensity factor would indicate a -like divergence of the stress at the crack tip. It is evident that the observed exponential shape of the damage profile is in contrast to a -like decay and should be naturally interpreted as a screening of the crack tip caused by the disorder. In Figure 5b, we plot the deduced fracture process size against the intrinsic scale that one obtains from the fits of the strength data to the Eq. (1) and which also is an important part of the scaling theory presented in Eq. (2). It can be seen that these are linearly proportional indicating that is indeed a direct measure of the FPZ size. Notice that an exponential damage zone has been indeed measured in paper samples and the corresponding lengthscale was compared with the one obtained from Eq. (1) Kettunen and Niskanen (2000).
In conclusion, we have resorted to simulations of statistical fracture models to analyze the problem of the size-effect in the failure of materials. For large notches, the simulations recover the expected scaling of LEFM Bazant (2004) and allow to relate the effective FPZ size to the actual average damage profiles. As the notch size is decreased we observe a crossover at a novel scale to a disorder-dominated size-dependent regime that is not described by LEFM and is furthermore seen in experiments. All the regimes are summarized in a generalized scaling expression (Eq. (2)) for the strength of disordered media.
Acknowledgments - MJA would like to acknowledge the support of the Center of Excellence -program of the Academy of Finland, discussions with Dr. R. Wathén and the access to the data of Ref. Wathén (2003). MJA and SZ gratefully thank the financial support of the European Commissions NEST Pathfinder programme TRIGS under contract NEST-2005-PATH-COM-043386. PKKVN acknowledges support from Mathematical, Information and Computational Sciences Division, Office of Advanced Scientific Computing Research, U.S. Department of Energy under contract number DE-AC05-00OR22725 with UT-Battelle, LLC. We are grateful M. Gröhn and CSC, Finnish IT Center for Science, for assistance.
References
- da Vinci (Hoepli Milano 1940) L. da Vinci, I libri di Meccanica (Hoepli Milano 1940).
- Gumbel (2004) E. J. Gumbel, Statistics of Extremes (Columbia University Press, New York, 2004).
- Bazant and Planas (1997) Z. P. Bazant and J. Planas, Fracture and Size Effect in Concrete and Other Quasibrittle Materials (CRC Press, Boca Raton, USA, 1997).
- Bazant (2004) Z. P. Bazant, PNAS 101, 13400 (2004).
- Hu and Wittmann (1992) X. Hu and F. Wittmann, Materials Struct. 25, 319 (1992).
- Karihaloo (1999) B. Karihaloo, Int. J. Fracture 95, 379 (1999).
- Morel et al. (2000) S. Morel, J. Schmittbuhl, E. Bouchaud, and G. Valentin, Phys. Rev. Lett. 85, 1678 (2000).
- Morel et al. (2002) S. Morel, E. Bouchaud, and G. Valentin, Phys. Rev. B 65, 104101 (2002).
- Carpinteri and Pugno (2005) A. Carpinteri and N. Pugno, Nature Mat. 4, 421 (2005).
- Griffith (1920) A. A. Griffith, Trans. Roy. Soc. (london) A 221, 163 (1920).
- de Arcangelis et al. (1985) L. de Arcangelis, S. Redner, and H. J. Herrmann, J. Phys. (Paris) Lett. 46, 585 (1985).
- Alava et al. (2006) M. J. Alava, P. Nukala, and S. Zapperi, Adv. Phys. 55, 349 (2006).
- Nukala et al. (2005) P. K. V. V. Nukala, S. Zapperi, and S. Simunovic, Phys. Rev. E 71, 066106 (2005).
- Lilliu and van Mier (2003) G. Lilliu and J. G. M. van Mier, Eng. Fract. Mech. 70, 927 (2003).
- Duxbury et al. (1986) P. M. Duxbury, P. D. Beale, and P. L. Leath, Phys. Rev. Lett. 57, 1052 (1986).
- Weibull (1939) W. Weibull, A statistical theory of the strength of materials (Stockholm, 1939).
- Wathén (2003) R. Wathén, Lic. thesis (HUT, Espoo, Finland, 2003).
- Kettunen and Niskanen (2000) H. Kettunen and K. Niskanen, J. Pulp Paper Sci. 28, 35 (2000).