Coherent ultrafast core-hole correlation spectroscopy; x-ray analogues of multidimensional NMR
Abstract
We propose two dimensional x-ray coherent correlation spectroscopy (2DXCS) for the study of interactions between core-electron and valence transitions. This technique might find experimental applications in the future when very high intensity x-ray sources become available. Spectra obtained by varying two delay periods between pulses show off-diagonal cross-peaks induced by coupling of core transitions of two different types. Calculations of the N1s and O1s signals of aminophenol isomers illustrate how novel information about many-body effects in electronic structure and excitations of molecules can be extracted from these spectra.
pacs:
33.20.Rm, 42.65.ReX-ray absorption spectroscopy (XANES, EXAFS)Stohr (1996) and its time-resolved extensionsChen et al (2001); Bressler and Chergui (2004); Chen et al. (2007) provide a direct probe for electronic structure of molecules with subatomic and subfemtosecond resolution. Novel ultrabright x-ray sources such as future free-electron laser (XFEL) LCL or high-harmonic (HH) sources Kapteyn et al. (2007) may make it possible to perform nonlinear experiments with multiple x-ray pulses. All-x-ray nonlinear signals could provide more detailed information on the electronic structure and dynamics than available from time-resolved XANES, by probing states with multiple core electrons excited. Many proposed applications of the new sources make use of their ultrashort temporal resolution and high intensity to monitor dynamical processes in real time. Two-photon absorption Sekikawa et al. (2004) and x-ray driven molecular dynamics Gagnon et al. (2007) have been demonstrated using HH sources. Techniques such as diffraction or pump probe do not rely on the coherence properties of the beams. The technique considered in this Letter, in contrast, depends also on pulse coherence in an essential way, and should become feasible once high intensity, attosecond Corkum et al. (1994); Bartels et al. (2000); Drescher et al. (2002); Zholents et al. (2004) transform-limited pulses become available. Such pulses should allow to control and manipulate the coherence of core excitations and use it as a window into correlations between different regions of the molecule. Similar ideas are effectively used in multidimensional NMR spectroscopy Ernst et al. (1987) to probe correlations between spin dynamics in controlled time periods using elaborate pulse sequences. The signals are interpreted in terms of multiple correlation functions which provide fundamentally new types of information compared to one dimensional techniques. The same ideas were recently extended to the infrared and optical regimes Mukamel (2000); Asplund et al. (2000); Tanaka et al. (2003); Brixner et al. (2005).
In this letter we propose a new class of two dimensional x-ray coherent correlation spectroscopy (2DXCS) techniques and demonstrate how they could provide a unique probe for interactions between the core-transitions and electronic states that mediate these interactions. Infrared femtosecond 2D techniques can excite molecular vibrations impulsively and probe the subsequent correlated dynamics of nuclear wavepackets. Similarly attosecond x-ray pulses resonant with core transitions can excite valence electrons impulsively and probe correlations in dynamical events of resulting electron wavepackets. Since core transitions are highly localized to the absorbing atoms, these techniques also offer a high spatial resolution.
We consider a time-resolved coherent all-x-ray four-wave mixing process carried out by subjecting the molecule to a sequence of three pulses. The first pulse has wavevector and carrier frequency , followed sequentially by the other two pulses , and , . The signal is heterodyne-detected with a fourth pulse ,. The coherent nonlinear response generated in the phase matching direction is recorded as a function of the delays , , and between consecutive pulses. 2DXCS is obtained by a Fourier transform of the signal with respect to two delays, and displaying it as a two-dimensional frequency correlation plot
Like in NMR, transitions of the same type contribute to the diagonal part of the correlation spectrum, while features arising from interactions among spectrally separated transitions appear as off-diagonal cross peaks. By spreading the signal over multiple frequency axes, the weak signatures of interactions between different transitions can be separated from strong same-transition signals Mukamel (2000, 2005).
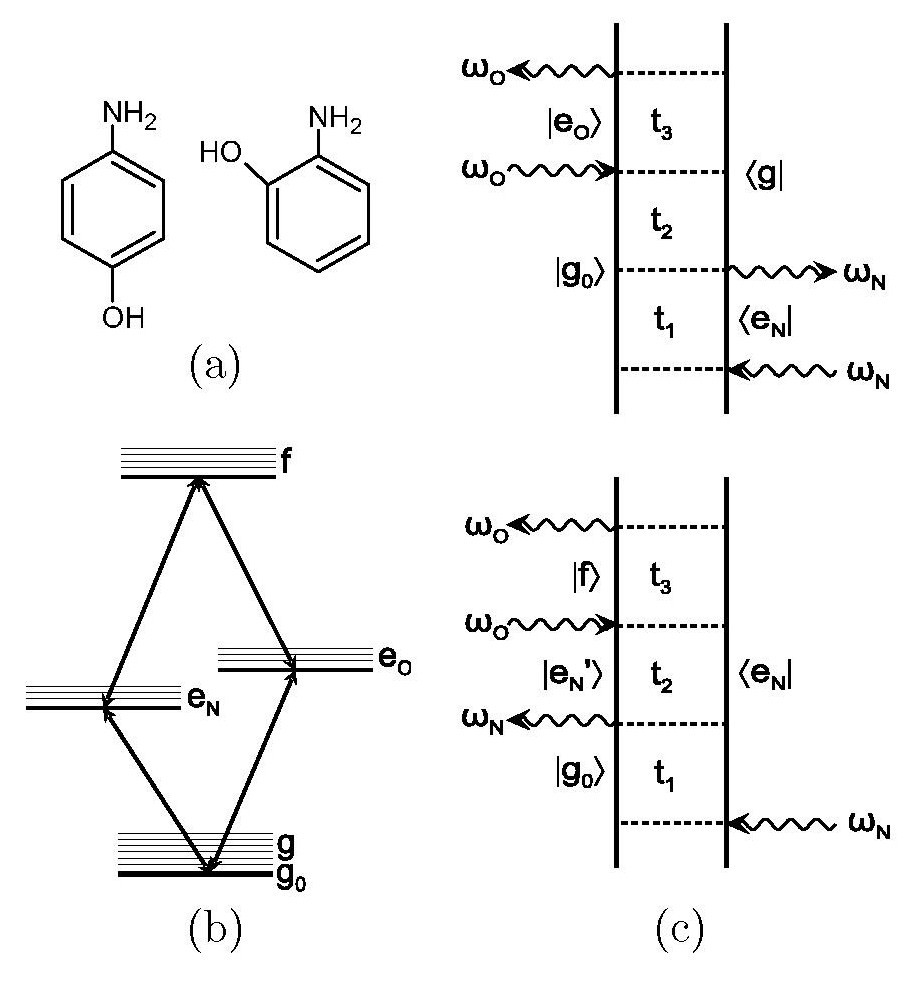
We illustrate the power of these techniques for N1s and O1s transitions of aminophenols (Figure 1). The polarization induced in the molecule by interactions with the x-ray pulses is calculated in terms of nonlinear response functions. Different time orderings appearing in the perturbative expansion of the density matrix are described as Liouville space-pathways and represented by double-side Feynman diagrams Mukamel (1995). Assuming temporally well separated pulses, the signal within the rotating-wave approximation (RWA) where we only retain the resonant contributions is given by
where the response function
| (2) | ||||
is expressed in terms of the core exciton creation and annihilation operators weighted by the pulse envelopes and expanded in terms of the molecular electronic states
| (3) |
Here, is the Fourier transform of the complex envelope of the th pulse and its carrier frequency.
In the following simulations we assumed the pulse bandwidths (10 eV for a 125 attosecond pulse) to be much smaller than the splitting between the N1s and O1s transitions ( 120 eV). The carrier frequencies thus select the desired type of core transition, while the pulse envelopes control which valence excitations of the selected type contribute to the response within the pulse bandwidths.
The diagonal part of the 2DXCS signal is obtained by tuning all four either to N1s or to O1s core transitions, while the cross peaks are obtained in the sequential two-color pulse configuration where are tuned to the N1s and to the O1s transition. In the latter case, the signal consists of the ground-state bleaching (GSB) and excited-state absorption (ESA) terms shown in Figure 1d. The former represents the effect of molecules missing in the ground-state after two interactions with and cannot absorb the photon. The latter represents the additional absorption of molecules from the singly- to doubly-excited states. The signal is given by
| (4) |
where and are the transition dipole and the dephasing rate of the transitions, respectively.
The cross peaks are intrinsically nonadditive and highly sensitive to the coupling between core transitions. When the two core transitions are decoupled, the cross peaks vanish identically due to the interference between the one (GSB) and two-core exciton (ESA) terms. If the core transitions are independent, we can express the two-core exciton states as direct products , , and the two denominators in Eq. (Coherent ultrafast core-hole correlation spectroscopy; x-ray analogues of multidimensional NMR) become identical. Similarly the transition dipole elements will be the same and the two terms which have an opposite sign exactly cancel. Having distinct features in the spectra that are induced by correlations is the main merit of 2D techniques. In NMR, cross peaks are used to extract spin coupling and convert this information into the structure of complex molecules.
First-principles simulations of the cross peaks dependence on the states with two core electrons excited are particularly challenging. We describe the core transition as a response of N+1 valence electrons to an instantly switched core hole using the Nozieres - De Dominicus Hamiltonian Nozieres et al. (1969). The core-hole potential was taken into account by incrementing the charge of the corresponding nuclei (equivalent-core or Z+1 approximation Schwarz et al. (1976)). The valence excitations of the equivalent-core molecule were represented by unoccupied Kohn-Sham orbitals. This allowed us to maintain a simple correspondence between the molecular orbital picture and the many-body states, which facilitated the connection between their properties and the 2DXCS spectra.
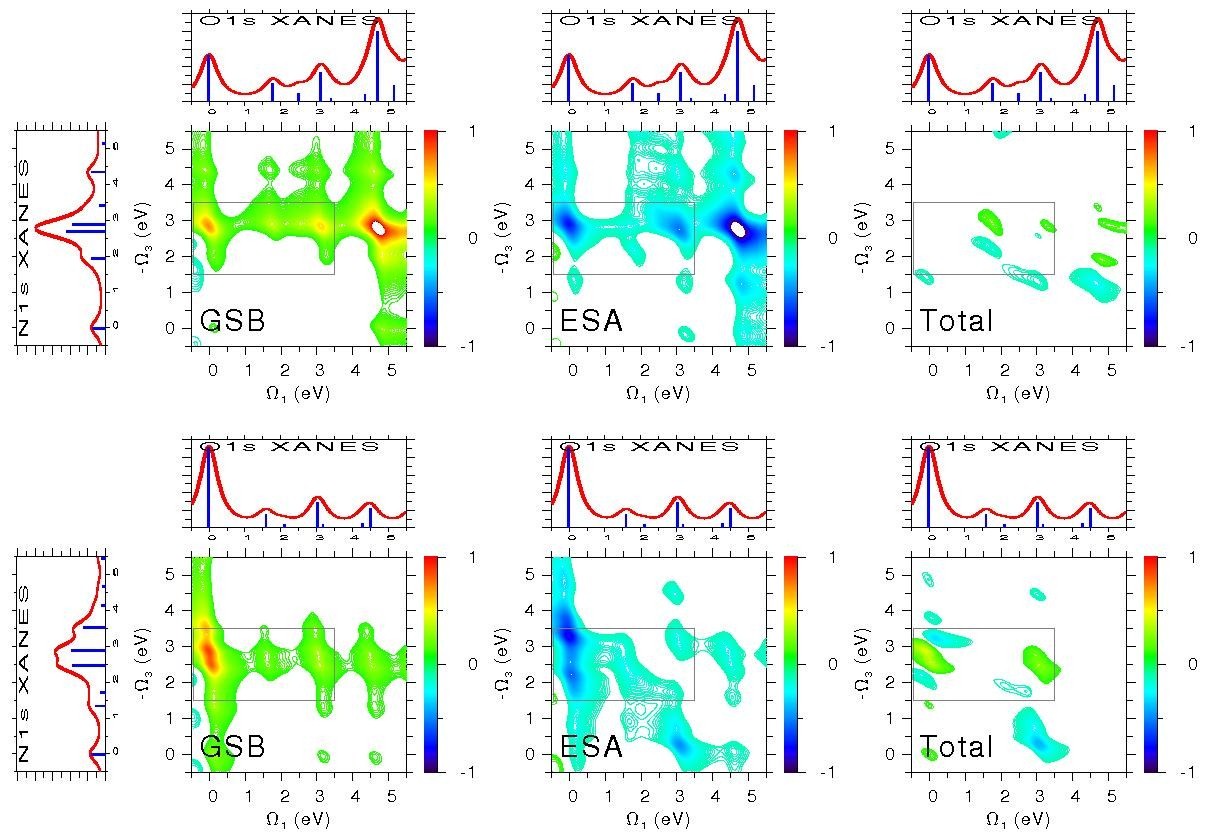
Figure 2 shows the total O1s/N1s cross peak [Eq. (Coherent ultrafast core-hole correlation spectroscopy; x-ray analogues of multidimensional NMR)] and its GSB and ESA components for para and ortho isomers of aminophenol. The pulse carrier frequencies and were tuned to the lowest O1s transition (535 eV), and to the lowest N1s transition (401 eV). We assume the 10 eV pulse bandwidths of (5 eV around the carrier frequencies). The orbitals of the original and equivalent-core molecules were calculated using the B3LYP exchange-correlation functional and the 6-311G** set of Gaussian-type atomic orbitals.
In both isomers, the calculated GSB component is identical to a two-dimensional product of the O1s and N1s XANES spectra. In the para isomer, the O and N atoms are spatially separted, and promoting the O1s electron only weakly affects the N1s transitions. Consequently, the ESA and GSB components are similar and the total 2DXCS cross peak is weak. In the orho isomer, the O and N atoms are close, and exciting the O1s electron strongly affects the N1s transitions. The ESA peaks are shifted, resulting in a stronger 2DXCS cross peak. Thus, the 2DXCS cross peak is highly sensitive to the relative position of the N and O atoms in the aminophenol isomers.
Figures 3 shows the features of the simulated O1s XANES and O1s/N1s 2DXCS cross peak of para- and ortho-aminophenol in the region marked on Figure 2. The intensity scale was magnified by a factor of two to better show the structure of each peak. The equivalent-core molecular orbitals responsible for the three stronger peaks (marked A, B, and C) in the O1s XANES are shown as well. For example, orbital A is populated by the promoted O1s electron in the lowest O1s transition and, in the single-orbital approximation, represents the lowest O1s core-excited state of para-aminophenol.
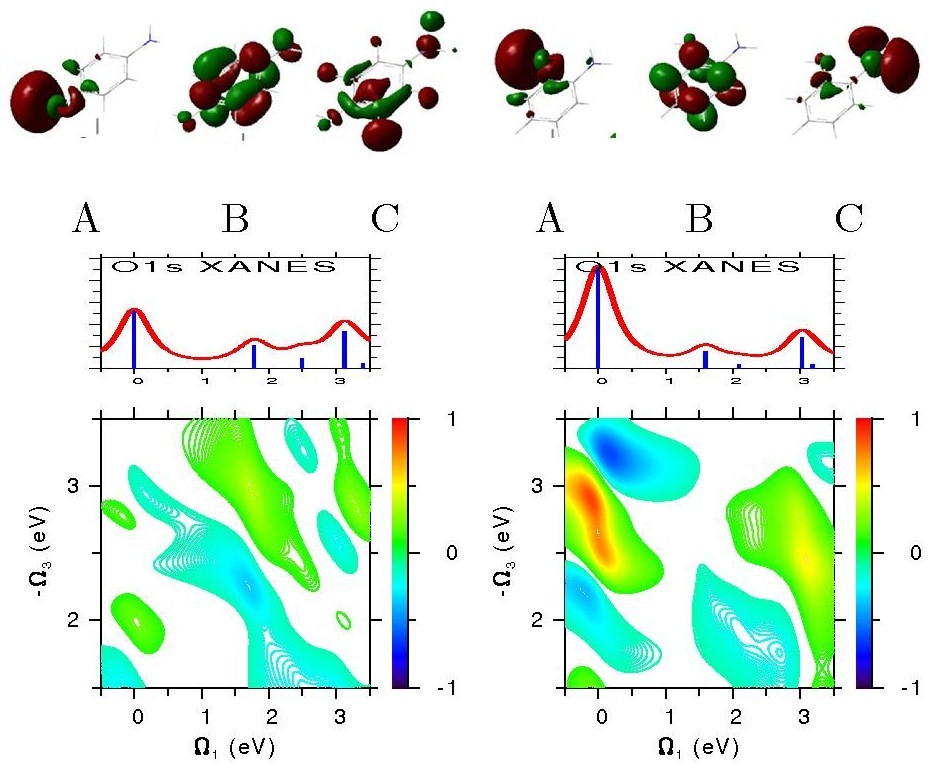
The XANES signals are insensitive to the precise form of the wavefunctions of the corresponding states. For example, despite the difference in the shape of orbital B between two isomers, its profile in the vicinity of the O atom remains the same and so is the corresponding peak in XANES. However, its contribution to the 2DXCS cross peak is markedly different. In the para isomer, orbital B is delocalized and extends over both O and N atoms. Correspondingly, promoting the O1s electron to this orbital significantly affects the N1s transition, resulting in a distinguishable cross peak. In the ortho isomer, orbital B vanishes in the vicinity of the N atom. Promoting the O1s electron does not affect the N1s transitions and the cross peak vanishes. The cross peak thus carries information about the wavefunctions of these states. Similarly, despite a stronger dipole coupling, the contribution of orbital A of para-aminophenol to the cross peak is much weaker than that of orbital B, due to the localization of the former to the O atom. In the ortho isomer, however, the corresponding cross peak is strong, indicating that the atoms are sufficiently close for the N1s transitions to be affected even though the O1s electron remains in the vicinity of the O atom.
In conclusion, we have demonstrated how the off-diagonal part of the 2DXCS spectra depends on the interactions between core transitions, providing information about the electronic states that mediate this interactions. Simulations of the cross peak 2DXCS signal of aminophenol showed that it provides further insights into the wavefunctions of these states beyond the dipole coupling available from XANES. The dependence of the 2DXCS spectra on transitions of different character (valence, core transitions with one and two core electrons excited) makes it particularly challenging for first-principles simulations. Predicting and interpreting the 2DXCS spectra will provide a critical test for electron structure computations and should stimulate the development of accurate methods for excited states of two-electron character.
The 2DXCS measurements proposed here are beyond the capabilities of existing x-ray sources. Generating the required pulse sequences with sub femtosecond duration, high flux and controlled timing and phase will require to overcome many experimental difficulties. Given the calculated values of the N 1s and O 1s transition dipole moments of 0.1 atomic units, the laser focal area of 10-10 cm2, and the surface density on the order of 1014 aminophenol molecules per cm2, we estimate the absorption probability to be on the order of 10-5. In the fully resonant four-wave-mixing signal there is thus 1 generated photon per 1015 incoming photons. Even with the XFEL capability of generating 1013 photons per pulse, high repetition rates and long acquisition times will be necessary to make the experiment feasible. Other experimental challenges include reducing the duration of XFEL pulse Zholents et al. (2004), mainting longitudinal coherence, and generating multiple pulses with controlled timing. The HH sources have the required pulse duration and are fully spatially coherent, but have much lower brilliance Kapteyn et al. (2007). New phase matching technique that works at high photon energies are being developed Cohen et al. (2007). This paper aims at establishing the theoretical basis only, and as it took 20 years to extend this NMR radiowave technology to the infrared and the visible regions, similar time and breakthroughs will be needed to realize these measurements in the x-ray regime.
We wish to thank Professors P.M. Rentzepis and M. Murnane for most useful discussions. The support from Chemical Sciences, Geosciences and Biosciences Division, Office of Basic Energy Sciences, Office of Science, U.S. Department of Energy is gratefully acknowledged.
References
- Stohr (1996) J. Stohr, NEXAFS Spectroscopy (Springer, New York, 1996).
- Chen et al (2001) L. X. Chen et al, Science 292, 262 (2001).
- Bressler and Chergui (2004) C. Bressler and M. Chergui, Chem. Rev. 104, 1781 (2004).
- Chen et al. (2007) J. Chen et al., Chem. Phys. Lett. 437, 50 (2007).
- (5) URL http://ssrl.slac.stanford.edu/lcls.
- Kapteyn et al. (2007) H. C. Kapteyn et al., Science in press (2007).
- Sekikawa et al. (2004) T. Sekikawa et al., Nature 432, 2004 (2004).
- Gagnon et al. (2007) E. Gagnon et al., Science in press (2007).
- Corkum et al. (1994) P. B. Corkum et al., Opt. Lett. 19, 1870 (1994).
- Bartels et al. (2000) R. Bartels et al., Nature 406, 164 (2000).
- Drescher et al. (2002) M. Drescher et al., Nature 419, 803 (2002).
- Zholents et al. (2004) A. A. Zholents et al., Phys. Rev. Lett. 92, 224801 (2004).
- Ernst et al. (1987) R. R. Ernst, G. Bodenhausen, and A. Wokaun, Principles of Nuclear Magnetic Resonance in One and Two Dimensions (Claredon Press: Oxford, 1987).
- Mukamel (2000) S. Mukamel, Annu. Rev. Phys. Chem. 51, 691 (2000).
- Asplund et al. (2000) M. C. Asplund et al., Proc. Natl. Acad. Sci. U. S. A. 97, 8219 (2000).
- Tanaka et al. (2003) S. Tanaka et al., Phys. Rev. A 67, 033818 (2003).
- Brixner et al. (2005) T. Brixner et al., Nature 434, 625 (2005).
- Mukamel (2005) S. Mukamel, Phys. Rev. B 72, 235110 (2005).
- Mukamel (1995) S. Mukamel, Principles of Nonlinear Optical Spectroscopy (Oxford University Press, New York, 1995).
- Nozieres et al. (1969) P. Nozieres et al., Phys. Rev. 178, 1097 (1969).
- Schwarz et al. (1976) W. H. E. Schwarz et al., Chem. Phys. 13, 153 (1976).
- Cohen et al. (2007) O. Cohen et al., Phys.Rev. Lett. in press (2007).