VLBA determination of the distance to nearby star-forming regions
II. Hubble 4 and HDE 283572 in Taurus
Abstract
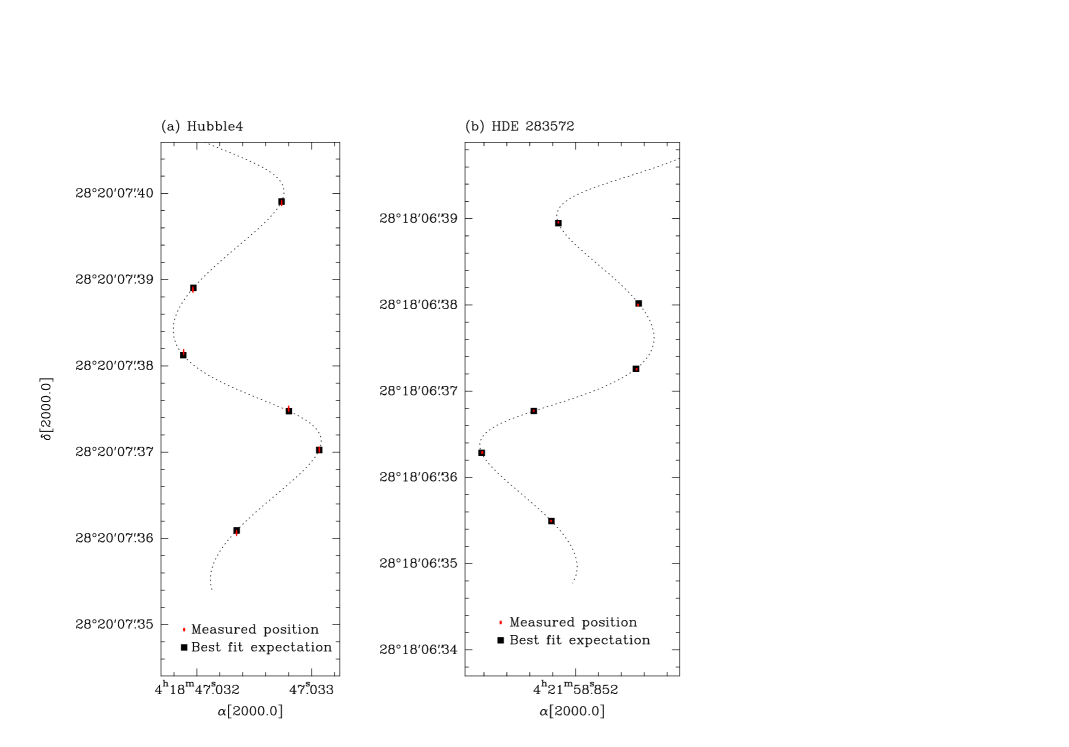
The non-thermal 3.6 cm radio continuum emission from the naked T Tauri stars Hubble 4 and HDE 283572 in Taurus has been observed with the Very Long Baseline Array (VLBA) at 6 epochs between September 2004 and December 2005 with a typical separation between successive observations of 3 months. Thanks to the remarkably accurate astrometry delivered by the VLBA, the trajectory described by both stars on the plane of the sky could be traced very precisely, and modeled as the superposition of their trigonometric parallax and uniform proper motion. The best fits yield distances to Hubble 4 and HDE 283572 of 132.8 0.5 and 128.5 0.6 pc, respectively. Combining these results with the other two existing VLBI distance determinations in Taurus, we estimate the mean distance to the Taurus association to be 137 pc with a dispersion (most probably reflecting the depth of the complex) of about 20 pc.
1 Introduction
While our understanding of the main sequence evolution of Solar-type stars is now very solid, our comprehension of their youth is significantly less advanced. Increasingly detailed pre-main sequence theoretical models, as well as improved observational constraints are clearly needed, and are actively sought (see Klein et al. 2007, White et al. 2007, Güdel et al. 2007 for recent reviews). On the observational front, significant progress is currently being made thanks to large on-going X-ray and infrared surveys of nearby star-forming regions carried out with space observatories (e.g. Evans et al. 2003, Güdel et al. 2007). It should be noticed, however, that some of the stellar parameters (luminosity, mass, etc.) most relevant to constrain theoretical models depend critically both on the quality of the data used to estimate them and on the distance to the object under consideration. Unfortunately, the distance to even the nearest star-forming complexes (e.g. Taurus or Ophiuchus) are not known to better than 20% (Elias 1978a,b, Kenyon et al. 1994, Knude & Hog 1998, Bertout & Genova 2006). This is, in part, a consequence of the fact that the otherwise highly successful Hipparcos mission (Perryman et al. 1997) performed comparatively poorly in star-forming regions (Bertout et al. 1999) because young stars –being still heavily embedded in their parental clouds– are faint in the optical bands observed by Hipparcos.
| Mean UT date | (J2000.0) | (J2000.0) | ||||
|---|---|---|---|---|---|---|
| (yyyy.mm.dd hh:mm) | (mJy) | (Jy) | ||||
| Hubble 4: | ||||||
| 2004.09.19 11:47 | 0.67 | 54 | ||||
| 2005.01.04 04:46 | 0.76 | 73 | ||||
| 2005.03.25 23:44 | 4.66 | 114 | ||||
| 2005.07.04 16:51 | 0.65 | 58 | ||||
| 2005.09.18 11:52 | 1.25 | 53 | ||||
| 2005.12.28 05:15 | 1.53 | 51 | ||||
| HDE 283572: | ||||||
| 2004.09.22 11:35 | 7.13 | 81 | ||||
| 2005.01.06 04:39 | 0.92 | 58 | ||||
| 2005.03.30 23:34 | 1.71 | 65 | ||||
| 2005.06.23 17:34 | 4.23 | 80 | ||||
| 2005.09.23 11:32 | 0.52 | 62 | ||||
| 2005.12.24 05:31 | 0.51 | 47 |
Future space missions such as GAIA will certainly be able to detect stars much fainter than those accessible to Hipparcos, but these missions will still be unable to access the most deeply embedded populations, and are still at least a decade away. Radio observations with Very Long Baseline Interferometers (VLBI) provide an interesting alternative avenue, because they can deliver extremely accurate absolute astrometry (better than 0.1 mas) if proper calibration is applied. In the last few years, such observations have proven capable of measuring the trigonometric parallax of sources within a few kiloparsecs of the Sun with a precision of a few percents (Brisken et al. 2000, 2002, Loinard et al. 2005, 2007, Xu et al. 2005, Hachisuka et al. 2006, Hirota et al. 2007, Sandstrom et al. 2007). Because the sensitivity of VLBI experiments is limited, only compact non-thermal emitters can usually be detected. In star-forming regions, two kinds of such non-thermal sources exist: masers and magnetically active young stars. Masers are ubiquitous in regions where massive stars are formed, but they are absent or unpredictably variable in low- and intermediate mass star-forming sites. Low-mass young stars, on the other hand, tend to have active magnetospheres that can generate detectable non-thermal continuum emission (e.g. André et al. 1992, Feigelson & Montmerle 1999, Dulk 1985). Thus, the distance to nearby star-forming regions can be measured very accurately if adequate non-thermal sources are identified in them, and multi-epoch observations are obtained over the course of a few years. This method has been successfully applied to water and methanol masers in nearby massive star-forming regions (Xu et al. 2005, Hachisuka et al. 2006, Hirota et al. 2007) and to the non-thermal continuum emission associated with low-mass T Tauri stars (Loinard et al. 2005, 2007, Sandstrom et al. 2007). In all these cases, a precision typically an order of magnitude better than previous estimates was achieved. Since adequate non-thermal sources are available in essentially all the nearby sites of star formation, multi-epoch VLBI observations have the potential of improving significantly our knowledge of the space distribution of star-forming regions around the Sun. With this goal in mind, we have initiated a large project aimed at accurately measuring the trigonometric parallax of a sample of magnetically active young stars in the most prominent and often-studied northern star-forming regions within 1 kpc of the Sun (Taurus, Ophiuchus, Perseus, Serpens, and Cepheus; the distance to Orion has already been measured using VLBI techniques–Hirota et al. 2007, Sandstrom et al. 2007) using the 10-element Very Long Baseline Array (VLBA) of the National Radio Astronomy Observatory (NRAO). In the present article, we will concentrate on HDE 283572 and Hubble 4, two young stars in Taurus. This will allow us to examine in more detail the distribution and kinematics of young stars in this important star-forming region.
| Mean UT date | JD | Earth Barycentric coordinates | ||
|---|---|---|---|---|
| (yyyy.mm.dd hh.mm) | Astronomical Units | |||
| Hubble4: | ||||
| 2004.09.19 11:47 | 2453267.99 | 1.006998486 | 0.052084106 | 0.022682627 |
| 2005.01.04 04:46 | 2453374.70 | 0.231331103 | 0.875675935 | 0.379526720 |
| 2005.03.25 23:44 | 2453454.48 | 0.990029933 | 0.069134209 | 0.030092055 |
| 2005.07.04 16:51 | 2453556.20 | 0.228244142 | 0.908947748 | 0.394190784 |
| 2005.09.18 11:52 | 2453631.99 | 1.005815421 | 0.069425778 | 0.030225422 |
| 2005.12.28 05:15 | 2453732.72 | 0.107253794 | 0.898552365 | 0.389430205 |
| HDE 283572: | ||||
| 2004.09.22 11:35 | 2453270.98 | 1.007690418 | 0.005037832 | 0.002285078 |
| 2005.01.06 04:39 | 2453376.69 | 0.265058725 | 0.867496343 | 0.375981760 |
| 2005.03.30 23:34 | 2453460.46 | 0.978622564 | 0.163101149 | 0.070826870 |
| 2005.06.23 17:34 | 2453545.23 | 0.044465499 | 0.930888246 | 0.403696737 |
| 2005.09.23 11:32 | 2453636.98 | 1.007380117 | 0.008930420 | 0.003741574 |
| 2005.12.24 05:31 | 2453728.73 | 0.037702136 | 0.903636825 | 0.391632177 |
Hubble 4 is a K7 naked T Tauri star with an effective temperature of 4060 K (Briceño et al. 2002). It has long been known to have a particularly active magnetosphere that produces non-thermal radio emission characterized by significant variability, large circular polarization and a nearly flat spectral index (Skinner 1993). It was detected in VLBI experiments, with a flux of a few mJy by Phillips et al. (1991), and is also an X-ray source (Güdel et al. 2007). The superficial magnetic field of Hubble 4 has been estimated to be about 2.5 kG using Zeeman-sensitive Ti I lines (Johns-Krull et al. 2004). HDE 283572, on the other hand, is a somewhat hotter ( 5770 K –Kenyon & Hartmann 1995) G5 naked T Tauri star. Early observations with the Einstein satellite showed that it has a fairly bright X-ray counterpart (Walter et al. 1987). It was initially detected as a radio source by O’Neal et al. (1990), and in VLBI observations by Phillips et al. (1991) with a flux of about 1 mJy.
2 Observations and data calibration
In this paper, we will make use of a series of six continuum 3.6 cm (8.42 GHz) observations of Hubble 4 and HDE 283572 obtained roughly every three months between September 2004 and December 2005 with the VLBA (Tab. 1). Our pointing directions were at = , = +, and = , = + for Hubble 4 and HDE 283572, respectively. Each observation consisted of series of cycles with two minutes on source, and one minute on the main phase-referencing quasar J0429+2724 (the same for both targets). Each 24 minutes, we also observed three secondary calibrators (J0433+2905, J0408+3032, and J0403+2600) forming a triangle around the astronomical source (Fig. 1). All four calibrators are very compact extragalactic sources whose absolute positions are known to better than 1 milli-arcsecond (Beasley et al. 2002).

The data were edited and calibrated using the Astronomical Image Processing System (AIPS –Greisen 2003). The basic data reduction followed the standard VLBA procedures for phase-referenced observations. First, the most accurate measured Earth Orientation Parameters obtained from the US Naval Observatory database were applied to the data to improve the values initially used by the VLBA correlator. Second, dispersive delays caused by free electrons in the Earth’s atmosphere were accounted for using estimates of the electron content of the ionosphere derived from Global Positioning System (GPS) measurements. A priori amplitude calibration based on the measured system temperatures and standard gain curves was then applied. The fourth step was to correct the phases for antenna parallactic angle effects, and the fifth was to remove residual instrumental delays caused by the VLBA electronics. This was done by measuring the delays and phase residuals for each antenna and IF using the fringes obtained on a strong calibrator. The final step of this initial calibration was to remove global frequency- and time-dependent phase errors using a global fringe fitting procedure on the main phase calibrator (J0429+2724), which was assumed at this stage to be a point source.
In this initial calibration, the solutions from the global fringe fit were only applied to the main phase calibrator itself. The corresponding calibrated visibilities were then imaged, and several passes of self- calibration were performed to improve the overall amplitude and phase calibration. In the image obtained after the self-calibration iterations, the main phase calibrator is found to be slightly extended. To take this into account, the final global fringe fitting part of the reduction was repeated using the image of the main phase calibrator as a model instead of assuming it to be a point source. Note that a different phase calibrator model was produced for each epoch to account for possible small changes in the main calibrator structure from epoch to epoch. The solutions obtained after repeating this final step were edited for bad points and applied to the astronomical targets and to the main and secondary calibrators.
The astrometry precision of VLBI observations such as those presented here, depends critically on the quality of the phase calibration. Systematic errors, unremoved by the standard calibration procedures described above, usually dominate the phase calibration error budget, and limit the astrometric precision achieved to several times the value expected theoretically (e.g. Fomalont 1999, Pradel et al. 2006). At the frequency of the present observations, the main sources of systematic errors are inaccuracies in the troposphere model used, as well as clock, antenna and a priori source position errors. These effects combine to produce a systematic phase difference between the calibrator and the target, causing position shifts. One effective strategy to measure and correct these systematic errors consists of including observations of more than one phase calibrator chosen to surround the target (Fomalont & Kogan 2005). This allows phase gradients around the source due to errors in the troposphere model or related to uncertainties in the cataloged position of the calibrators, to be measured and corrected. This strategy was applied to our observations using the three secondary calibrators mentioned earlier (Fig. 1), and resulted in significant improvements in the final phase calibration and image quality.
Because of the time spent on the calibrators, only about 5 of the 9 hours of telescope time allocated to each of our observations were actually spent on source. Once calibrated, the visibilities were imaged with a pixel size of 50 as after weights intermediate between natural and uniform (ROBUST = 0 in AIPS) were applied. This resulted in typical r.m.s. noise levels of 50–80Jy beam-1 (Tab. 1). Both sources were detected with a signal to noise ratio better than 10 at each epoch (Tab. 1). The source absolute positions at each epoch (also listed in Tab. 1) were determined using a 2D Gaussian fitting procedure (task JMFIT in AIPS). This task provides an estimate of the position error (columns 3 and 5 of Tab. 1) based on the expected theoretical astrometric precision of an interferometer:
| (1) |
where is the wavelength, the baseline, and the image signal-to-noise ratio (Thompson et al. 1986). In spite of the extra calibration steps taken to improve the phase calibration, uncorrected systematic errors still exist, and must be added quadratically to the values deduced from Eq. 1. These remaining systematic errors are difficult to estimate a priori, and may depend on the structure of the source under consideration. Here, we will estimate these systematic effects from the fits to the data (see below).

3 Results
The displacement of the sources on the celestial sphere is the combination of their trigonometric parallax () and proper motions (). The reference epoch was taken at the mean epoch of each series of observations: JD 24353500 ( 2005.355) for bothy sources. Since the sources considered here appear to be isolated, we considered linear and uniform proper motions. The astrometric parameters were calculated using the SVD-decomposition fitting scheme described by Loinard et al. (2007). The necessary barycentric coordinates of the Earth, as well as the Julian date of each observation were calculated using the Multi-year Interactive Computer Almanac (MICA) distributed as a CDROM by the US Naval Observatory. They are given explicitly in Tab. 2 for all epochs and sources. The best fits give the following parameters:
and
for Hubble 4 and HDE 283572, respectively. The measured parallaxes correspond to distances of 132.8 0.5 pc for Hubble 4, and 128.5 0.6 pc for HDE 283572. The post-fit rms (dominated by the remaining systematic errors mentioned at the end of Sect. 2) is quite good for HDE 283572: 60 as and 90 as in right ascension and declination, respectively. For Hubble 4, on the other hand, the residual is good in right ascension (40 as), but large in declination (240 as). To obtain a reduced of one both in right ascension and declination, one must add quadratically 3.1 microseconds of time and 340 microseconds of arc to the formal errors delivered by JMFIT for Hubble 4, and 4.3 microseconds of time and 115 microseconds of arc for HDE 283572. All the errors quoted in the paper include these systematic contributions.
The origin of the large declination residual for Hubble 4 (which does not affect strongly the parallax determination, because the latter is dominated by the right ascension measurements) is not entirely clear. The fact that the residual is only (or, at least, mostly) detected in declination (Fig. 3) would suggest a calibration issue. Indeed, astrometric fitting of phase-referenced VLBI observations is usually worse in declination than in right ascension (e.g. Fig. 1 in Chatterjee et al. 2004) as a result of residual zenith phase delay errors (Reid et al. 1999). We consider this possibility fairly unlikely here, however, because such a problem would have been detected during the multi-source calibration, and because the observations and reduction of Hubble 4 and HDE 283572 (which does not appear to be affected by any calibration issue) were performed following identical protocols and over the same period of time. Another element that argues against a calibration problem is that the large residual is not the result of one particularly discrepant observation: in addition to the fit mentioned above where all 6 observations of Hubble 4 are taken into account, we made 5 fits where we sequentially discarded one of the epochs. All 5 fits gave similar astrometric parameters, and a similarly large declination residual. Thus, we argue that this large residual might be real, rather than related to a calibration problem. At the distance of Hubble 4, 240 as correspond to 0.032 AU, or about 7 R⊙. Hubble 4 is estimated to have a radius of about 3.4 R⊙ (Johns-Krull et al. 2004), so the amplitude of the residual is just about 2 . Baring this figure in mind, at least two mechanisms could potentially explain the large declination residual: (i) the magnetosphere of Hubble 4 could be somewhat more extended than its photosphere, and the residuals could reflect variations in the structure of the magnetosphere; (ii) Hubble 4 could have a companion, and the residuals could reflect the corresponding reflex motion. Let us examine the pros and cons of these two possibilities.
If the residuals were related to a variable extended magnetosphere, one would expect the emission to be occasionally somewhat extended. Interestingly, Phillips et al. (1991) reported that Hubble 4 was slightly resolved in their VLBI data, and we find it to be resolved also in at least two of our own observations. On the other hand, if the emission were related to variations in the magnetosphere, one would expect to see variations with the periodicity of the rotational period of the star (about 12/sini days –Johns-Krull et al. 2004). Given that the separation between our successive observations is typically three months, we would expect the residuals to be essentially random. Instead, those residuals seem to show a periodicity of about 1.2 years (Fig. 3b). This would be more consistent with our alternative proposal that the residuals be related to the reflex motion of Hubble 4 due to the presence of an unseen companion. The semi-major axis corresponding to a period of 1.2 yr and a mass of 0.7 M⊙ (see below) is just about 1 AU. Since the ratio between the amplitude of the reflex motion and that of the orbital path is the inverse of the ratio between the mass of the primary and that of the companion, the mass of the companion would have to be 0.7(0.032/1) = 0.02 M⊙. The companion would then have to be a very low-mass star, or a brown dwarf. Note, however, that the residuals are relatively poorly constrained with the existing data, and that additional observations aimed –in particular– at confirming the periodicity in the residuals will be needed to resolve this issue.
4 Discussion
4.1 Distance to the Taurus association
HDE 283572 was one of the few Taurus members with a parallax estimate from Hipparcos ( = 7.81 1.30 mas; = 128 pc; Bertout et al. 1999). The present determination is well within 1 of the Hipparcos value, but more that one order of magnitude more precise. Bertout & Genova (2006) estimated the distance to both Hubble 4 ( = 8.12 1.5 mas; = 123 pc) and HDE 283572 ( = 7.64 1.05 mas; = 131 pc) using a modified convergent point method. Again, our values are within 1 of these determinations, but more than one order of magnitude more precise. Only two other Taurus members have VLBI-based distance determinations: T Tau ( = 6.82 0.03 mas; = 146.7 0.6 pc; Loinard et al. 2007) and V773 Tau ( = 6.74 0.25 mas; 148.4 pc; Lestrade et al. 1999). The weighted mean of these four values is = 7.30 mas ( = 137.0 pc) and the r.m.s. dispersion about that mean 0.45 mas ( 9 pc). Although the number of sources with VLBI distances remains small, we argue that the mean value represents a good estimate of the mean distance to the Taurus association, and that the dispersion provides a good guess of its depth. Note, however, that the latter value was calculated as a dispersion; the corresponding full width at half maximum (which may represent a better estimate of the full depth of the complex) is 21 pc. In comparison, the angular size of Taurus projected on the plane of the sky is about 10∘, corresponding to about 23 parsecs at that distance. The significant depth of the complex implies, in particular, that however well measured the mean distance to Taurus may be, using it indiscriminately for all Taurus members will result in systematic errors that may be as large as 15%. For higher precision, accurate individual distances to a larger sample of Taurus members will be needed. VLBI measurements such as those presented here most probably represent the best hope of obtaining such a large sample in the near future.
| Source | (km s-1) | (km s-1) | (km s-1) | (km s-1) | (km s-1) | Referencesaafootnotemark: | |
|---|---|---|---|---|---|---|---|
| Hubble 4 | Observed | 15.0 1.7 | 2.71 0.03 | –18.2 0.2 | 15.1 0.1 | –10.5 0.1 | 1,2 |
| Expected | 9.82 | 1.28 | –8.21 | 6.84 | –4.71 | ||
| HDE 283572 | Observed | 15.0 1.5 | 5.41 0.04 | –16.2 0.1 | 15.55 0.08 | –7.07 0.05 | 1,3 |
| Expected | 9.88 | 1.12 | –8.21 | 6.78 | –4.77 | ||
| T Taubb1=This work; 2=Hartmann et al. 1986; 3=Walter et al. 1988; 4=Loinard et al. 2007; 5=Welty 1995; 6=Lestrade et al. 1999. | Observed | 19.1 1.2 | 8.59 0.04 | –8.90 0.06 | 12.35 0.05 | +0.69 0.03 | 2,4 |
| Expected | 11.35 | 1.22 | –6.53 | 5.74 | –3.34 | ||
| V773 TauccThe radial velocity used here is that of the center of mass of the spectroscopic binary V773 Tau A+B. | Observed | 13.8 0.9 | 0.3 0.2 | –16.4 0.7 | 12.0 0.5 | –11.2 0.5 | 5,6 |
| Expected | 9.71 | 1.48 | –8.16 | 6.89 | –4.62 |
4.2 Kinematics
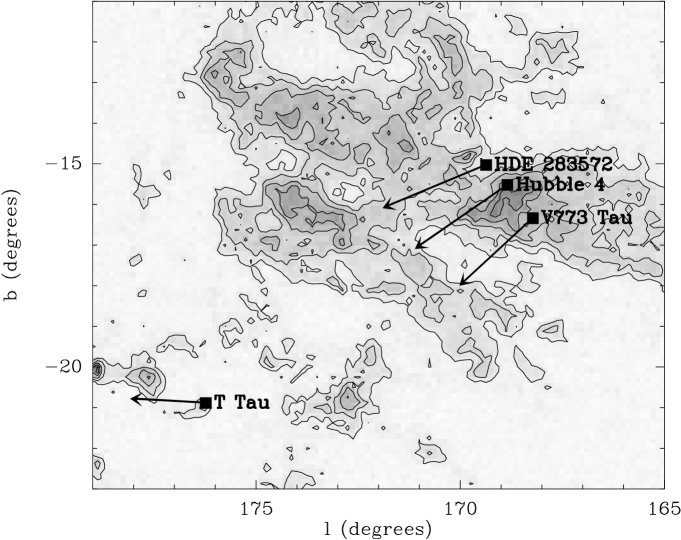
The tangential velocity of the four sources mentioned in the previous section (Hubble 4, HDE 283572, T Tau and V773 Tau) can be deduced from their measured distances and proper motions. Also, for these four sources, radial velocities are available from the literature, so their complete velocity vectors can be reconstructed (Tab. 3, Fig. 4). Hubble 4 and HDE 283572, which are very close on the plane of the sky and are at very similar distances also have very similar space velocities. This strongly suggests that they belong to the same sub-group (but see below). V773 Tau, which in projection also appears near Hubble 4 and HDE 283572 but is at a significantly different distance, has a somewhat different space velocity. Not surprisingly, T Tau, at the south of the Taurus complex, has a significantly different velocity.
The measured radial and tangential velocities can be compared to the values expected from the differential rotation of the Galaxy. The proper motions determined with the VLBA are measured with respect to the Sun. To obtain the corresponding values expected theoretically, we adopt a model for the local rotation of the Galaxy where the Oort constants are A = 14.4 and B = –12.0 km s-1 kpc-1 (Allen 2000) and where the distance from the Sun to the Galactic center is R⊙ = 8.5 kpc. For the peculiar motion of the Sun (required to transform values relative to the local standard of rest [LSR] to the barycentric coordinates provided by the VLBA), we use U⊙; = +9.0, V⊙; = +12.0, and W⊙; = +7.0 km s-1 (Allen 2000). Here, we follow the traditional convention where U runs from the Sun to the Galactic center, V is in the Galactic plane, perpendicular to U and positive in the direction of Galactic rotation, and W is perpendicular to the Galactic plane, positive toward the Galactic north pole. It is noteworthy from the comparison between the observed and expected velocities that the Taurus members considered here have very significant peculiar motions (of amplitude 10 km s-1). Since our measured values are very similar to the mean radial velocities and proper motions in catalogs of optically selected Taurus members (e.g. Ducourant et al. 2005; Bertout & Genova 2006), this large peculiar velocity appears to be characteristic of the entire Taurus complex. This is a notable contrast with the stars in the Orion cluster where the expected and measured mean proper motions agree to better than 0.5 km s-1 (Gómez et al. 2005).
Section 4.1 and the present kinematics analysis show that if a sufficiently large sample of Taurus members had VLBI-based distance determinations, it would become possible to accurately map the three-dimensional distribution of stars in the complex, as well as their detailed kinematics. Using a dynamical analysis, it would then become possible to estimate the total mass of the complex in a way totally independent of the traditionally used molecular observations. Also, coupled with pre-main sequence evolutionary models (see below), it would become possible to study the space distribution of stars as a function of their age, and thereby reconstruct the history of star-formation in Taurus.
4.3 Physical parameters of the stars
Having measured the distance to two stars in Taurus, we are now in a position to recalculate their luminosities, and place them better on an isochrone. We will use here the pre-main sequence evolutionary models of Siess et al. (1997) available on the World Wide Web. The effective temperature of Hubble 4 is 4060 K (Briceño et al. 2002), and its bolometric luminosity scaled with the present distance determination is 2.7 (132.8/142)2 = 2.4 L⊙(Briceño et al. 2002). For HDE 283572, the effective temperature is 5770 (Güdel et al. 2007) and the scaled bolometric luminosity 6.5(128.5/140)2 = 5.5 L⊙. Using these values as inputs for the evolutionary models, we obtain = 0.7 M⊙, = 2.9 R⊙, and = 1.6 M⊙, = 2.2 R⊙, for Hubble 4 and HDE 283572, respectively. The corresponding ages are 0.74 and 9.0 Myr, respectively. This last result is quite surprising because –as mentioned earlier– Hubble 4 and HDE 283572 are very near each other, and share the same kinematics. In these conditions, one would expect them to be coeval. Surprisingly, however, their ages appear to differ by one order of magnitude
5 Conclusions and perspectives
In this article, we have reported multi-epoch VLBA observations of two naked T Tauri stars in the Taurus complex, and used these data to measure their trigonometric parallax and proper motions. Both stars appear to be located at about 130 pc, somewhat nearer than the other two Taurus stars (T Tauri and V773 Tau) with VLBI distance estimates (both are at 147 pc). The declination of Hubble 4 shows small but systematic post-fit residuals that may be the result of an extended, time-variable magnetosphere or of the presence of a companion, low-mass star or brown dwarf.
Hubble 4 and HDE 283572 appear to share the same kinematics, and most probably belong to the same Taurus sub-group. Surprisingly, however, pre-main sequence evolutionary models suggest that their age differ by an order of magnitude. The mean distance to Taurus obtained by averaging all four existing VLBI-based distance estimates is 137 pc, and the depth of the complex appears to be about 20 pc, very similar to the size of the complex projected on the plane of the sky.
It is noteworthy that if observations similar to those presented here were obtained for a significantly larger sample of Taurus members, it would be possible to map the three-dimensional distribution and kinematics of the complex, and establish the history of star-formation in this important nearby star-forming site.
References
- (1) Allen, C. W. 2000, Allen’s Astrophysical Quantities, ed. A. N. Cox (4th ed.; New York: AIP; Springer)
- Andre et al. (1992) André, P., Deeney, B. D., Phillips, R. B., & Lestrade, J.-F. 1992, ApJ, 401, 667
- Beasley et al. (2002) Beasley, A. J., Gordon, D., Peck, A. B., Petrov, L., MacMillan, D. S., Fomalont, E. B., & Ma, C. 2002, ApJS, 141, 13
- (4) Bertout, C., Robichon, N., & Arenou, F., 1999, A&A, 352, 574
- Bertout & Genova (2006) Bertout, C., & Genova, F. 2006, A&A, 460, 499
- (6) Briceño, C., Luhman, K.L., Hartmann, L., et al. 2002, ApJ, 580, 317
- Brisken et al. (2000) Brisken, W. F., Benson, J. M., Beasley, A. J., Fomalont, E. B., Goss, W. M., & Thorsett, S. E. 2000, ApJ, 541, 959
- Brisken et al. (2002) Brisken, W. F., Benson, J. M., Goss, W. M., & Thorsett, S. E. 2002, ApJ, 571, 906
- Chatterjee et al. (2004) Chatterjee, S., Cordes, J. M., Vlemmings, W. H. T., Arzoumanian, Z., Goss, W. M., & Lazio, T. J. W. 2004, ApJ, 604, 339
- Dame et al. (2001) Dame, T. M., Hartmann, D., & Thaddeus, P. 2001, ApJ, 547, 792
- Duchêne et al. (2002) Duchêne, G., Ghez, A. M., & McCabe, C. 2002, ApJ, 568, 771
- (12) Ducourant, C., Teixeira, R., Périé, J.P., Lecampion, J.F., Guibert, J.; Sartori, M.J. 2005, A&A, 438, 769
- (13) Dulk, G.A., 1985, ARA&A, 23, 169
- Elias (1978) Elias, J. H. 1978a, ApJ, 224, 857
- Elias (1978) Elias, J. H. 1978b, ApJ, 224, 453
- Evans et al. (2003) Evans, N. J., II, et al. 2003, PASP, 115, 965
- (17) Feigelson, E.D., & Montmerle, T., 1999, ARAA, 37, 363
- Fomalont (1999) Fomalont, E. B. 1999, Synthesis Imaging in Radio Astronomy II, 180, 463
- (19) Fomalont, E.B., & Kogan, L., 2005, AIPS Memo 111
- Gómez et al. (2005) Gómez, L., Rodríguez, L. F., Loinard, L., Lizano, S., Poveda, A., & Allen, C. 2005, ApJ, 63
- Greisen (2003) Greisen, E.W. 2003, in Information Handling in Astronomy – Historical Vistas, ed. A. Heck (Dordrecht: Kluwer Academic Publishers), 109
- Güdel et al. (2007) Güdel, M., et al. 2007, A&A, 468, 353
- Hachisuka et al. (2006) Hachisuka, K., et al. 2006, ApJ, 645, 337
- Hartmann et al. (1986) Hartmann, L., Hewett, R., Stahler, S., & Mathieu, R. D. 1986, ApJ, 309, 275
- (25) Hirota, T., et al. PASJ, in press (http://arxiv.org/abs/0705.3792)
- (26) Johns-Krull, C.M., Valenti, J.A., & Saar, S.H., 2004, ApJ, 617, 1204
- Kenyon et al. (1994) Kenyon, S. J., Dobrzycka, D., & Hartmann, L. 1994, AJ, 108, 1872
- Kenyon & Hartmann (1995) Kenyon, S. J., & Hartmann, L. 1995, ApJS, 101, 117
- Klein et al. (2007) Klein, R. I., Inutsuka, S.-I., Padoan, P., & Tomisaka, K. 2007, Protostars and Planets V, 99
- Knude & Hog (1998) Knude, J., & Hog, E. 1998, A&A, 338, 897
- (31) Lestrade, J.-F., Preston, R.A., Jones, D.L., et al., 1999, A&A, 344, 1014
- Loinard et al. (2005) Loinard, L., Mioduszewski, A. J., Rodríguez, L. F., González, R. A., Rodríguez, M. I., & Torres, R. M. 2005, ApJ, 619, L179
- Loinard et al. (2007) Loinard, L., Torres, R. M., Mioduszewski, A. J., Rodríguez, L. F., González, R. A., Lachaume, R., Vázquez, V., & González, E. 2007, ApJ, in press
- O’Neal et al. (1990) O’Neal, D., Feigelson, E. D., Mathieu, R. D., & Myers, P. C. 1990, AJ, 100, 1610
- (35) Perryman, M.A.C., Lindegren, L., Kovalevsky, J., et al., 1997, A&A, 323, L49
- (36) Phillips, R.B., Lonsdale, C.J., & Feigelson, E.D., 1991, 382, 261
- Pradel et al. (2006) Pradel, N., Charlot, P., & Lestrade, J.-F. 2006, A&A, 452, 1099
- Reid et al. (1999) Reid, M. J., Readhead, A. C. S., Vermeulen, R. C., & Treuhaft, R. N. 1999, ApJ, 524, 816
- (39) Sandstrom K.M., et al., ApJ, in press (http://arxiv.org/abs/0706.2361)
- Seidelmann (1992) Seidelmann, P. K. 1992, Explanatory Supplement to the Astronomical Almanac, University Science Books, ISBN 0-935702-68-7, 752pp, 1992
- (41) Siess, L., Dufour, E., & Forestini, M. 1997, A&A, 358, 593
- (42) Skinner, L.L., 1993, ApJ, 408, 660
- Thompson et al. (1986) Thompson, A. R., Moran, J. M., & Swenson, G. W. 1986, Interferometry and synthesis in radio astronomy, New York, Wiley-Interscience, 1986
- (44) Walter, F.M., Brown, A., Linsky, J.L., et al. 1987, ApJ, 314, 297
- Walter et al. (1988) Walter, F. M., Brown, A., Mathieu, R. D., Myers, P. C., & Vrba, F. J. 1988, AJ, 96, 297
- Welty (1995) Welty, A. D. 1995, AJ, 110, 776
- White et al. (2007) White, R. J., Greene, T. P., Doppmann, G. W., Covey, K. R., & Hillenbrand, L. A. 2007, Protostars and Planets V, 117
- Xu et al. (2006) Xu, Y., Reid, M. J., Zheng, X. W., & Menten, K. M. 2006, Science, 311, 54