Spectropolarimetry of SN 2006aj at 9.6 days††thanks: Based on observations made with ESO Telescopes at the Paranal Observatory, under programme 76.D-0177(A).
Abstract
Context. The observational technique of spectropolarimetry has been used to directly measure the asymmetries of Supernovae (SNe), Gamma-Ray Bursts (GRBs) and X-Ray Flashes (XRFs).
Aims. We wish to determine if non-axial asymmetries are present in SNe that are associated with GRBs and XRFs, given the particular alignment of the jet axis and axis of symmetry with the line of sight in these cases.
Methods. We performed spectropolarimetry with the Very Large Telescope (VLT) FORS1 instrument of the Type Ic SN 2006aj, associated with the XRF 060218, at V-band maximum at 9.6 rest frame days after the detection of the XRF. Due to observations at only 3 retarder plate angles, the data were reduced assuming that the instrumental signature correction for the Stokes parameter was identical to the correction measured for .
Results. We find SN 2006aj to be highly polarized at wavelengths corresponding to the absorption minima of certain spectral lines, particularly strong for O I 7774Å and Fe II, observed at 4200Å with a polarization 3%. The value of the Interstellar Polarization is not well constrained by these observations and, considering the low polarization observed between 6000-6500Å, the global asymmetry of the SN is . O I and Fe II lines share a polarization angle that differs from Ca II.
Conclusions. SN 2006aj exhibits a higher degree of line polarization than other SNe associated with GRBs and XRFs. The polarization associated with spectral lines implies significant asymmetries of these elements with respect to each other and to the line of sight. This is contrary to the standard picture of SNe associated with GRBs/XRFs, where the axis of symmetry of the SN is aligned with the GRB jet axis and the line of sight.
Key Words.:
supernovae: general — supernovae: individual: (SN 2006aj, 2002ap,2003dh) — techniques:polarimetric1 Introduction
The number of observed core-collapse Supernovae (CCSNe) associated
with Gamma Ray Bursts (GRBs) and X-ray Flashes (XRFs) is still low and
there are few examples of such SNe which have also been observed at
early times with spectropolarimetry: SN 1998bw (GRB 980425;
Patat et al. 2001) and SN 2003dh (GRB 030329;
Kawabata et al. 2003). Here we present spectropolarimetry
of the Type Ic SN 2006aj associated with XRF 060218.
XRF 060218 was
detected on 2006 Feb 18.15 UT by the Swift Burst Alert Telescope
(Cusumano et al. 2006a), and located at
and
by the Swift
X-ray Telescope (Cusumano et al. 2006b). The XRF had a long
duration (s; Ghisellini et al. 2007), and was
reported as being under-luminous and softer than normal GRBs
(Pian et al. 2006). Mirabal & Halpern (2006) reported
optical spectroscopy of the afterglow, at Feb 20.04, revealing nebular
emission features from the host galaxy with .
Fatkhullin et al. (2006) commented that optical spectroscopy of the
afterglow revealed the presence of a Type Ic SN similar to SN 1997ef,
and this SN was subsequently labelled SN 2006aj
(Soderberg et al. 2006a). Pian et al. (2006) and
Modjaz et al. (2006) observed SN 2006aj to have a rapid rise to
V-band maximum in 10 days. Gorosabel et al. (2006) observed
evolution in the R-band linear polarization, from a rapidly evolving
high polarization ( at 3 days following the GRB) and a
lower polarization () after the V-band maximum of the SN
light curve. Late-time spectropolarimetry of SN 2006aj (at 206 rest
frame days after the XRF) showed no polarization to at
, while observations of the nebular spectrum revealed
asymmetric line profiles for
(Mazzali et al. 2007).
2 Observations
Spectropolarimetry of SN 2006aj was acquired on 2006 Feb 28.02, using
the European Southern Observatory (ESO) Very Large Telescope (VLT)
FOcal Reducer and low dispersion Spectrograph (FORS1) instrument in
the spectropolarimetry “PMOS” mode (Appenzeller et al. 1998).
This corresponds to 9.87 days following original detection of the XRF,
and 9.55 days in the rest frame. At this epoch, SN 2006aj was
approaching the solar position, limiting the available observing
time. Due to this constraint, a full spectropolarimetry dataset was
not acquired and, due to the nature of spectropolarimetry
observations, this dataset could not be completed at a later epoch.
Observations of SN 2006aj were acquired with the retarder plate at
only three positions: 00, 450 and 225. Exposure times
were 900s, with the retarder plate positioned at 00 and 450,
and 793s, at 225. The G300V grism was used, with pixel scale
and spectral resolution, measured from arc
lamp calibration spectra, of 12.6Å. The data were reduced in the
standard manner, following the routine outlined by Maund et al. (2007a).
Due to incomplete observations, the Stokes parameters were determined
following the technique of Maund (2007), which assumes that the
“instrumental signature corrections” of the and Stokes
parameters, and , are approximately the
same.
Given the broadness of the spectroscopic features, due to high
expansion velocities (;
Pian et al. 2006), the Stokes parameters were coarsely
re-sampled to 50Å wavelength bins. A correction for the
recessional velocity of the host galaxy was applied to the data, using
derived from the narrow nebular lines observed in this data
(this is completely consistent with previously reported measures of
the recessional velocity; e.g. Mirabal & Halpern 2006).
3 Results and Analysis
The observed Stokes parameters and flux spectrum of SN 2006aj at 9.55 days are presented as Fig. 1. This observation was acquired at the maximum of the V-band (; Modjaz et al. 2006) and bolometric light curves of the SN (Gorosabel et al. 2006; Pian et al. 2006).
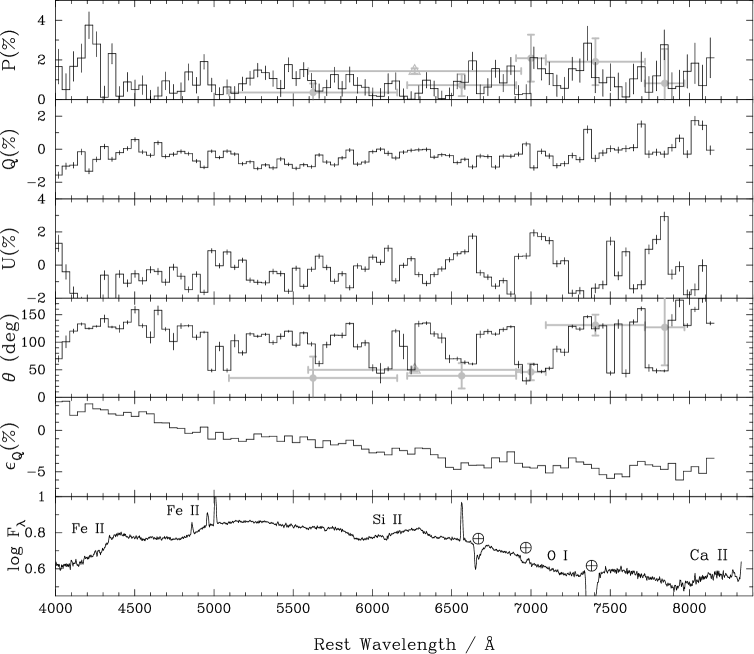
The flux spectrum is composed of a series of broad overlapping
absorption and emission features; the flux spectrum has been
extensively discussed by Pian et al. (2006) and
Modjaz et al. (2006). The polarization spectrum is observed to
be variable over the wavelength range of 1 bin. The wavelength range
of 6000-6500Å is typified by a low level of polarization of
(null polarization at a level). Over the
larger range of 4500-6500Å, the polarization is . The
highest degrees of polarization are 2-4% and associated with features
at the blue and the red extreme of the spectrum. A
wavelength-dependent Interstellar Polarization (ISP) component may be
responsible for some of this polarization, and is discussed later, but
it is clear that significant variability of the polarization spectrum
over small wavelength ranges implies that there is significant
polarization intrinsic to SN 2006aj itself. In addition, we note that
the bulk of the polarization signature derives from the Stokes
parameter, but the features are not correlated with the
instrumental signature correction.
The R-band polarimetry of
Gorosabel et al. (2006), at 13 days after the XRF, is
higher than the spectropolarimetry of three days prior (see
Fig. 1). There is some variability in the
degree of polarization across the observed wavelength range of the
R-band, but there appears no obvious wavelength dependence that would
contribute to the broad-band measurement of
Gorosabel et al.. A region of higher polarization is
observed immediately redward of 7000Å in the rest frame and would
have contributed to the R-band polarization if the recessional
velocity of the host galaxy were lower. Differences between the
polarization and the polarization angle of the spectropolarimetry and
the observations of Gorosabel et al. (2006) are most likely due to
the differences in the epoch at which the respective observations were
conducted.
The rise in the polarization at the red extreme of the
spectrum is most likely associated with O I and the Ca
II IR triplet. There are particular peaks in the polarization
spectrum which, given the correspondence of polarization peaks and
absorption minima of P Cygni profiles in SN spectra
(McCall 1984), can be associated with the absorption
minima of these lines. The polarization peaks correspond to
absorption velocities of O at
and Ca II IR triplet
. The large uncertainties on these
velocities arise from the coarse rebinning of the Stokes parameters to
50Å. At the blue end of the spectrum, the polarization of
at 4200Å is associated with Fe II multiplets 37 and 38
at . We suggest that peaks in the polarization
between 4500-5000Å are due to redder Fe II lines, particularly that
of Fe II at 4850Å, implying a velocity of
. The lower polarization of the redder Fe II
lines is not unexpected, as the bluer Fe II lines of multiplets 37 and
38 have been observed to produce a single P Cygni profile, given the
small difference in wavelength of the constituent lines and the high
velocities observed in SNe, whereas the redder lines can be resolved
(Maund et al. 2007a). We note that these velocities are similar to the
values quoted by Pian et al. (2006) for the photospheric
velocity, measured with the Fe lines, and Mazzali et al. (2006),
who consider an O-dominated shell of ejecta at . There are two minor peaks in
polarization between which may
be associated with Si II , that
Mazzali et al. (2006) identified in spectra.
There is an
additional apparent peak in the polarization spectrum at 7840Å. The
measured polarization, at this wavelength, has a high uncertainty, due
to being coincident with a low S/N portion of the spectrum at a broad
telluric absorption. This feature is not, therefore, intrinsic to the
SN, nor significantly more polarized than the immediately surrounding
wavelengths.
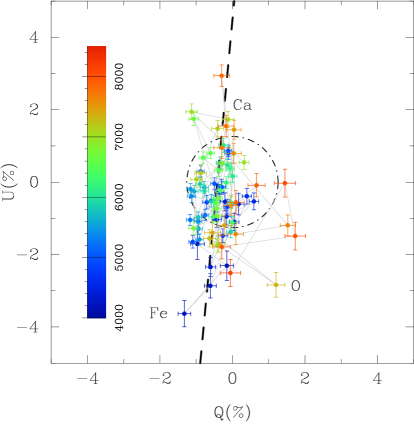
The observed Stokes parameters are plotted on the
plane on Fig. 2. The data conform to an
obvious dominant axis, which is elongated along the axis. Some
degree of elongation along the axis is to be expected, since the
errors on the Stokes parameter are generally double those
determined for . This elongation is, however, substantially larger
than the uncertainties on the parameter, suggesting it is real and
not just due to significant differences between and
. No obvious loops are observed, corresponding to the
Stokes parameters across particular spectral lines, on the plane
(Maund et al. 2007a). This is most likely due to the coarse rebinning
and relatively low level of S/N (). The Stokes parameters
at wavelengths corresponding to different spectral lines are, however,
observed to occupy different portions of the plane. The
polarization angles of the Fe II and O I features are similar and
these spectral features occupy approximately the same location ()
on the plane (see Fig. 2). The Ca II IR
triplet is distinct from the Fe II and O I features, with a
polarization angle offset from Fe II and O I by and
occupying the region of the plane. The dominant axis is
principally defined by those features with the highest polarizations,
which correspond to the Fe II, O I and Ca II absorption features. The
dominant axis is offset from the origin of the plane, which can
be due to the ISP or can be intrinsic to the SN itself
(Maund et al. 2007b).
Schlegel et al. (1998)111http://nedwww.ipac.caltech.edu/ give the
foreground Galactic reddening of , which corresponds to
. Mazzali et al. (2007) report late-time
spectropolarimetry of SN 2006aj, with an upper limit on the total
polarization of (at late times, as the density of
scattering particles decreases ), while
Gorosabel et al. (2006) suggest that the observed R-band
polarization of at days is consistent with
. We note that the data in the wavelength range of
6000-6500Å suggests , for no intrinsic polarization or
ISP depolarization.
There is a peak in the polarization at 5500Å,
which is not matched by an obvious absorption feature in the flux
spectrum. This may well represent the maximum of the ISP, where
, which would be consistent with the ISP estimated by
Gorosabel et al..
4 Discussion and Conclusions
It is particularly important to determine whether the assumption
that is correct. It is clear from
comparison with the data of Gorosabel et al. (2006) that this
assumption is indeed approximately correct, to within .
Examination of the three exposures, at each of the retarder plate
positions, suggests that the observations were not in the regimes
identified by Maund (2007) for which and
are expected to diverge: large gain gradient between
the ordinary and extraordinary rays and polarizations .
Monte Carlo models of the observations, given a signal-to-noise ratio
of at each retarder plate angle, yielded an error on the
instrumental signature correction .
This approach is limited, however, as any defects peculiar to the
observation with the retarder plate at 225 cannot be identified,
having not obtained an observation at 675. As the Stokes
parameters are calculated using normalised flux differences, the
corrections are also flux normalized; the difference in exposures
times only leads to an increase in the uncertainty on due to
Poisson noise as well as .
In
addition, in the ESO archive there are seven spectropolarimetry
datasets of SNe in the 19 days prior to XRF 060218/SN 2006aj and two
sets in the month following (Patat et al. 2007) which, with complete
observations at all four retarder plate positions, give errors on the
instrumental signature corrections, , consistent
with the signal-to-noise and the model presented by Maund (2007).
These observations show no obvious time dependent defects over the
time period immediately surrounding this observation of SN 2006aj.
The caveat that the Stokes parameters were not determined completely
independently must always be remembered when considering these
results.
The wavelength region 5500-6500Å shows the
smallest degree of polarization variability in the polarization
spectrum, where the . A similar polarization spectrum
was observed for SN 1998bw/GRB 980425, with little wavelength
dependence across the same wavelength range (for observations at 7
days before and 10 days after V maximum, although the level of
polarization was lower at the later epoch;
Patat et al. 2001). The polarization across this
wavelength range can be used to place an upper limit on the degree of
global asymmetry of SN 2006aj, assuming that all the polarization is
intrinsic to the SN. Comparison with Hoflich (1991)
shows that this level of polarization requires deviations from a
spherical symmetry of . In the presence of a
substantial ISP, such as that discussed by
Gorosabel et al. (2006), the degree of the asymmetry of the
photosphere would tend to zero. Alternatively, if the polarization
angle of the ISP is fortuitously counter aligned with the polarization
angle of the intrinsic SN polarization, then the ISP would effectively
depolarize the SN. This would yield an underestimation for the
asymmetry of SN 2006aj. Regardless of the ISP, however, the
wavelength-dependence of the polarization, especially coincident with
absorption features in the flux spectrum, is not consistent with a
smoothly varying ISP law. This demonstrates that asymmetries are
significantly present in SN 2006aj.
The high degree of polarization
associated with O I and the Ca II IR triplet in the
data of SN 2006aj is similar to that observed in high-velocity SNe and
other SNe associated with GRBs, such as SN 2003dh/GRB 030329. For SN
2003dh there is a clear rise in polarization at the red end of the
spectrum associated with the approximate location of the O I line, as shown on Fig. 1. The data of
Kawabata et al. (2003) was, however, acquired at days
after the corresponding V-maximum (18 days after the GRB 030329;
Matheson et al. 2003). The wavelength range containing the
Fe II lines was not covered with the spectropolarimetry observations
of SN 1998bw and SN 2003dh. The Fe II lines were observed in SN
2002ap and were less polarized, at at V-maximum, than those
observed in SN 2006aj, and substantially less polarized than the
corresponding O I 7774Å line at 1% (Wang et al. 2003).
The Ca II IR triplet in SN 2006aj is also more polarized than observed
in SN 2003dh (Kawabata et al. 2003).
SN 2006aj does not show
conspicuously higher polarization than other examples of CCSNe. Some
“stripped-core” CCSNe show higher levels of polarization of their
core layers, implying higher degree of asymmetries, over larger
wavelength ranges than observed for SN 2006aj (Maund et al. 2007b). The
highest polarization observed for a Type Ic SN was for
SN 1997X (Wang et al. 2001). In the cases of future, better
observed CCSNe associated with GRBs, for which the ISP can be more
thoroughly measured, the intrinsic polarizations and polarization
angles may have similarities given the preferred orientation of such
objects.
The polarization angles of the Fe II and Ca II lines are
significantly different, and subtraction of an ISP, with constant
polarization angle, would change the absolute values of the
polarization angles of these features, but would not eliminate their
relative offset. The dissimilar polarization angles is suggestive of
different geometries of these species within the ejecta.
Mazzali et al. (2007) note that spectral synthesis models of the
SN 2006aj suggest that the O I, in the late time ejecta, is configured
in a face-on disk, while Ni has an almost spherical geometry. Neither
of these geometries provides the distinct non-axisymmetric component
which would yield such high levels of polarization.
The presence of
strong polarization associated with lines points to an asymmetric
distribution of these elements with respect to the angle at which SN
2006aj is observed. Importantly, SN 2006aj was observed with a
specific orientation, with the line of sight and the jet axis being
coincident. Pian et al. (2006) rule out the scenario of XRF
060218 having been observed significantly off-axis, such that an
axisymmetric SN would appear polarized due to inclination effects. If
the jet axis defines the axial symmetry, then the presence of
asymmetry as observed as polarization is difficult to rectify with the
axisymmetric standard model of the SNe-GRBs (Woosley & Bloom 2006).
Alternatively, if the jet opening angle is large (e.g.
measured by Soderberg et al. (2006b) from the
radio light curve of SN 2006aj) the line of sight may be significanty
inclined with respect to the expected axis of symmetry of the progenitor
and the SN, but still allow the prompt emission to be observed.
The wavelength-dependent polarization observed, at later epochs, for SN
2003dh implies that the presence of such asymmetries is not limited to SN
2006aj, and is a property of SNe associated with GRBs.
References
- Appenzeller et al. (1998) Appenzeller, I., Fricke, K., Furtig, W., et al. 1998, The Messenger, 94, 1
- Cusumano et al. (2006a) Cusumano, G., Barthelmy, S., Gehrels, N., et al. 2006a, GRB Coordinates Network, 4775, 1
- Cusumano et al. (2006b) Cusumano, G., Moretti, A., Tagliaferri, G., Kennea, J., & Burrows, D. 2006b, GRB Coordinates Network, 4786, 1
- Fatkhullin et al. (2006) Fatkhullin, T. A., Sokolov, V. V., Moiseev, A. V., Guziy, S., & Castro-Tirado, A. J. 2006, GRB Coordinates Network, 4809, 1
- Ghisellini et al. (2007) Ghisellini, G., Ghirlanda, G., & Tavecchio, F. 2007, MNRAS, 375, L36
- Gorosabel et al. (2006) Gorosabel, J., Larionov, V., Castro-Tirado, A. J., et al. 2006, A&A, 459, L33
- Hoflich (1991) Hoflich, P. 1991, A&A, 246, 481
- Kawabata et al. (2003) Kawabata, K. S., Deng, J., Wang, L., et al. 2003, ApJ, 593, L19
- Matheson et al. (2003) Matheson, T., Garnavich, P. M., Stanek, K. Z., et al. 2003, ApJ, 599, 394
- Maund (2007) Maund, J. 2007, A&A, Submitted
- Maund et al. (2007a) Maund, J., Wheeler, J., Patat, F., et al. 2007a, MNRAS, Accepted
- Maund et al. (2007b) Maund, J., Wheeler, J., Patat, F., et al. 2007b, ApJ, Accepted
- Mazzali et al. (2006) Mazzali, P. A., Deng, J., Nomoto, K., et al. 2006, Nature, 442, 1018
- Mazzali et al. (2007) Mazzali, P. A., Foley, R. J., Deng, J., et al. 2007, ApJ, 661, 892
- McCall (1984) McCall, M. L. 1984, MNRAS, 210, 829
- Mirabal & Halpern (2006) Mirabal, N. & Halpern, J. P. 2006, GRB Coordinates Network, 4792, 1
- Modjaz et al. (2006) Modjaz, M., Stanek, K. Z., Garnavich, P. M., et al. 2006, ApJ, 645, L21
- Patat et al. (2007) Patat, F., Baade, D., Höflich, P. A., et al. 2007, A&A
- Patat et al. (2001) Patat, F., Cappellaro, E., Danziger, J., et al. 2001, ApJ, 555, 900
- Pian et al. (2006) Pian, E., Mazzali, P. A., Masetti, N., et al. 2006, Nature, 442, 1011
- Schlegel et al. (1998) Schlegel, D. J., Finkbeiner, D. P., & Davis, M. 1998, ApJ, 500, 525
- Soderberg et al. (2006a) Soderberg, A., Berger, E., & Schmidt, B. 2006a, IAU Circ., 8674, 2
- Soderberg et al. (2006b) Soderberg, A. M., Kulkarni, S. R., Nakar, E., Berger, E., Cameron, P. B., Fox, D. B.,Frail, D., Gal-Yam, A., et al. 2006b, Nature, 442, 1014
- Wang et al. (2003) Wang, L., Baade, D., Höflich, P., & Wheeler, J. C. 2003, ApJ, 592, 457
- Wang et al. (2001) Wang, L., Howell, D. A., Höflich, P., & Wheeler, J. C. 2001, ApJ, 550, 1030
- Woosley & Bloom (2006) Woosley, S. E. & Bloom, J. S. 2006, ARA&A, 44, 507