Resolving the Multiple Outflows in the Egg Nebula with Keck II Laser Guide Star Adaptive Optics
Abstract
The Egg Nebula has been regarded as the archetype of bipolar proto-planetary nebulae, yet we lack a coherent model that can explain the morphology and kinematics of the nebular and dusty components observed at high-spatial and spectral resolution. Here, we report on two sets of observations obtained with the Keck Adaptive Optics Laser Guide Star: H to M-band NIRC2 imaging, and narrow bandpath K-band OSIRIS 3-D imaging-spectroscopy (through the H2 2.121m emission line). While the central star or engine remains un-detected at all bands, we clearly resolve the dusty components in the central region and confirm that peak A is not a companion star. The spatially-resolved spectral analysis provide kinematic information of the H2 emission regions in the eastern and central parts of the nebula and show projected velocities for the H2 emission higher than 100km s-1. We discuss these observations against a possible formation scenario for the nebular components.
Keywords:
CRL 2688, post-AGB, PPN, Adaptive Optics1 Introduction
The Egg Nebula is a prototypical bipolar pre-planetary nebula (PPN):
in the optical, the direct light from the central star is obscured by
dust, while two lobes aligned along a “polar axis” scatter the starlight
towards the
observer sahai98a .
Yet, at longer wavelengths, the Egg Nebula reveals a more complex
geometry:
multiple CO outflows in the equatorial plane and at higher
latitude cox00 ; dusty knots (peak A) and a dark
lane at a PA=140∘ goto02 ; and
H2 (2.12m) emission line spatially coincident with the obscuring
dust in the equatorial plane kastner04 .
The models presented in sahai98b or goto02 don’t
explain some of these
features such as the existence of the multiple outflows.
We present some of the near-infrared imaging and imaging-spectroscopy
results at high spatial (0.1 ) and spectral (60km s-1)
resolution from the Egg Nebula obtained with the Keck II
Laser Guide Star Adaptive Optics (LGS-AO) System.
These LGS-AO images of the central regions show details
on the dusty knots and the H2 emission with
un-precedent spatial
resolution. Combined with ACS/HST F606W images and LGS-AO 3-D imaging
spectroscopy through the H2 line, we analyze
the detailed structure of the outflows for the eastern part of the
nebula. We tentatively propose that multiple highly collimated
outflows, launched by intermittent and precessing mechanism
could explain the Egg morphology. A paper describing the full
NIRC2 imaging data set, compared to visible HST ACS and
including an analysis of the 3-D imaging spectroscopy over
all outflows is in preparation lemignant08 .
2 NIRC2 imaging and OSIRIS imaging-spectroscopy
In July 2004, we used the AO-dedicated near infrared camera NIRC2 behind the Keck II Laser Guide Star (LGS) Adaptive Optics (AO) system wizinowich06 , vandam06 , to record broad-band and narrow-band images. Earlier LGS-AO observations of the Egg were reported in bouchez04 and suffered from variable image quality. Later in 2006, we were allocated Director’s Keck II LGS time for imaging spectroscopy of the Eastern and Center regions of the CRL2688 using OSIRIS, the AO-dedicated Integral Field Unit larkin06 . Table 1 summarizes the observations presented here.
| Region | Instrument | Spatial sampling | Filter | ||
|---|---|---|---|---|---|
| 5 5 centered | NIRC2 | 0. 01/pix | Lp | 3.78 | 0.70 |
| 5 5 centered | NIRC2 | 0. 01/pix | Ms | 4.67 | 0.24 |
| 10 10 centered | NIRC2 | 0. 01/pix | Kp | 2.12 | 0.35 |
| 40 40 centered | NIRC2 | 0. 04/pix | H2ν=1-0 | 2.121 | 0.034 |
| 40 40 centered | NIRC2 | 0. 04/pix | Kcont | 2.270 | 0.030 |
| 4 6 centered | OSIRIS | 0. 1/lenslet | Kn2 | 2.089 | 0.105 |
| 4 6 on east | OSIRIS | 0. 1/lenslet | Kn2 | 2.088 | 0.105 |
2.1 Results from NIRC2 Imaging
A spatial resolution of 70 milli-arcsec was estimated from the NIRC2 wide-camera images. All NIRC2 wide camera images were registered against archived ACS WFC1 F606W observations from October 2002 (data set j8gh55010, P.I. R. Sahai)
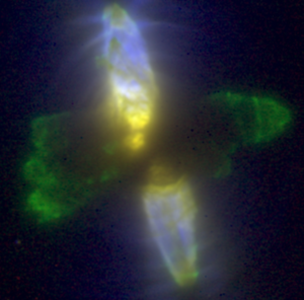
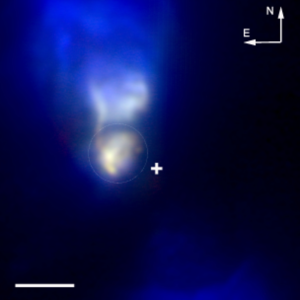
Fig. 1 displays a color-combined NIRC2 and HST image and a color-combined NIRC2 image (see caption). There are a few noticeable features: 1) the visible (blue) light is primarly scattered inside the two N and S lobes and along the two searchlight beams sahai98a ; the scattered light in the K cont., Lp and Ms band is also seen along the N and S lobes and closer to the central hidden star. Except for the N/S lobes, the only other location where scattered light is seen in the NIR is around peak A weintraub00 ; there is no detection of K, Lp or Ms continuum emission in the equatorial region, indicating a total absence of continuum scattered light in this region; 2) the H2 emission regions appear as dense knots, filaments and arcs spatially coincident with the edges of the obscuring/scattering dust knots seen along the N/S lobes, at the tips of the outflows in the equatorial region, and at the tips of the mid-latitude mulitple outflows, some of them, G1, E1, D1, reported in the lower resolution CO maps from cox00 ; 3) the 2004 Lp and Ms images show that peak A is now well-resolved into a 0. 5 dusty knot with a complex structure, possibly indicative of a nascent outflow in the direction towards the observer; in the same image, there is a unresolved wiggling filamentary structure bridging from the N lobe onto peak A that could be indicative of highly-collimated processes (e.g., a precessing jet) in the vicinity of the central engine.
2.2 Results from OSIRIS Imaging Spectroscopy
Two regions in the Egg nebula were observed using OSIRIS: one centered on the central star, the second one centered on the East H2 emission region. The lenslet choice of 0. 1 (in order to cover 4 6 area at once) defines our spatial resolution. The data was reduced using the OSIRIS Data Reduction Pipeline.
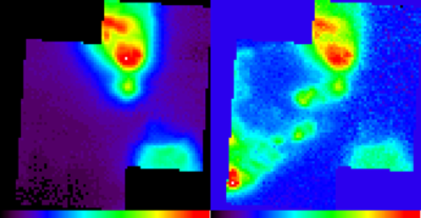
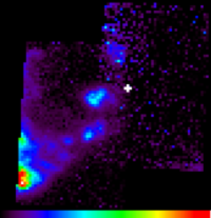
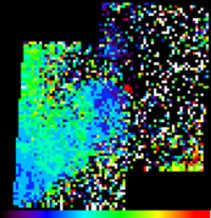
Fig. 2 (upper row)
shows a mosaic of the two
regions observed, as the average over the cube or
over the H2 (2.12m) line.
A 421-channel spectrum for each 0. 10. 1 spaxel
over the 2.036–2.141mrange was extracted and corrected for
telluric absorption. The emission features include H2 S(1) (1,0)
(2.1218m), H2- S(3) (2,1) (2.073m) and HeI (2.1298m)
whereas the He I 4s 3S-3p 3P0 (2.1133m) is detected in absorption.
A spectral resolution of 60 km s-1 has been measured on the
unresolved telluric OH lines. For each spaxel, we fit a continuum and a
gaussian profile through the H2 emission line and
extracted relative integrated intensity, velocity dispersion
and line peak centroid.
The map of continuum-subtracted H2 flux (see Fig. 2 bottom
left) shows that the H2 emission
is not uniformly distributed over the observed region, but rather
appears as 4 to 6 clumpy knots of angular size of
1 or less, roughly aligned along an arc joining the East
lobe to the N lobe. None of these clumps is superimposed with peak A
location.
The shift in peak centroid is displayed on the
right-most image. We measure a velocity shift amplitude for this part
of the nebula of 100km s-1, a factor 2 higher than previous
work kastner01 . The highest projected velocities are found
near (but not at) peak A, at smaller spatial scales (
0. 3) which could not be probed in earlier studies. The
high-velocity
outflows north of the central star (cross) coincide
with the clumpy H2 knots closer to the N lobe and
could be associated with a precessing jet, suggested in 2.1.
3 Discussion and conclusion
From the preliminary analysis of our data sets, we conclude
1) the absence of continuum light in most
ouflows, 2) a distribution of H2 emission coincident with dense, dusty
clumps, 3) a possible nascent outflow at the peak A location,
and 4) the existence of fast highly-collimated ouflows,
possibly jets.
We stress that any qualitative model must account for the
non-detection of continuum light in the equatorial outflows,
in contrast to the polar ones.
The continuum light from the central star must be heavily
obscured either in the equatorial ouflow cavity or before
it reaches the cavity.
We speculate
a possible shaping mechanism that could account for these
observables:
the central engine of the Egg is
heavily obscured by a cocoon of
dust and intermittent jet-like outflows may be launched by
MHD mechanisms within the vicinity of the central
engine blackman07 .
An outflow would break through the dust cocoon, heating and
dissipating the surrounding dust and expands for a few hundreds of
years ueta06 .
The continuum starlight would propagate through the cavity and be
scattered. H2 shocked
emission would be
detected primarly at the tip of the outflow.
Eventually, the
continuum starlight becomes heavily obscured by dust again.
In addition, new outflows would be launched rapidly and account for the
multiple outflows with comparable dynamical age cox00 .
The outflows where only H2 shocked emission
is detected would correspond to past outflows.
We are currently completing LGS high-spatial
imaging spectroscopy
over the entire nebula to further constrain the kinematics
and discuss the possible launch mechanism for the outflows.
References
- (1) Sahai, R. et al. 1998, ApJ, 493, 301-311
- (2) Cox, P. et al. 2000, A&A, 353, L25-28
- (3) Goto et al. 2002, ApJ, 572, 276
- (4) Kastner, J. H. and Soker, N. 2004, ASP Conf. Series, Vol. 313, 57
- (5) Sahai, R. et al. 1998, ApJ, 492, L163-167
- (6) Le Mignant, D. et al. 2008, ApJ, in prep.
- (7) Bouchez, A. H., et al. 2004, Proc. SPIE, 5490, 321
- (8) Wizinowich, P. L., et al. 2006, PASP, 118, 297
- (9) van Dam, M. A., et al. 2006, PASP, 118, 310
- (10) Larkin, J., et al. 2006, New Astronomy Review, 50, 362
- (11) Weintraub, D. et al. 2000, ApJ, 531, 401
- (12) Kastner, J. H. et al. 2001, ApJ, 546, 279-287
- (13) Blackman, E. G. 2007, this conf.
- (14) Ueta, T. et al. 2006, ApJ, 641, 1113-1121