Present address: ]Brookhaven National Laboratory, Condensed Matter Physics and Materials Science Dept., Bldg #510B Upton, NY, 11973-5000, USA
Present address: ]Dept. of Physics, Osaka University, Machikaneyama 1-1, Toyonaka, 560-0043, Japan
Resonant x-ray scattering study of NpRhGa5 and NpCoGa5
Abstract
We report a resonant x-ray scattering (RXS) study of antiferromagnetic neptunium compounds NpCoGa5 and NpRhGa5 at the Np and Ga -edges. Large resonant signals of magnetic dipole character are observed below the Néel temperatures at both edges. The signals at the Np edges confirm the behaviour determined previously from neutron diffraction, i.e. the moments along in NpCoGa5 and in NpRhGa5 a reorientation of the moments from the -axis direction to the plane. In the latter material, on application of magnetic field of 9 Tesla along the direction we observe a change in the population of different -type domains. We observe also a magnetic dipole signal at the Ga -edge, similarly to the reported UGa3 case, that can be interpreted within a semi-localized model as an orbital polarization of the Ga states induced via strong hybridization with the Np valence band. Quantitative analysis of the signal shows that the Ga dipole on the two different Ga sites follows closely the Np magnetic moment reorientation in NpRhGa5. The ratios of the signals on the two inequivalent Ga sites are not the same for the different compounds.
pacs:
75.25.+z, 75.30.Kz, 78.70.CkI Introduction
The recent discovery of unconventional superconductivity in PuCoGa5 and PuRhGa5 Sarrao et al. (2002); Wastin et al. (2003) with relatively high superconducting temperatures K and 8 K, respectively, has resulted in considerable interest in the electronic properties of materials with electrons. Both experimental Sarrao et al. (2002); Wastin et al. (2003); Curro et al. (2005) and theoretical Opahle and Oppeneer (2003); Opahle et al. (2004); Shick et al. (2005); Pourovskii et al. (2006) studies indicate that magnetic interactions might be important for understanding the pairing mechanism in these compounds. Therefore, investigation of the related U and Np-115 compounds is of interest with respect to the general properties of the actinide, , and transition metal, , isostructural Ga5. UGa5 systems exhibit a variety of properties, ranging from Pauli paramagnetism in UCoGa5 Sechovský et al. (1992); Moreno et al. (2005); Troć et al. (2004), to antiferromagnetism in UNiGa5 Kaneko et al. (2003). On the other hand, NpGa5 compounds all show strong magnetic ordering Colineau et al. (2004); Metoki et al. (2005); Jonen et al. (2006a, b); Honda et al. (2006a, b); Metoki (2006).
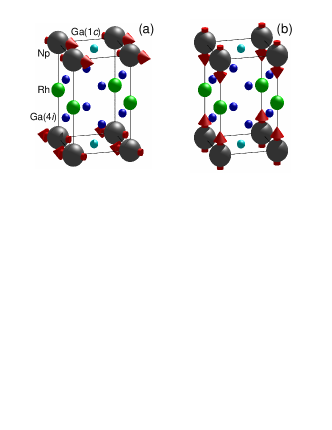
NpCoGa5 and NpRhGa5 crystallize in the tetragonal HoCoGa5-type structure which belongs to the space group (no. 123), similarly to other actinide-based “115” compounds, including PuCoGa5, see Fig. 1. In this structure, actinide atoms occupy the positions, transition metal ions are in the positions (half-way between the actinide atoms along the -direction) and there are two crystallographic positions for Ga: one atom in the center of the basal planes (, addressed as Ga(1) in this paper), and 4 atoms in the position, in the rectangular faces of the unit cell (Ga(2)) with a position (0 1/2 ). The Ga(1) site has 4 nearest Np neighbors, whereas the Ga(2) site has only two. For NpCoGa5, with Colineau et al. (2004), the nearest Ga neighbours of Np are at 2.964 Å (Np – Ga(2)) and 2.997 Å (Np – Ga(1)). In NpRhGa5, with Colineau et al. (2005), the Np – Ga interatomic distances are very close for Np – Ga(1) and Np – Ga(2), namely 2.964 and 2.963 Å, respectively.
For a diffraction experiment the crystal symmetry has an important feature: taking into account the magnetic propagation vector , a general magnetic diffraction peak of the type will always have a contribution from Ga(1) position, but Ga(2) will contribute only to reflections with even, allowing the possibility to observe Ga(1) signal separately at odd.
Resonant x-ray scattering (RXS) is a technique complementary to neutron diffraction for determining the magnetic structure of materials. In the case of actinides, the use of RXS presents an advantage over neutrons as significantly smaller samples can be studied, minimizing the safety restrictions imposed by the radiotoxicity of actinide isotopes.
In the RXS process, a photon is virtually absorbed by a core level electron, which is promoted into an empty valence band state. The virtual excited state (core hole + photoelectron) then decays under emission of the scattered photon. The sensitivity of RXS to magnetism and orbital ordering arises from the periodic variation of the density of states near the Fermi level that are probed by the virtual photoelectron Blume (1985); Gibbs et al. (1988). The intensity of the superlattice reflections increases dramatically as the photon energy is tuned to the atomic absorption edge of the resonant ion. Information can be obtained by measuring the polarization-dependent scattering intensity at forbidden Bragg positions as a function of photon energy and azimuthal rotation angle (the angle describing the rotation of the crystal about the scattering vector). Direct information on the magnetic polarization of the Np states is obtained at the Np and -edges, as electric dipole transitions involve the promotion of a core electron to an empty state. Dipole transitions at the Ga -edge, on the other hand, involve the promotion of a core electron of Ga to an empty state.
Resonant scattering intensities with magnetic dipole symmetry at the -edge of nominally nonmagnetic ions, such as Ga, have been reported previously for uranium compounds where the U sublattice is magnetically ordered Mannix et al. (2001); Kuzushita et al. (2006); Normile et al. (2007). The effect is related to the large spatial extent of states within a broad energy band around the Fermi level making them sensitive to the electronic structure at neighboring sites. Although the states of Ga are not spin-polarized, orbital polarization can be induced by hybridization with the U states van Veenendaal (2003); Usuda et al. (2004). To our knowledge, no previous reports have been made of a similar phenomenon in a Np compound. Since, in general, increased localization is anticipated when the number of electrons increases, this is not an obvious result.
II Experimental methods
Single crystals of NpRhGa5 and NpCoGa5 were grown by a Ga self-flux method at the Institute for Transuranium Elements, in Karlsruhe. Samples with and surfaces were cut for the experiments and encapsulated in a copper container with a Be window for x-ray optical access.
Experiments were carried out on the magnetic scattering beamline ID20 at the European Synchrotron Radiation Facility, Grenoble, France. By tuning the undulators to their first or third harmonic, both Np -edge ( keV) and Ga -edge ( keV) were reached. A liquid nitrogen cooled Si(111) double monochromator and two vertically focusing Si mirrors provided a beam of 0.4 x 0.4 mm2 at the sample position Paolasini et al. (2007).
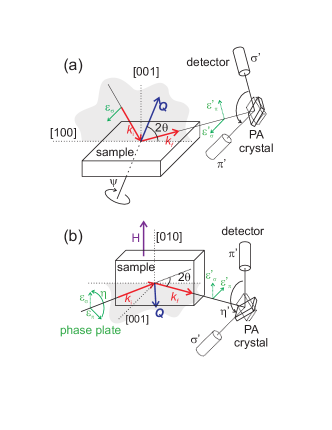
Two distinct scattering geometries and different sample environments were used: for measuring the azimuthal dependence of the superlattice peaks intensity, the sample capsule was mounted in a 4He closed-cycle cryostat with base temperature of about 12 K. A vertical scattering geometry on a 5-circle diffractometer with incident x-ray polarization was used (see Fig. 2a). In an azimuthal scan the sample rotates about the scattering vector, which implies a change of the angle between the incident electric field and the crystal axes. The resulting intensity oscillations give information on the symmetry and the orientation of the scattering tensor. In the vertical geometry, the instrumental setup does not support a heavy sample environment. The high magnetic field study on NpRhGa5 was therefore performed in the second experimental hutch of ID20, using a horizontal geometry six-circle diffractometer equipped with a 10 T vertical split-pair superconducting magnet. In this geometry (Fig. 2b), the incident light polarization is , i.e. with the electric field vector lying in the scattering plane. Due to the restrictions imposed by the 10 T cryomagnet, an azimuthal scan is not possible. A polarization scan, giving similar information as the azimuthal one, can be performed using a phase-plate technique: instead of rotating the sample, the incident light polarization is turned from to : a diamond phase plate of thickness m with a surface and the Bragg reflection can be operated in the half-wave plate mode so that the incident linear polarization can be rotated into an arbitrary plane by rotating the diamond crystal about the incident beam direction Bouchenoire et al. (2006); Mazzoli et al. (2006).
In all the scattering geometries, polarization analysis of the scattered beam was performed using the reflection from a Au crystal for data at the Np -edge and pyrolitic graphite at the Ga -edge. These crystals, acting as polarization filters, were chosen because of their -spacings ( Å, Å) that give Bragg diffraction close to the angle of at the corresponding energies.
When the phase plate technique is used in the polarization scan, full polarization analysis of the scattered beam is necessary in order to determine the Stokes parameters and by fitting the measured intensity to the function
| (1) |
where the angle describes the rotation of the polarization analyzer around the scattered beam and is the leakage, or component from the other polarized state. This arises due to the difference between the actual Bragg angle on the polarization analyzer and the ideal value of .
From another point of view, and can be defined as
| (2) |
and
| (3) |
where and are the two components of the electric field vector of the scattered photons Born and Wolf (1999). is a measure of phase relation between and signals.
However, the polarization analysis is not complete as only the and components can be measured in this way, but a distinction between a depolarization and an occurrence of a circularly polarized component can be made on the basis of experimental data and simulations, because the degree of linear polarization is closely related to the total beam polarization . A real x-ray beam will have (due to the finite efficiency of the phase plate) but it stays constant during a phase plate scan.
III Resonance effects
For better understanding of the magnetism in these compounds, searches for RXS signals were performed at the Np and Ga -edges in both NpCoGa5 and NpRhGa5. Resonant signals were found at positions in the reciprocal space corresponding to the magnetic propagation vector , i.e. ordering wavevectors previously found by neutron diffraction Metoki et al. (2005); Jonen et al. (2006a). In both compounds, all resonant signals were polarized, indicating that they arise from magnetic dipole order.
In NpCoGa5, resonances were found both at Np and -edges, with the former much stronger and with a maximum at keV. Further data on the Np sublattice were recorded at this energy. Superlattice diffraction peaks corresponding to the propagation were found also at Co -edge ( keV) but the energy dependence of the signal suggests that it is non-resonant in character.
The Np resonant spectra from both NpCoGa5 and NpRhGa5 are shown in the top panel of Fig. 3. The slightly different widths of the two curves are due to the different mode of data collection. The spectral shape of the curve for the Np -edges appears much as found in previous studies, a single Lorentzian signal with a full-width at half maximum (FWHM) of eV Longfield et al. (2002) showing the resonances are, as expected, E1-F[1] in nature Hill and McMorrow (1996).
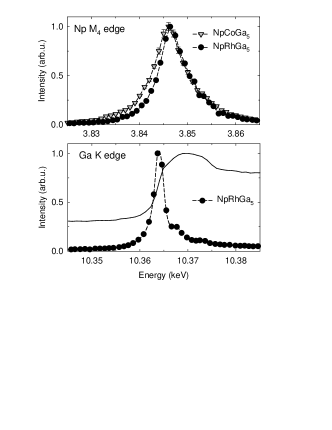
The Ga -edge resonance is also similar to those found for uranium compounds Mannix et al. (2001); Kuzushita et al. (2006), centered close to the the absorption edge, but with perhaps a small “bump” on the high-energy side. The energy width of the resonance in the Co compound was larger than in the Rh one, by about 50%. This is a similar situation to that reported in UNiGa5 and UPdGa5 Kuzushita et al. (2006), where the compound (UNiGa5) has a larger width at the Ga -edge than the compound with the transition-metal ion (UPdGa5). As the magnetic structures of the two UGa5 compounds differ, the effects are more difficult to compare. However, taken together with the present data, they provide rare direct evidence for the influence of the transition metal on the valence bands and the magnetic exchange coupling.
IV Experiments using the resonances
The large resonant enhancement at the Ga -edge observed in UGa5 compounds Kuzushita et al. (2006) is present also in NpGa5 system, giving us the possibility to study, indirectly, the hybridization between the Np and Ga sublattices. Furthermore, the crystal structure of these compounds allows us to separate signal originating from two crystallographically inequivalent Ga positions in the lattice by examining different reflections with even and odd, which was not done in the case of the UGa5 systems.
IV.1 NpCoGa5
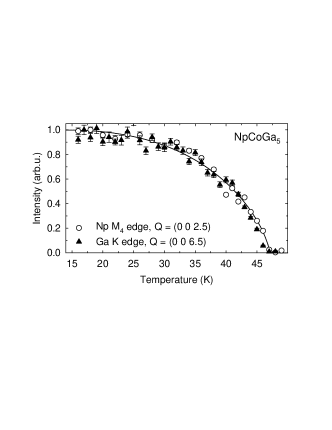
Fig. 4 shows a comparison of the temperature dependence of Np and Ga -edge signals in NpCoGa5 in the rotated polarization channel . In both cases a specular magnetic Bragg reflection is shown. For the Ga -edge this type of reflection includes contribution from the two crystallographically inequivalent Ga positions. The match in the temperature dependence of the two resonant signals indicates a common origin of the scattering process associated with the antiferromagnetic (AF) state. The Néel temperature of K deduced from our measurements is in good agreement with the previous bulk measurements Colineau et al. (2004) and neutron diffraction data Metoki et al. (2005). The Ga -edge data were collected with the primary beam attenuated by m aluminium foil corresponding to transmission of about 15%. Such an attenuation was found necessary to avoid local beam heating of the sample at the Ga -edge.
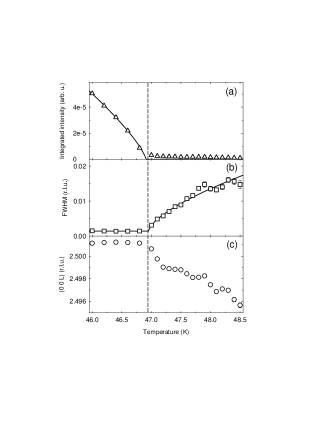
The temperature dependence of the Np -edge signal in NpCoGa5 was measured in more detail at (see Fig 5). Figure 5(a) shows the temperature dependence of the integrated intensity. From a parametric fit of the scaling law for magnetization , where , we deduce a value of , which is in good agreement with the value of obtained from neutron scattering Metoki et al. (2005). Figure 5(b) shows the variation of the FWHM, which gives the critical exponent relating the thermal variation of the correlation lengths in the paramagnetic state. Theoretical values for and are and for the 3D Heisenberg antiferromagnet, and and for a 3D Ising system Collins (1989). Although our data on are not of sufficient accuracy to make a definitive statement, our experiments give little evidence for any special magnetic anisotropy (as would be the case for a 3D Ising system) in these materials.
The final frame, Fig. 5(c) shows the change in the position of the magnetic diffraction peak. The small offset from 2.500 below arises from a systematic error in the determination of the lattice parameter. As verified by measuring the charge reflection, this systematic error stays constant with temperature, so that the variation of the position between and 48.5 K must be considered real even if it is only 2 parts in . This shift of the peak in the paramagnetic state is not connected with the development of incommensurate fluctuations, otherwise there would be a matching peak from the charge peak seen just above . Instead, this is another observation of the so-called -shift Bernhoeft et al. (2004). Given the extremely good resolution of synchrotron x-rays, especially at energies as low as the Np -edges, this is relatively easy to observe with good crystals, but is not yet understood.
Turning to the Ga resonance, the focus is on the direction of the apparent dipoles at the Ga sites and their relative magnitudes. Since in NpCoGa5 the Np moments are along the high symmetry direction of the structure, the -axis, at all temperatures, it is expected that any effective Ga dipole will be along this direction, as has been inferred by NMR/NQR experiments at the Ga sites Kambe et al. (2007); Sakai et al. (2007).
For the direction of the dipoles, the most informative measurements in RXS experiments are those tracing the azimuthal dependence of the intensity in both and polarization channels Hill and McMorrow (1996); Paixão et al. (2002); Wilkins et al. (2006).
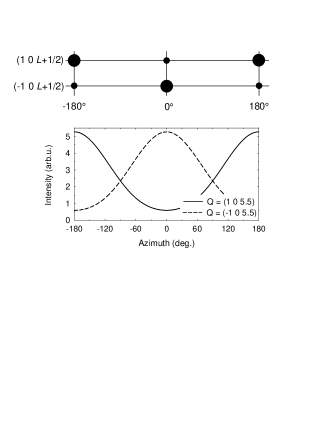
The Ga -edge resonant signal was present only in the scattering channel suggesting a magnetic dipole-like origin of the scattering, as found previously for signals at the Ga -edge Mannix et al. (2001); Kuzushita et al. (2006). Collecting azimuthal scans in order to determine the direction of the dipoles on either of the Ga sites turned out to be experimentally difficult due to multiple scattering effects interfering with the signal. Such effects manifest themselves as spikes of high intensity in the data for certain values of azimuth. Despite these experimental artefacts a consistent picture may be given in which a schematic representation of the data, together with a simulated azimuthal dependence is shown in Fig. 6. The observed intensities are represented in the top frame by large (small) points for high (low) intensity for the azimuthal angles shown. This pattern of intensities was found for a series of reflections with different values. The lower frame of Fig. 6 shows the intensity of the reflections, calculated for an effective dipole moment along , as an example. In general, for a chosen reflection and the actual scattering geometry (see Fig. 2a) the azimuthal dependence for a signal originating from magnetic dipoles oriented along the direction can be analytically written as
| (4) |
where is the Bragg angle for the , is the azimuthal value and is a parameter characterizing the off-specular nature of the chosen reflection, This means that, when going to higher values of at fixed , the difference between the and changes less dramatically on approaching the direction, parallel to the direction of the effective Ga magnetic dipoles.
For a fixed azimuthal angle, in this case , we have made a study of the intensities at the Ga -edge for a series of reflections, both along the specular and off-specular directions. A comparison of these intensities allows a determination of the dipole signals associated with the Ga(1) and Ga(2) sites to be made. Recall that, because of the symmetry, Ga(1) contributes to all reflections, and Ga(2) only to those with even.
| calculations | exp. | |||||||
|---|---|---|---|---|---|---|---|---|
| 1.145 | 0.2243 | -2 | 0 | 0.4847 | 0.2419 | 2.4(3) | 0.10(1) | |
| 1.050 | 0.2786 | -2 | 0 | 0.5728 | 0.3839 | 3.2(4) | 0.12(2) | |
| 1.004 | 0.3279 | -2 | 0 | 0.6610 | 0.5752 | 5.0(5) | 0.11(1) | |
| 1.013 | 0.3748 | -2 | 0 | 0.7491 | 0.8525 | 6.0(5) | 0.14(1) | |
| 1.179 | 0.2424 | 2 | -2.152 | 0.4847 | 0.1933 | 1.3(3) | 0.14(3) | |
| 1.065 | 0.2864 | 2 | 7.955 | 0.5728 | 0.9753 | 6.2(5) | 0.15(1) | |
| 1.008 | 0.3305 | 2 | -3.732 | 0.6610 | 0.3161 | 1.8(5) | 0.17(5) | |
| 1.008 | 0.3745 | 2 | -5.194 | 0.7491 | 0.3403 | 2.3(3) | 0.14(2) | |
Table 1 shows the comparison between the calculated and observed intensities of the resonant scattering signal in NpCoGa5 at K at the Ga -edge. The calculated structure factors for both Ga positions are given and ) as well as the resonant geometric factor Hill and McMorrow (1996). The calculated RXS intensity is corrected for the Lorentz factor and for an angular factor that accounts for the fraction of the incident beam intercepted by the sample
| (5) |
Here, is an “asymmetry” angle, i.e. the angle between the specular direction and the scattering vector Detlefs et al. (1997).
Given the often greater than 10% uncertainty in the observed intensities, the agreement between the observed and calculated intensities is reasonable, although there does appear to be a different scale factor needed between the specular and off-specular reflections. This is almost certainly due to absorption effects not properly accounted for, especially as the surface of the crystal was not polished (i.e. flat), even though the crystal quality was good. The best agreement, as shown in the final column of the Table, for the and series of scattering vectors is for a ratio between Ga(1) and Ga(2) dipoles of:
| (6) |
IV.2 NpRhGa5
The magnetic structure of NpRhGa5 below K is more complex than the one of NpCoGa5 due to the magnetic phase transition occurring at K where the Np magnetic moments re-orient from the -axis direction to lie in the basal plane (see Fig. 1), with their moments along and directions according to neutron scattering Jonen et al. (2006a). This magnetic phase transition is accompanied by a discontinuous change in the magnetic moment amplitude suggesting a change of the electronic states Jonen et al. (2006a).
In our RXS experiment we are able to test the conclusions of the neutron experiments in three different ways; first by examining the temperature dependencies of the intensities; second, by performing azimuthal scans; and third, by examining the polarization of the scattered photons to determine the domain population.
Fig. 7 shows the temperature dependence of the RXS signal in NpRhGa5 at the Np -edge for . The RXS signal is compared with the temperature dependence of the Np moment as deduced from neutron scattering by multiplying the moment (squared) by the relevant geometric scattering factors. Two effects are present in this simulation. The first is the growth of the moment as a function of temperature. This is taken from Fig. 5 of Ref. Jonen et al., 2006a and includes a discontinuity at . The second is the re-orientation of the moments at that has a drastic effect on both the neutron and x-ray intensities. The good agreement between the neutron-derived and RXS intensity is the first indication that the envisaged model for the two magnetically ordered phases is correct.
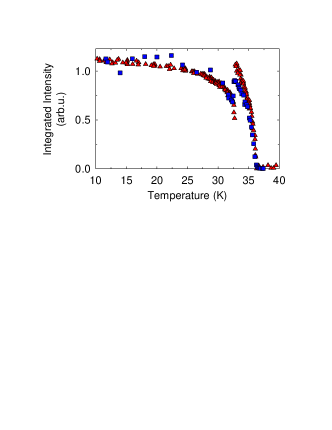
The agreement shown in Fig. 7 is probably as good as can be expected between the two techniques, and shows that the re-orientation of the Np moments at away from the axis certainly occurs. Small differences between the neutron and RXS results around may arise from the lack of temperature stability in the RXS case, or, more interestingly, because the scale factor relating the moment to the RXS signal changes at . This might suggest a transition between two subtly different electronic states, as already suggested by Jonen et al.,Jonen et al. (2006a) from their neutron experiments.
Although the moment direction in the high-temperature state, is clearly established as , the situation below is more complex as the moments can have any direction in the basal plane. The neutron experiments are interpreted with the moments along and directions, forming two domains. We therefore set out to confirm this using the new 10 T magnet facility available at ID20. Unfortunately, use of the heavy sample environment, such as the 10 T cryomagnet makes azimuthal scans impossible so that phase plate scans, described in Sec. II, were necessary.
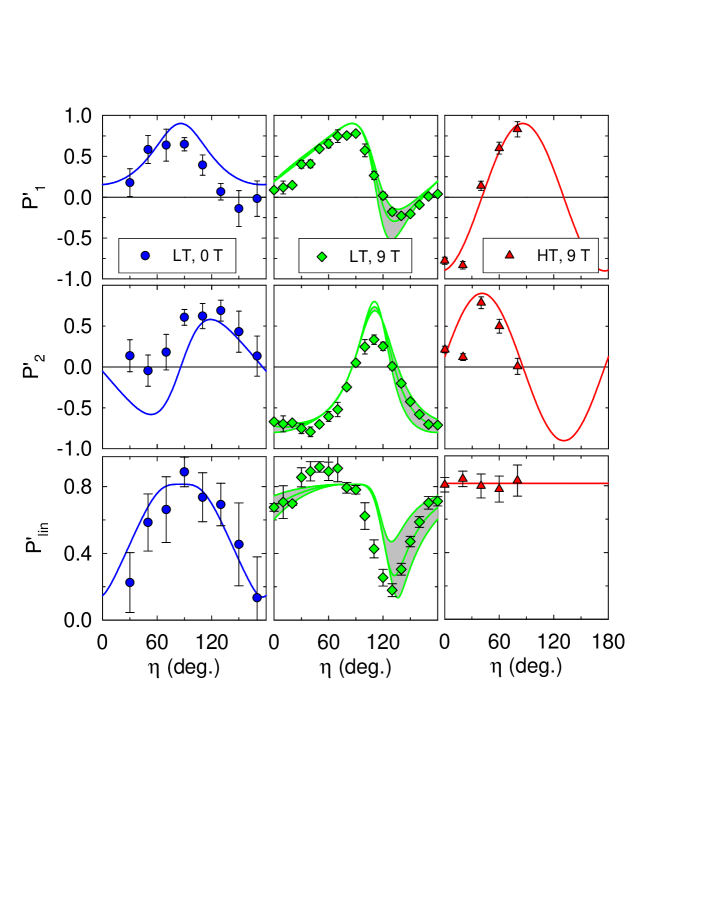
Fig. 8 shows , and values measured at the Np -edge in NpRhGa5 as a function of polarization direction, , of the incident light. The data were recorded at at K (i.e. at , denoted as LT) and 33 K (i.e. at , denoted as HT) in both zero-field state and with magnetic field T applied along the -axis. Although the zero-field data were not measured with high statistics (the error bars correspond not only to the errors coming from the integration of the analyzer rocking curves but also from the fit to the Stokes function (Eq. 1)) they agree with the model shown in blue solid line – equal population of domains with Np magnetic moments along and directions. Comparison of the zero-field data and the 9 T data in the (LT) phase (blue circles and green diamonds) shows the magnetic field effect: the domain population for the 9 T LT phase changes to 90% domains vs. 10% domains, indicating that the applied magnetic field of 9 T is insufficient to induce a single domain, although it goes a long way to establish such a monodomain state. The choice of over is a result of the field not being exactly along the direction, i.e. a small misorientation of the crystal.
The difference between the lower panels for the LT state shows that we are particularly sensitive to the direction and the domain population with this technique. The difference in the values of and the measured value is the result of depolarization of the scattered photon beam, which can only occur if domains with different scattered beam polarizations contribute to the total signal. For a single domain state (e.g. the HT state) there is no depolarization, and the linear scattered component is the same as the incident component, i.e. . It is thus interesting to observe the minima in . For an equal domain state, the minima occur at the symmetric positions , whereas as the domain population changes the minima in change also. The shaded simulations are for models with domain populations of 95:5 and 85:15. The most probable domain population appears to be 90:10 at T. The HT phase (represented by red triangles in Fig. 8) data can be fit to the Np magnetic moments pointing along the direction even when magnetic field of 9 T is applied along the -axis, which is consistent with the known phase-diagram in a magnetic field Colineau et al. (2006).
The sensitivity of the polarization of the scattered particle to the moment direction and domain population is also exploited in spherical neutron polarimetry (SNP) Brown (2006). In both cases the information may be obtained from a single reflection, rather than the standard technique of comparing intensities of a number of different reflections Hiess et al. (2001). However, the x-ray technique may be used in a magnetic field, whereas the nature of the neutron interaction with a magnetic field restricts the SNP technique to zero applied field. Clearly, this is a considerable advantage when the domain population, as well as possibly the moment directions, can be changed by the application of a magnetic field.
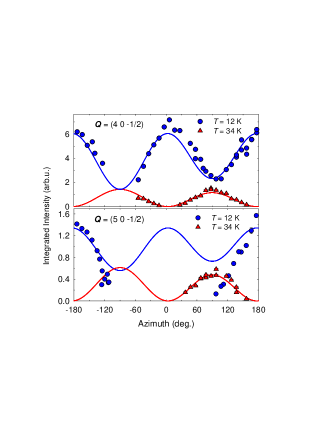
Turning now to the Ga -edge spectra, we show in Fig. 9 the results for two reflections in zero applied field but at different temperatures, above (triangles) and below (circles) the re-orientation transition at . Only Ga(1) contributes to the signal at but contributions from both Ga sites are present at . In the HT state ( K) the Ga dipoles are assumed to point along the axis and the agreement for both reflections with the model is acceptable.
The intensities at the Ga -edge clearly scale approximately as the moment on the Np site, which changes considerably below , mostly because of the thermal effects as K, but there is also a discontinuity in the moment itself Jonen et al. (2006a). In the LT state there are some discrepancies with the model, but they are attributed to difficulties in measuring the intensity as a function of azimuthal angle over such a large azimuthal range. The domain population has been assumed as 50:50, corresponding to the ZFC state discussed in connection with Fig. 8.
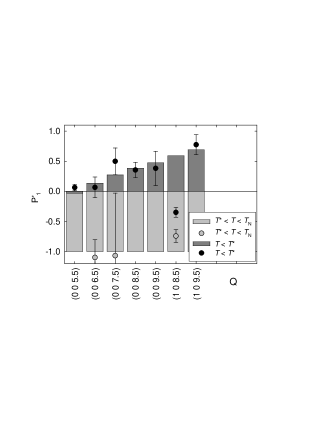
The method of determining the Stokes parameters as used in Fig. 8 for the Np resonance was used also for the Ga -edge and can confirm the re-orientation of the Ga dipoles as suggested by the results and modelling in Fig. 9. In the case of the Ga -edge resonance there is a difficulty in making the integration of the analyzer crystal as strong inelastic scattering, associated with the and emission lines at about 1000 eV below resonance, can affect the measurement of the integrated intensities, and thus and . We show in Fig. 10 the results for in the two states for a number of different reflections.
In the HT state, exactly for the specular reflections and it is almost zero for off-specular ones due to the azimuth value given by the direction of magnetic field with respect to the sample. From this and from the definition of (Eq. 2) it follows that for all specular reflections and it is very close to for off-specular ones. Although the was not measured at all reflections shown in Fig. 10, subsequent temperature dependence curves on these reflections confirmed the absence of the channel signal.
At the moment reorientation temperature some of the intensity is transferred into the channel so that in the LT state the sign of changes and approaches , as the ratio increases with increasing scattering angle and decreasing off-specularity . The agreement between the experimental and calculated values indicate that the direction of the moments on both Ga(1) and Ga(2) follow that of the Np magnetic moment. Recall that both Ga sites contribute to the reflections with even, but only the Ga(1) to reflections with odd.
Similarly to the case of NpCoGa5, intensities of several reflections must be compared in order to estimate the ratio between amplitudes of the Ga(1) to Ga(2) dipoles. Table 2 shows this comparison in the LT phase, i.e. when model with dipoles pointing along the directions and an equal domain population is considered. The calculated structure factors for both Ga positions are given ( and ) as well as the resonant geometric factor , calculated for the azimuthal angle with respect to the azimuthal reference. The best agreement, as shown in the final column of the Table, gives
| (7) |
A similar analysis in the HT phase was not performed, because of difficulties due to the limited stability temperature range of this phase.
| calculations | exp. | ||||||||
|---|---|---|---|---|---|---|---|---|---|
| 1.065 | 0.2864 | 2 | 7.467 | -0.618 | -0.538 | 2.782 | 54(1) | 19.4(4) | |
| 1.004 | 0.3279 | -2 | 0 | -0.448 | -0.376 | 0.225 | 4.1(2) | 18(1) | |
| 1.113 | 0.4200 | -2 | 0 | -0.296 | -0.245 | 0.138 | 3.0(2) | 22(1) | |
Finally, we address also the question of a possible lattice distortion in NpRhGa5. Onishi and Hotta Onishi and Hotta (2004) examined the role of orbital degrees of freedom in determining the magnetic behavior of NpGa5 compounds, on the base of a coupling scheme previously used to address the properties of UGa5 and PuGa5 compounds Hotta and Ueda (2003). A theory based on the doublet-singlet crystal field model Kiss and Kuramoto (2006) predicts a ferroquadrupolar order (FQO) in this compound. A homogeneous quadrupolar moment should be accompanied by an orthorhombic lattice distortion below . The only possible allowed subgroup consistent with this FQO is (no. 65) corresponding to a distortion of the tetragonal -plane along the and axes. Concomitantly, the primitive tetragonal lattice is converted into an orthorhombic -face centered lattice where the orthorhombic - and -axes are the and diagonals of the tetragonal unit cell, and the tetragonal and orthorhombic -axes coincide. The orthorhombic distortion should split reflections of the type with . Since the magnetism of this material requires that the axis is in the scattering plane, because reflections have indices , we have not performed experiments in the plane, so a definitive answer as to whether this distortion appears at cannot be given.
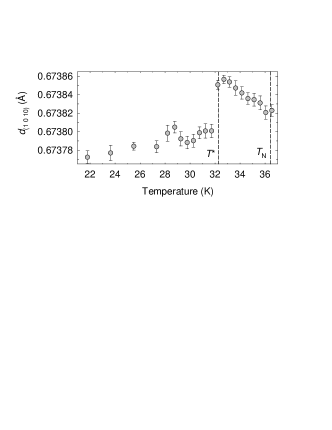
Using a Ge(111) analyzer to improve the resolution of the spectrometer, we have examined reflections of the form and in Fig. 11 we show the change of the lattice d-spacing as a function of temperature for the reflection. These experiments were done in the configuration with T in an attempt to have a majority domain population, which can often lead to a clearer understanding of any possible lattice distortion associated with the magnetic ordering. The d-spacing of the studied reflection is principally sensitive to the -axis length. There is no apparent change at as expected for a second-order phase transition Aoki et al. (2005), but a small change corresponding to occurs at . Probably this is a magnetostrictive effect when the moments move away from the axis, but a more complete study with different orientation of the crystals is necessary to draw firm conclusions. There was no sign of any “two-peak structure” in the scans at low temperature.
V Discussion and conclusions
Our main objective in these studies of NpCoGa5 and NpRhGa5 has been to confirm the results of the neutron experiments on the same materials, and to see to what extent the RXS technique can bring additional information on the hybridization between the Np and other electron states. From the shape of the Np resonances and their azimuthal dependencies there is no sign of any quadrupole contribution, as was found for example in NpO2 Paixão et al. (2002) and UO2 Wilkins et al. (2006). Quadrupole ordering may, of course, occur at a different wave vector as compared to the magnetic scattering, but the shape of the resonances (Fig. 3) argues that the moments are strictly dipole in nature. Ferroquadrupolar ordering, as predicted by Kiss and Kuramoto Kiss and Kuramoto (2006) for low temperature phase of NpRhGa5, occurs at the position of the charge reflections, and is thus difficult to observe. However, via coupling to the lattice, it should give rise to a lattice distortion, which we have not observed.
With respect to the resonances at the Ga -edge, we have shown that the phenomenon of a strong resonance exists in Np as well as U compounds. As far as our experiments can determine, the effects are wholly induced by the polarization of the Np moments. For both the temperature dependence (Figs. 4 and 7), as well as the direction, the apparent Ga dipoles (Figs. 6, 9, and 10) follow that of the Np moments.
By analyzing the polarization of the scattered photon beam and determining the Stokes parameters (Figs. 8 and 10), we show that the technique is extremely sensitive to the direction of the moments as well as the domain population. As shown in Fig. 8, this information may be deduced from a single reflection even when a magnetic field is applied. In the case of a similar technique in neutron scattering Brown (2006); Hiess et al. (2001), the same information may be deduced, but the technique is restricted to zero applied field.
We have examined, briefly, the possibility of a lattice distortion at in NpRhGa5. An effect is observed but this is probably a magnetostrictive change in the lattice parameter. No effect, at least in the -axis, is observed at . Our experience has been that when a lattice distortion occurs, at least two peaks are seen with the high resolution available with synchrotron x-rays, and this is not the case. The FWHM of the lattice peak changes by only a small amount between the LT and HT states, suggesting strain effects rather than a lattice distortion.
Finally, with respect to hybridization, we have deduced the ratios of the dipoles at the Ga(1) site as compared to those at the Ga(2) site (see Fig. 1 for the structure). In the case of NpCoGa5 the ratio of the signals Ga(1)/Ga(2) , whereas in NpRhGa5 it appears closer to about a third of this value, i.e. . Given that the nearest neighbor configuration of the Ga(1) has 4 equidistant Np atoms in a ferromagnetic configuration, compared to two Np neighbors for the Ga(2) site we would already expect a factor of two in the relative transferred field. In the case of the Co compound the distances for the Ga(1) – Np and Ga(2) – Np are 2.96 and 3.00 Å, respectively. These same distances are equal at 2.96 Å in the Rh compound. To a first approximation we may discount these small differences in distance and would expect the hybridization to be similar in the Co and Rh compounds, whereas it is not experimentally.
Comparisons may be made also with the hyperfine coupling constants as deduced in the experiments with NMR/NQR. The directions of the Ga dipoles can be obtained from this technique, as shown by Ohama et al.Ohama et al. (2005). For NpCoGa5, Sakai et al.Sakai et al. (2007) give an isotropic hyperfine coupling constant of 46 kOe/ for Ga(1) and 36 kOe/ for Ga(2). However, since the hybridization in the RXS case involves the polarization of the Ga orbitals, which are anisotropic, it may be more appropriate Kambe to compare the anisotropic part of the hyperfine coupling constant, and in this case the values are 13 kOe/ for Ga(1) and 4 kOe/ for Ga(2). This ratio is in rough accord with our measurements, since the RXS result should be divided by two to normalize for the number of Np nearest neighbors. No NMR/NQR experiments have yet been reported on NpRhGa5. So far, no calculations have been performed of the possible signals at the Ga -edges in these 115 materials, but there seems sufficient information at this stage, together with the previous work on U 115 compounds Kuzushita et al. (2006), to encourage such theoretical efforts. Both the shapes of the resonances, which are different between NpCoGa5 and NpRhGa5 (see discussion connected to Fig. 3), and the differing ratios of the Ga(1)/Ga(2) dipole strengths suggest that the transition-metal states play a significant role in the physics of these compounds and do not simply act as “spacers”.
Acknowledgements.
We thank the safety personnel at the ESRF for their help in running these experiments, C. Detlefs for discussions and critical reading of the manuscript and S. Kambe and R. Walstedt for correspondence concerning the NMR/NQR experimental results. B.D. and S.B.W. thank the European Commission for support in the frame of the “Training and Mobility of Researchers” program. The high purity neptunium metal required for the fabrication of these compounds was made available through a loan agreement between Lawrence Livermore National Laboratory and ITU, in the frame of a collaboration involving LLNL, Los Alamos National Laboratory, and the U.S. Department of Energy. F.H. would like to thank for the financial support by the Grant-in-Aid for Scientific Research from the Japanese Ministry of Education, Culture, Sports, Science and Technology (No. 18740219) and by the REIMEI Research Resources of Japan Atomic Energy Agency.References
- Sarrao et al. (2002) J. L. Sarrao, L. A. Morales, J. D. Thompson, B. L. Scott, G. R. Stewart, F. Wastin, J. Rebizant, P. Boulet, E. Colineau, and G. H. Lander, Nature 420, 297 (2002).
- Wastin et al. (2003) F. Wastin, P. Boulet, J. Rebizant, E. Colineau, and G. H. Lander, J. Phys. Cond. Matt. 15, S2279 (2003).
- Curro et al. (2005) N. J. Curro, T. Caldwell, E. D. Bauer, L. A. Morales, M. J. Graf, Y. Bang, A. V. Balatsky, J. D. Thompson, and J. L. Sarrao, Nature 434, 622 (2005).
- Opahle and Oppeneer (2003) I. Opahle and P. M. Oppeneer, Phys. Rev. Lett. 90, 157001 (2003).
- Opahle et al. (2004) I. Opahle, S. Elgazzar, K. Koepernik, and P. M. Oppeneer, Phys. Rev. B 70, 104504 (2004).
- Shick et al. (2005) A. B. Shick, V. Janiš, and P. M. Oppeneer, Phys. Rev. Lett. 94, 016401 (2005).
- Pourovskii et al. (2006) L. V. Pourovskii, M. I. Katsnelson, and A. I. Lichtenstein, Phys. Rev. B 73, 060506(R) (2006).
- Sechovský et al. (1992) V. Sechovský, L. Havela, G. Schaudy, G. Hilscher, N. Pillmayr, P. Rogl, and P. Fischer, J. Magn. Magn. Mater. 104, 11 (1992).
- Moreno et al. (2005) N. O. Moreno, E. D. Bauer, J. L. Sarrao, M. F. Hundley, J. D. Thompson, and Z. Fisk, Phys. Rev. B 72, 035119 (2005).
- Troć et al. (2004) R. Troć, Z. Bukowski, C. Sułkowski, H. Misiorek, J. A. Morkowski, A. Szajek, and G. Chełkowska, Phys. Rev. B 70, 184443 (2004).
- Kaneko et al. (2003) K. Kaneko, N. Metoki, N. Bernhoeft, G. H. Lander, Y. Ishii, S. Ikeda, Y. Tokiwa, Y. Haga, and Y. Ōnuki, Phys. Rev. B 68, 214419 (2003).
- Colineau et al. (2004) E. Colineau, P. Javorský, P. Boulet, F. Wastin, J. C. Griveau, J. Rebizant, J. P. Sanchez, and G. R. Stewart, Phys. Rev. B 69, 184411 (2004).
- Metoki et al. (2005) N. Metoki, K. Kaneko, E. Colineau, P. Javorský, D. Aoki, Y. Homma, P. Boulet, F. Wastin, Y. Shiokawa, N. Bernhoeft, et al., Phys. Rev. B 72, 014460 (2005).
- Jonen et al. (2006a) S. Jonen, N. Metoki, F. Honda, K. Kaneko, E. Yamamoto, Y. Haga, D. Aoki, Y. Homma, Y. Shiokawa, and Y. Ōnuki, Phys. Rev. B 74, 144412 (2006a).
- Jonen et al. (2006b) S. Jonen, N. Metoki, F. Honda, K. Kaneko, D. Aoki, Y. Homma, E. Yamamoto, Y. Haga, Y. Shiokawa, and Y. Ōnuki, Physica B 378-80, 1018 (2006b).
- Honda et al. (2006a) F. Honda, N. Metoki, K. Kaneko, S. Jonen, E. Yamamoto, D. Aoki, Y. Homma, Y. Shiokawa, and Y. Ōnuki, Physica B 378-80, 1009 (2006a).
- Honda et al. (2006b) F. Honda, N. Metoki, K. Kaneko, S. Jonen, E. Yamamoto, D. Aoki, Y. Homma, Y. Haga, Y. Shiokawa, and Y. Ōnuki, Phys. Rev. B 74, 144413 (2006b).
- Metoki (2006) N. Metoki, J. Phys. Soc. Japan 75 Supplement, 24 (2006).
- Colineau et al. (2005) E. Colineau, F. Wastin, P. Boulet, P. Javorský, J. Rebizant, and J. P. Sanchez, J. Alloys Compd. 386, 57 (2005).
- Blume (1985) M. Blume, J. Appl. Phys. 57, 3615 (1985).
- Gibbs et al. (1988) D. Gibbs, D. R. Harshman, E. D. Isaacs, D. B. McWhan, D. Mills, and C. Vettier, Phys. Rev. Lett. 61, 1241 (1988).
- Mannix et al. (2001) D. Mannix, A. Stunault, N. Bernhoeft, L. Paolasini, G. H. Lander, C. Vettier, F. de Bergevin, D. Kaczorowski, and A. Czopnik, Phys. Rev. Lett. 86, 4128 (2001).
- Kuzushita et al. (2006) K. Kuzushita, K. Ishii, S. B. Wilkins, B. Janoušová, T. Inami, K. Ohwada, M. Tsubota, Y. Murakami, K. Kaneko, N. Metoki, et al., Phys. Rev. B 73, 104431 (2006).
- Normile et al. (2007) P. S. Normile, S. B. Wilkins, B. Detlefs, D. Mannix, E. Blackburn, L. Bouchenoire, N. Bernhoeft, and G. H. Lander, Phys. Rev. B 75, 184437 (2007).
- van Veenendaal (2003) M. van Veenendaal, Phys. Rev. B 67, 134112 (2003).
- Usuda et al. (2004) M. Usuda, J. Igarashi, and A. Kodama, Phys. Rev. B 69, 224402 (2004).
- Paolasini et al. (2007) L. Paolasini, C. Detlefs, C. Mazzoli, S. Wilkins, P. P. Deen, A. Bombardi, F. de Bergevin, F. Yakhou, J. P. Valade, A. Fondacaro, et al., J. Synchrotron Rad. 14, 301 (2007).
- Bouchenoire et al. (2006) L. Bouchenoire, S. D. Brown, P. Thompson, C. Detlefs, and M. J. Cooper, Nucl. Instr. Method A 566, 733 (2006).
- Mazzoli et al. (2006) C. Mazzoli, S. B. Wilkins, S. Di Matteo, B. Detlefs, C. Detlefs, V. Scagnoli, L. Paolasini, and P. Ghigna (2006), URL http://www.citebase.org/abstract?id=oai:arXiv.org:cond-mat/06%11239.
- Born and Wolf (1999) M. Born and E. Wolf, Principle of Optics (Cambridge University Press, 1999), 7th ed.
- Longfield et al. (2002) M. J. Longfield, J. A. Paixão, N. Bernhoeft, G. H. Lander, F. Wastin, and J. Rebizant, Phys. Rev. B 66, 134421 (2002).
- Hill and McMorrow (1996) J. P. Hill and D. F. McMorrow, Acta Cryst. A 52, 236 (1996).
- Collins (1989) M. F. Collins, Magnetic Critical Scattering (Oxford University Press, Oxford, 1989).
- Bernhoeft et al. (2004) N. Bernhoeft, G. H. Lander, M. J. Longfield, S. Langridge, D. Mannix, S. D. Brown, W. J. Nuttall, A. Hiess, C. Vettier, and P. Lejay, J. Phys. Cond. Matt. 16, 3869 (2004).
- Kambe et al. (2007) S. Kambe, H. Sakai, Y. Tokunaga, T. Fujimoto, R. E. Walstedt, S. Ikeda, D. Aoki, Y. Homma, Y. Haga, Y. Shiokawa, et al., Phys. Rev. B 75, 140509(R) (2007).
- Sakai et al. (2007) H. Sakai, S. Kambe, Y. Tokunaga, T. Fujimoto, R. E. Walstedt, H. Yasuoka, D. Aoki, Y. Homma, E. Yamamoto, A. Nakamura, et al., Phys. Rev. B 76, 024410 (2007).
- Paixão et al. (2002) J. A. Paixão, C. Detlefs, M. J. Longfield, R. Caciuffo, P. Santini, N. Bernhoeft, J. Rebizant, and G. H. Lander, Phys. Rev. Lett. 89, 187202 (2002).
- Wilkins et al. (2006) S. B. Wilkins, R. Caciuffo, C. Detlefs, J. Rebizant, E. Colineau, F. Wastin, and G. H. Lander, Phys. Rev. B 73, 060406(R) (2006).
- Detlefs et al. (1997) C. Detlefs, A. H. M. Z. Islam, A. I. Goldman, C. Stassis, P. C. Canfield, J. P. Hill, and D. Gibbs, Phys. Rev. B 55, R680 (1997).
- Colineau et al. (2006) E. Colineau, F. Wastin, and J. Rebizant, J. Phys. Cond. Matt. 18, 411 (2006).
- Brown (2006) P. J. Brown, in Neutron Scattering from Magnetic Materials, edited by T. Chatterji (Elsevier, Amsterdam, 2006), p. 215 et seq.
- Hiess et al. (2001) A. Hiess, P. J. Brown, E. Lelièvre-Berna, B. Roessli, N. Bernhoeft, G. H. Lander, N. Aso, and N. K. Sato, Phys. Rev. B 64, 134413 (2001).
- Onishi and Hotta (2004) H. Onishi and T. Hotta, New Journal Of Physics 6, 193 (2004).
- Hotta and Ueda (2003) T. Hotta and K. Ueda, Physical Review B 67, 104518 (2003).
- Kiss and Kuramoto (2006) A. Kiss and Y. Kuramoto, J. Phys. Soc. Japan 75, 034709 (2006).
- Aoki et al. (2005) D. Aoki, Y. Homma, Y. Shiokawa, H. Sakai, E. Yamamoto, A. Nakamura, Y. Haga, R. Settai, and Y. Ōnuki, J. Phys. Soc. Japan 74, 2323 (2005).
- Ohama et al. (2005) T. Ohama, M. Hirano, and S. Noguchi, Phys. Rev. B 71, 094408 (2005).
- (48) S. Kambe, private communication.