Survival of icy grains in debris discs.
Abstract
Aims. We put theoretical constraints on the presence and survival of icy grains in debris discs. Particular attention is paid to UV sputtering of water ice, which has so far not been studied in detail in this context.
Methods. We present a photosputtering model based on available experimental and theoretical studies. We quantitatively estimate the erosion rate of icy and ice-silicate grains, under the influence of both sublimation and photosputtering, as a function of grain size, composition and distance from the star. The effect of erosion on the grain’s location is investigated through numerical simulations coupling the grain size to its dynamical evolution.
Results. Our model predicts that photodesorption efficiently destroy ice in optically thin discs, even far beyond the sublimation snow line. For the reference case of Pictoris, we find that only mm grains can keep their icy component for the age of the system in the 50–150 AU region. When taking into account the collisional reprocessing of grains, we show that the water ice survival on grains improves (grains down to m might be partially icy). However, estimates of the amount of gas photosputtering would produce on such a hypothetical population of big icy grains lead to values for the O I column density that strongly exceed observational constraints for Pic, thus ruling out the presence of a significant amount of icy grains in this system. Erosion rates and icy grains survival timescales are also given for a set of 11 other debris disc systems. We show that, with the possible exception of M stars, photosputtering cannot be neglected in calculations of icy grain lifetimes.
Key Words.:
stars: circumstellar matter - planetary system:formation - planetary system: protoplanetary discs - stars:individual: Pic1 Introduction
Water ice has been unambiguously detected towards embedded YSOs/protostars (Gibb et al., 2004, and references therein) and around Herbig AeBe and T Tauri stars (e.g., Creech-Eakman et al., 2002; Meeus et al., 2001; Gibb et al., 2004). For the more evolved debris disc systems, however, direct observational clues for the presence of icy grains seem far less conclusive. The obvious exception is of course our own Solar System where, in addition to appearing on satellite and planetary surfaces, dust-sized ice particles have been detected in the comae of comets and in planetary rings. For extrasolar systems, the presence of ice appears very likely, given the fact that many debris discs extend to cold regions very far from their central stars, beyond the expected sublimation limit. However, no unambiguous “smoking gun” (presumably water gun?) signature of their presence is available yet. Water ice is usually inferred through indirect arguments like best fits of the Spectral Energy Distribution (SED). The most conclusive of these indirect detections are probably the ones around the K stars Eridani (0.5–1 Gyr) (Li et al., 2003) and HD 69830 (Lisse et al., 2006), for which the presence of water ice appears as a robust conclusion.
For discs around more luminous stars, definitive conclusions are more difficult to reach and appear more model dependent. Chen et al. (2006) analyzed spectral energy distributions (SEDs) around A, B and F types stars with detected infrared excesses and find that, when the excesses are reproduced by a single temperature blackbody emission, the peak in the number of systems with a given grain temperature occurs at 110 – 120 K. This was interpreted by the authors as a possible indication of the icy nature of the grains, since sublimation timescales for warmer grains are much shorter than the estimated system ages. The infrared (IR) emission detected in the HR 4796 system (an A-type star) was also reproduced by 110 K blackbody grains (Jura et al., 1998). Absence of warmer grains was again interpreted as a result of sublimation of ice in the inner part of the disc (however, as another possible explanation, a sweeper companion was also mentioned). Golimowski et al. (2006) invoked ice to explain the observed color change beyond 120 AU in the archetypal Pic disc (again around an A-type star). Their idea is that beyond the sublimation zone the average grain size is bigger, since the grains can preserve icy mantles.
However, even if the observational evidence is not 100% conclusive, there are numerous theoretical arguments supporting the possible presence of ice in debris discs. As already mentioned, the most obvious one is that debris discs often extend to regions beyond the sublimation snowline, i.e. thought to be cold enough for water vapor to condense on dust grains, the exact location of the sublimation zone depending on the thermal balance at the grain surfaces. Furthermore, since ices have been detected around YSOs, it should be logical to expect it to still be there at later times, provided no new ice removing mechanism appeared along the way. Li & Greenberg (1998a) also argued that if grains are produced from cometary evaporation then, since comet dust may consist of primitive interstellar dust on which the presence of an icy mantle is a well established fact, we should expect evaporated volatiles to recondense in the outer regions of debris discs (beyond 100 AU for the Pic case considered by these authors), or the ice mantles to be preserved for dust particles produced by shattering or collisions.
In this paper, we revisit the theoretical constraints on the presence of ice in debris discs. Our main point is that sublimation is not the only process which leads to ice destruction. We focus here on UV sputtering (a.k.a. photosputtering or photodesorption) of circumstellar ice particles, a phenomenon well known in the context of interstellar grains. In the solar system, the ice destruction rate due to UV radiation was estimated to be cm Myr-1 at the distance of Saturn (Harrison, 1967; Carlson, 1980). In his early pioneering work, Artymowicz (1994, 1996) predicted this rate to be orders of magnitude higher around A-type stars, which have a much stronger UV flux. In our paper, we provide a detailed model of the UV sputtering mechanism (Sect. 2.2). It extends previous calculations (which were not described in detail by Artymowicz), to include new laboratory and theoretical results that have become available in the last decade, as well a range of different host stars. In addressing the issue of ice survival in circumstellar discs, we also include sublimation (Sect. 2.1) in our model. In Sect. 2.5 we consider how grain dynamics is affected by erosion of the grain surface. Section 3.1 deals with application of our study to the Pic system. Sputtering rates for 11 other systems with detected debris discs can be found in Sect. 3.2. Summary and Conclusions are presented in Sect. 4.
2 Model description
In order to address the issue of ice survival in debris discs around stars we consider, in that order: (i) sublimation, (ii) photosputtering, and (iii) related grain dynamics. We compare the erosion timescales with the system age as well as the collisional lifetime of grains, the latter being importantly a source of newly generated dust grains.
2.1 Sublimation
Sublimation is a well known process. The mass loss rate is proportional to the difference between the phase-equilibrium vapor pressure and the actual water vapor pressure above the icy surface, i.e. .111 Condensation occurs when . In our calculations, we neglect the possible presence of water molecules in the ambient gas, assuming (an assumption which is justified in a debris disc). In this case, the mass sublimation rate can be written as (Lamy, 1974)
| (1) |
where is the phase-equilibrium vapor pressure at the surface temperature , and is the atomic weight of the water molecule. There are different available prescriptions, usually valid over different temperature ranges, for calculating the saturated vapor pressure over water ice surfaces (e.g., Marti & Mauersberger, 1993; Buck, 1981; Smithsonian Meterological Tables, 1984). For the K range, we adopt the formula from Fanale & Salvail (1984)
| (2) |
For K, we follow the experimentally derived results of Mauersberger & Krankowsky (2003)
| (3) |
which converges with Eq. 2 at 170 K. The erosion rate of a spherical particle due to sublimation is then given by
| (4) |
where is the grain radius, is the rate at which a grain loses mass, is the density of the grain material, is the covering factor (fraction of the surface covered by sublimating material). The sublimation lifetime of a grain then reads
| (5) |
where is the initial radius of the grain.
Sublimation also affects the energy balance of a grain by removing heat at the rate
| (6) |
where is the latent heat of sublimation. Strictly speaking, is a function of the grain temperature, however the dependence is weak ( erg g-1 at 0 K, erg g-1 at 90 – 300 K, see Lien 1990) and is not important for our calculations. We therefore adopt a value of erg g-1 through out the computation. At K, is negligible compared with the energy loss rate due to thermal radiation (see Sect. 3).
Sublimation acts in the inner (warmer) part of a disc and destroys icy grains, or at least de-ices them, very efficiently. The radial dependence of the speed of evaporation process is very rapid, owing to varying exponentially with which, in turn, depends on the distance from the star . This allows us to define the snowline location based on virtually any answer to the question of what constitutes a “fast enough” evaporation rate: widely different definitions of that rate all result in nearly the same locations of the snow line (see Sect. 3.1.1).
2.2 Photosputtering
Even outside the thermal evaporation zone, grains could be subject to destruction through a mechanism that does not have nearly as sharp a spatial boundary. Individual UV photons absorbed by a grain do not only dissociate water molecules but can cause molecule desorption from the surface of a grain. This process is known as photosputtering or photodesorption. Around the UV-bright stars the effect of photosputtering can be rather strong (Artymowicz, 1996) and the position of the actual snowline is no longer determined by sublimation alone. This is particularly true for debris discs, which are optically thin, so that the outer parts are not shielded from the UV radiation.
The mechanism of photodesorption at the atomic level has recently been investigated by Andersson et al. (2006) with their theoretical modeling of the interaction between 8 – 9.5 eV photons and icy surfaces. First, a water molecule is dissociated by a UV photon. After that, in some cases the OH- fragment can be directly desorbed or the molecule recombines and may leave the surface as a whole or it can pass its momentum to one of the neighboring molecules, which can leave the surface if the momentum is in the right direction. These authors estimated the desorption probability, called (photosputtering) yield , and found it to lie between for amorphous ice and for crystalline ice. Yield estimates were also obtained by Westley et al. (1995), but this time from laboratory experiments, studying UV sputtering of water ice by Lyα photons (10.2 eV). This study found that the yield is a weak function of the grain surface temperature and of the irradiation dose. At any given fluence (flux exposure time), is slightly higher for warmer grains. For a constant grain temperature, the yield increases rapidly with irradiation dose and reaches a plateau value for doses higher than photons/cm2 (Westley et al., 1995). This plateau value is on the order of few at =35 – 100 K. The obtained temperature dependence is relatively weak, the extreme values being for K and for K.
Direct comparison between the experimental results by Westley et al. (1995) and those derived from theoretical calculations by Andersson et al. (2006) is not straightforward. On the one hand, the latter estimates were derived for a fixed and very low temperature of 10 K. On the other hand, Westley et al. (1995) data were obtained through laser beam irradiation, which might have induced local point heating and thus adding some sublimation to the pure sputtering effect (N. J. Mason, private communication). It is thus difficult to precisely derive from these studies the exact dependence of the yield on the energy of an absorbed photon and the grain temperature. However, it is worth noticing that both these independently derived ranges for are comfortably of the same order of magnitude. We will thus make the simplified assumption that does not depend on temperature (which is reasonable, given a weak temperature dependence found by Westley et al. 1995) and is furthermore independent of the absorbed photon wavelength The constant value we assume is , intermediate between the lowest estimate of Andersson et al. (2006) and the highest estimate of Westley et al. (1995).
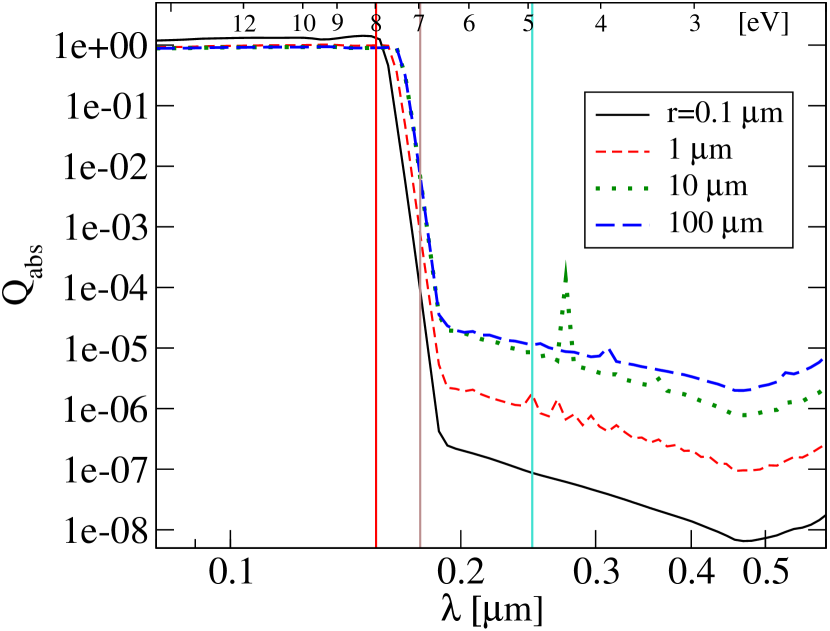
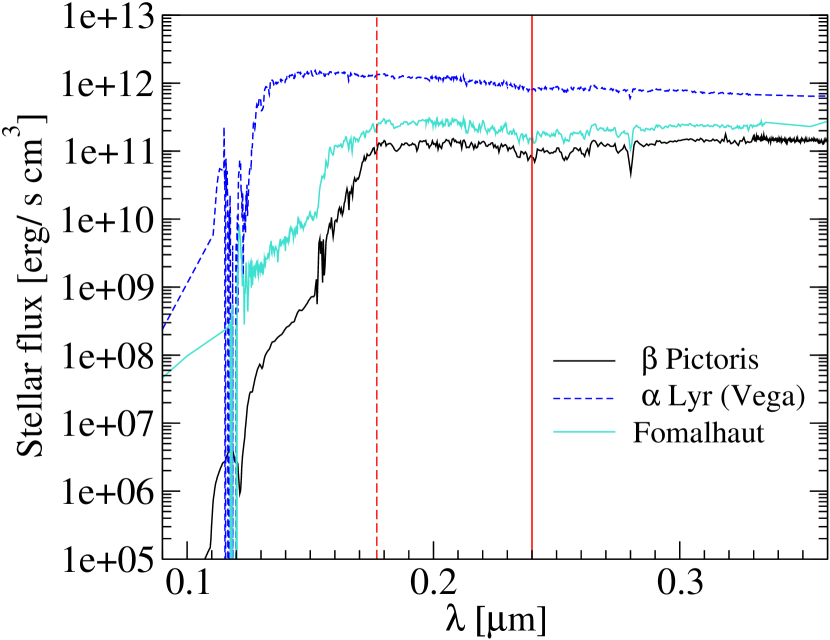
A crucial issue for the present problem is which energy range should be taken into account for UV sputtering calculations. There is indeed no reason why it should be restricted to the 8–11eV range explored in the 2 aforementioned studies. Dominik et al. (2005), in their study of an origin of gas-phase water in the surface layer of protoplanetary discs, considered photons with energies down to 6 eV and took a constant sputtering yield per incident photon. However, since desorption is triggered by the initial dissociation of a water molecule (even if the molecule can recombine afterwards), we adopt here a slightly lower threshold value of 5.1 eV, which correspond to the dissociation energy of the O-H bond (Ruscic et al., 2002).222This energy still exceeds the surface binding energy of a lattice particle for water ice, which is on the order of 0.1 – 0.37 eV (Dijkstra et al., 2003). An important point is that only absorbed photos can play role in the photosputtering process. Photons considered by Andersson et al. (2006) and Westley et al. (1995) belonged to the 8–11 eV energy range. For such photons the absorption coefficient by water ice is (Fig. 1), thus the number of absorbed photons was very close to the number of incident photons. For this reason, in this energy range it does not matter whether one considers the number of insident or absorbed photons. However, water ice does not efficiently absorb UV photons in the eV range, and the difference between incident and absorbed fluxes is significant. Although for photons in the 5.1 – 7 eV energy range , the effect of such “low energy” photons cannot be neglected, because many stars radiate significantly more in the 5 – 7 eV range than above 8 eV (see the Pic case in Fig. 2). However, the excact value of the lower boundary is not critical, provided it is below eV.
For the upper boundary of the energy of sputtering photons, we follow Dominik et al. (2005) and take 13.6 eV. The exact value for this upper limit is not important as the amount of radiation beyond 11 eV can be neglected for most stars (see Fig. 2)
For an icy grain, the erosion rate due to UV sputtering is calculated then as
| (7) |
where is the fraction of surface covered by ice, g is the mass of a water molecule and is the number of absorbed photons
| (8) |
in which is the incident stellar flux at the position of the grain, m (13.6 eV), m (5.1 eV), is the absorption coefficient for pure water ice surfaces (Fig. 1).
2.3 Gas production
Sublimation and photosputtering of ice produce gas. A significant fraction of gas in debris discs could be produced by the solids rather than be leftovers of the primordial dust component. This opens a possibility to deduce dust composition from abundances of various species in the gas component (if we know the parameters of the desorption processes).
In the case of icy grains, gas production rate due to UV sputtering can be calculated as
| (9) | |||||
where is the sputtering rate at 1 AU from the star, is the number density of grains of size , is the height above the midplane, and is the normal geometrical optical thickness of the disc. If a disc has a constant opening angle, i.e. a constant ratio, where is the height scale of the disc, then the above equation can be rewritten as
| (10) |
where is the geometrical optical thickness of solids in the disc along a radius in the midplane.
2.4 Grain temperature
As we have discussed, both sublimation and photosputtering erosion rates depend on grain temperature. This dependence is weak for UV sputtering but temperature obviously plays a crucial role for sublimation and should thus be accurately computed. The grain temperature is calculated from the energy balance equation, in which the radiative heating by the central star is balanced by energy loss to thermal re-radiation (assuming uniform temperature of the surface) and sublimation
| (11) |
where is the distance from the star, is the stellar radius, is the stellar flux at , is the Planck function at equilibrium temperature , is the grain radius, and is the absorption coefficient for the whole grain. Notice that in Eq. 11 we use the “true” obtained for a given grain composition whereas in Eq. 8 we use the absorption coefficient of pure water ice. The reason for this is that the grain temperature depends on absorption by the whole grain, while the UV sputtering on absorption by water molecules near the the surface.
The absorption coefficient is a function of grain size and chemical composition (e.g. Burns et al., 1979). It is here calculated using the Mie theory code developed by Artymowicz (1988). Effective medium theory is used to obtain effective dielectric constants or equivalently refraction indices, based on material component’s properties and volume mixing ratios. plays a crucial role in calculations of the grain temperature and, as a consequence, in determination of the dependence. A previously popular piecewise power-law ansatz ( for , otherwise) is not suitable for calculating the temperature of the predominantly icy grains, because it gives a significant overestimate of the temperature and, as a consequence, much overestimated radius of the ice sublimation boundary.
2.5 Icy grain erosion and dynamics
In our model we not only estimate sputtering and sublimation rates, we also compute the effect these mechanisms have on grain dynamics in a collisionless, gas-free disc. We follow the evolution of an icy grain taking into account the above two erosion modes, and the resultant change of the size-dependent radiation pressure coefficient (ratio of radiation pressure to gravity). The equation of motion of a grain reads
| (12) |
where and are the mass and position of the test particle, is the gravitational constant, and is the stellar mass. is the Poynting-Robertson (PR) drag:
| (13) |
where is the velocity vector of the grain, is its radial component, and is the speed of light.
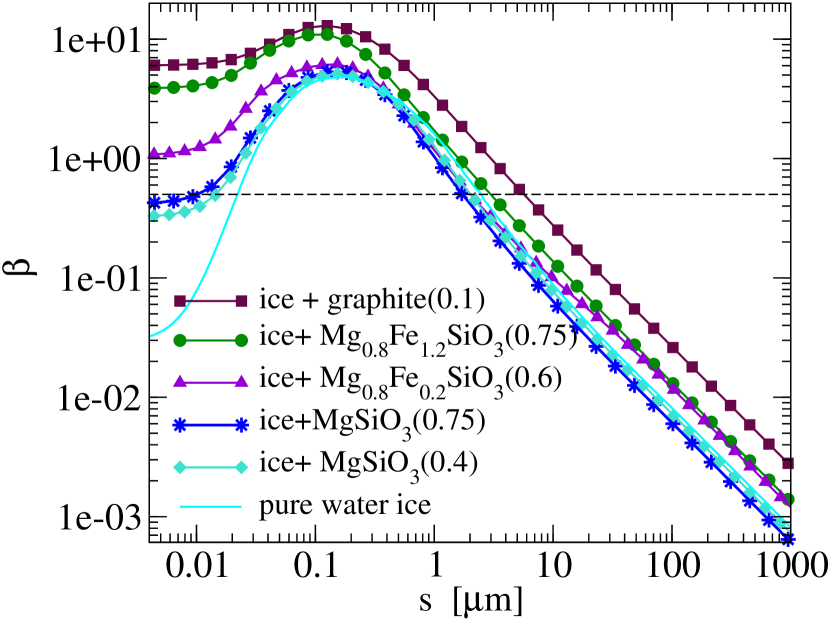
The coefficient depends on the grain size, chemical composition and stellar luminosity (more precisely, luminosity to mass ratio ). In our code, is calculated using the routines from Artymowicz (1988), and displayed in Fig. 3. For sizes above a certain threshold value (m for the case displayed here), is well approximated by the geometrical optics approximation
| (14) |
where is the grain radius for which . In this approximation, the gradual decrease in grain radius due to erosion will cause slow changes in at a rate
| (15) |
where . Since , , at least for grains bigger than few tenths of a micrometer (which is, incidentally, the wavelength of the peak power of radiation exerting the pressure). As can be seen from Eq. 12, such gradual changes in will increase the outward radiation pressure, which will tend to push the particle outwards, but at the same time, also increase the PR drag which tends to move particles inwards. For a grain on a Keplerian orbit of semi-major axis , one can show that, for small eccentricities, the rate at which changes reads
| (16) |
where is the Poynting-Robertson time. If , i.e., if the erosion rate is larger than about , or the erosion timescale is shorter than , then PR inward migration is replaced by the outward erosional migration.
3 Results
We now present typical grain behaviors for different representative stellar types. For sake of clarity, we first consider a nominal case, for which we present the results in detail, to fully describe the mechanisms at work. For this reference case, we consider the archetypal Pic system. Results for other stellar types are presented in the following subsections.
3.1 A detailed example: Pic
Pic is an A5V main-sequence star surrounded by an optically thin debris disc, which was directly imaged for the first time more than 20 years ago (Smith & Terrile, 1984). We take this system as our reference case, since it is still by far the most extensively studied and best known debris disc system. Countless observational and theoretical studies have been dedicated to this system (e.g., the most recent ones: Chen et al., 2007; Golimowski et al., 2006; Tamura et al., 2006; Galland et al., 2006; Roberge et al., 2006; Fernández et al., 2006; Telesco et al., 2005; Thébault & Augereau, 2005; Brandeker et al., 2004; Karmann et al., 2003; Augereau et al., 2001). The disc has a wide radial extension (up to 1000 AU), but most of the detected dust is thought to reside in a relatively narrow region between 80 and 120 AU (see for example the fit of the scattered and thermal light profiles derived by Augereau et al., 2001). In a few studies water ice was considered as a possible grain component. As was already mentioned in Sect. 1, Golimowski et al. (2006) considered the presence of icy mantles as a possible explanation for the observed color changes. Likewise, Tamura et al. (2006) needed an icy component to reproduce their high resolution near-infrared and previous polarimetry observations in terms of dust scattering. In the same spirit, Augereau et al. (2001) assumed that ice might be present beyond the sublimation boundary. However, as for most debris disc systems, there is no “direct” unambiguous observational proof for the presence of icy grains. So far, the existence of ice is thus still conjectural.
We address this issue by careful modeling of the criteria for the survival of water ice. The sublimation boundary alone is first considered in a “static” case when grains are assumed to stay at a fixed distance from the star. The photosputtering rate and corresponding survival times in the same “static” assumption are estimated afterwards. Finally, the coupled effect of these mechanisms is investigated when the grain dynamical evolution is taken into account . In doing so, we imagine ice to be predominantly in H2O grain mantle, thus covering the surface (). This maximizes the erosional and dynamical evolution.
3.1.1 Sublimation boundary
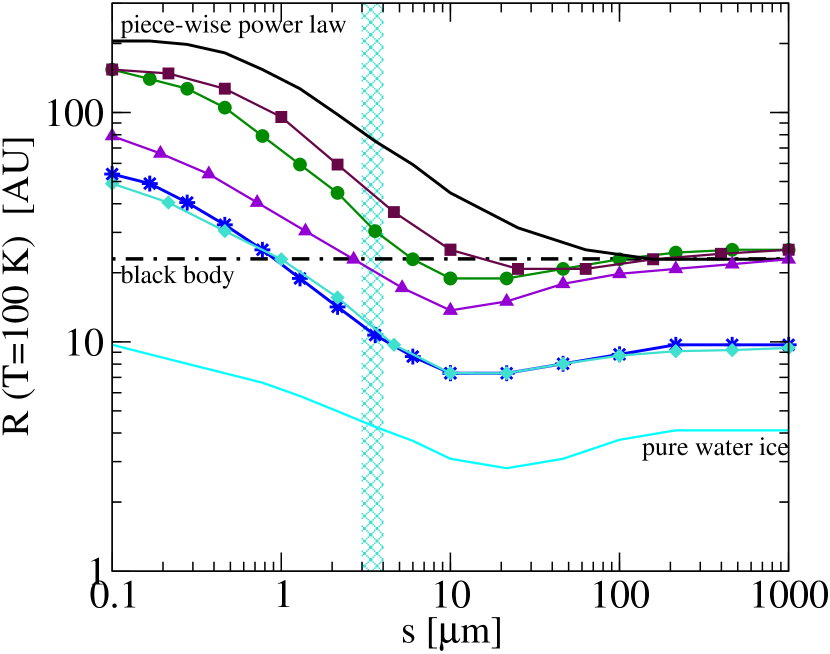
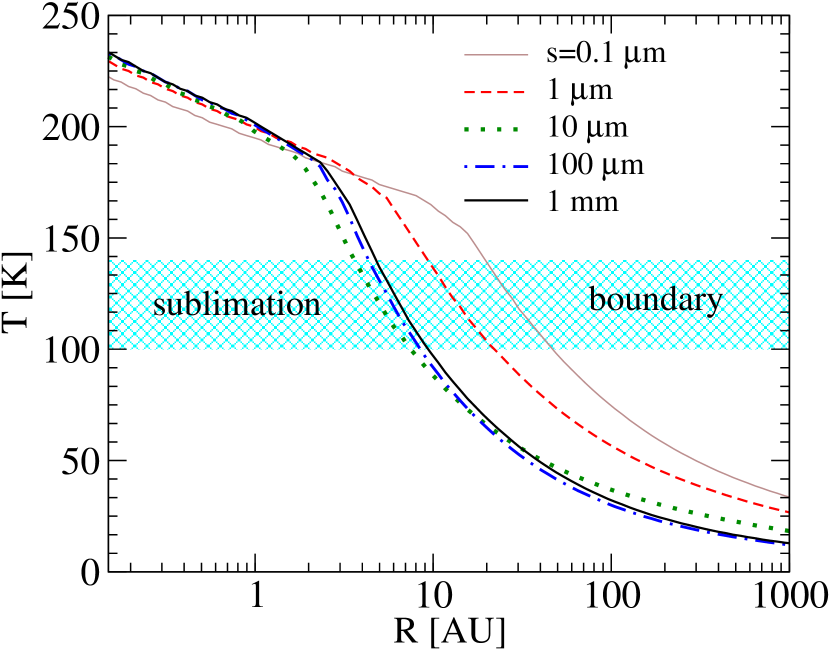
The sublimation boundary can be defined as the largest distance from the star at which the sublimation time of predominantly icy particles is shorter than any other relevant time scale (Artymowicz, 1997). We take here a very conservative range and consider the 2 extreme timescales given by the orbital period , in the 1 – 100 yr range, and the system’s age , i.e. 8 – 20 Myr (Zuckerman et al., 2001; Di Folco et al., 2004). The crucial parameter is the temperature, since (Eqs. 1 to 5). The temperature dependence is in fact so sharp that the temperature for which , i.e., K, is relatively close to the one for which , i.e. K. As a consequence, we shall as a first approximation neglect the timescale issue and conservatively consider that the sublimation boundary lies somewhere in this 100 – 140 K range. The temperature of a given grain depends schematically on 3 parameters: its size, chemical composition and distance to the star. This is illustrated in Fig. 5 where 100 K-isotherms, giving the outer limit of the sublimation boundary, are plotted for different grain compositions as a function of grain size. If we consider a reasonable intermediate compositional case of dirty ice grains, we see that the sublimation boundary lies somewhere between 5–10 AU for large mm-particles and 20–50 AU for hotter submicron-scale grains (Fig. 6). For compact grains these values are all far inside the location of the color change observed by Golimowski et al. (2006) at AU. Only very small 0.1 grains of special chemical compositions have an outer sublimation boundary approaching 120 AU (Fig. 5), but those grains should be blown out by radiation (). Thus, in the case of compact grains, our results rule out sublimation as a simple explanation for a hypothetical compositional transition at 120 AU from the star. However, if grains are highly porous, as e.g. was introduced in Li & Greenberg (1998b), and consist of many individual submicron grains, the result can be different, since such aggregates optically behave like invidual submicron grains.
3.1.2 Recondensation
Here we justify that the recondensation rate is very small and can be safely neglected in a debris disc of a late type, nearly gas free system like, e.g., Pic.
The condensation rate can be computed with the help of Eq. 1 if instead of , the actual water vapor pressure above the ice surface is substituted. In the ideal gas approximation, where is the Boltzmann constant, is the water molecule volume density in gas phase, is the gas temperature. If the gas and the grain surface are in thermal equilibrium , the condensation rate, , can be calculated as
| (17) |
To estimate we need to know . The upper limit can be obtained from the H distribution given in Brandeker et al. (2004) for the solar composition case under an oversimplified assumption that all oxygen atoms are locked in water vapor. The assumption is not realistic, since some fraction of oxygen is present in atomic phase, some is locked in CO and O2, but it gives an easy-to-estimate upper limit. This estimate333Detailed calculations of the ionization disk structure and the equilibrium chemistry network, show that for the solar composition case from Brandeker et al. (2004) cm-3 and in the metal depleted case cm-3 (Liseau, R. private communication) gives us cm-3, resulting in g cm -2 s-1 and a recondensation rate that exceeds the sublimation rate at K. Thus recondensation dominates sublimation in the outer regions of the disk, but the time scale, even for the case of orders-of-magnitude overestimated H2O vapor densities, is so high (it would take about yr to accumulate 1 m layer of ice on a grain surface) that this process can be safely ignored in the frame of debris disk systems.
3.1.3 UV sputtering
| (m) | (m yr-1) |
|---|---|
| 0.1 | 1.3 |
| 0.3 | 1.8 |
| 1 | 2.35 |
| 3 | 3.23 |
| 7 | 4.14 |
| 10 | 4.45 |
Since the disc is optically thin444Neither the amount of dust nor the amount of hydrogen (the upper limits: (HI) cm-2 (Freudling et al., 1995), (H2) cm-2 (Lecavelier des Etangs et al., 2001)) is enough to effectively shield the UV radiation, UV sputtering occurs even in the outermost regions. Taking into account the geometrical dilution of the stellar UV radiation and adopting our conservative and temperature-independent value of (see section 2.2), we obtain for the UV sputtering rate
| (18) |
The front coefficient is a weak function of grain size (Table 1), since the number of absorbed photons depends on . The corresponding sputtering destruction timescale has been plotted in Fig. 7. A first important result is that the dependence with , while being significant, is much less pronounced than for the sublimation case (Fig. 4). There is no longer an abrupt transition between the non–eroding and eroding regions, and it is difficult to define a “snowline” due to sputtering. A consequence of this result is that sputtering is unlikely to explain sharp observed changes such as the color transition at 120 AU.
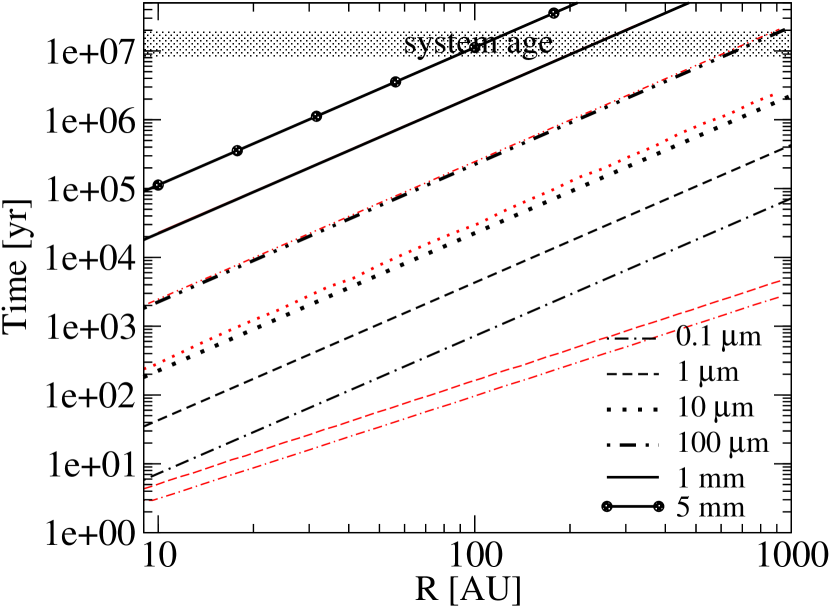
Another important result is that no “dust” grain (i.e. in the –5 mm range) can survive in the inner AU region over the system’s age. Even in the outer regions, only relatively large grains, in the sub to millimetre range, can survive. We shall consider, as a first approximation, that the minimum size for a grain which can retain its icy component over the system’s age in the 80–120 AU region where most of the Pic dust has been observed is mm.
3.1.4 Icy grain dynamics
All the time scales previously discussed were given for the “static” case, when a grain was assumed to stay at a given distance from the star. This is of course a simplification of the behavior of a “real” particle. Indeed, as a grain gets eroded, be it by sublimation or UV sputtering, its response to radiation pressure (measured by its parameter) changes. As has been shown in Sect. 2.5, this has consequences on the grain’s orbital parameters, leading to outward or inward migration depending if the ratio between the size erosion timescale is shorter or longer than the typical Poynting-Robertson timescale .
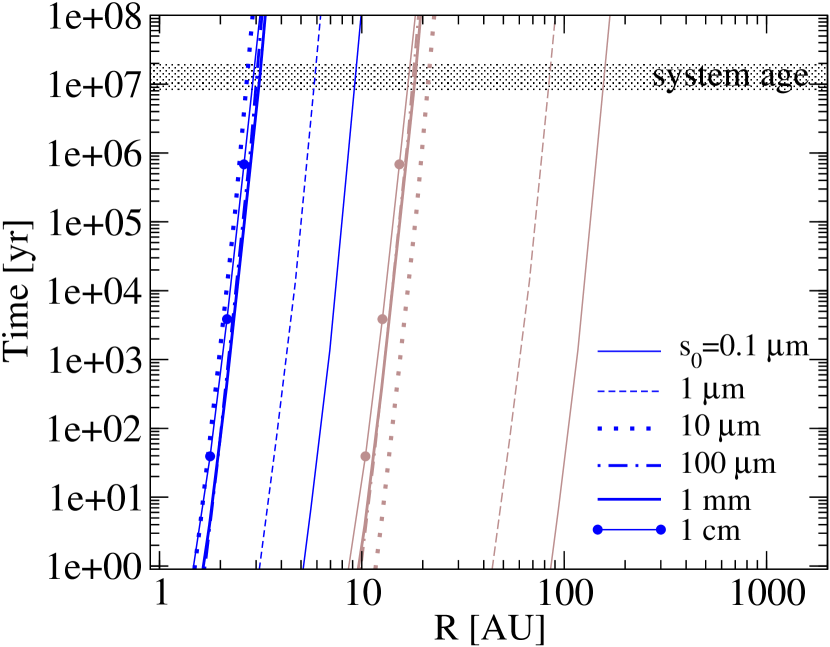
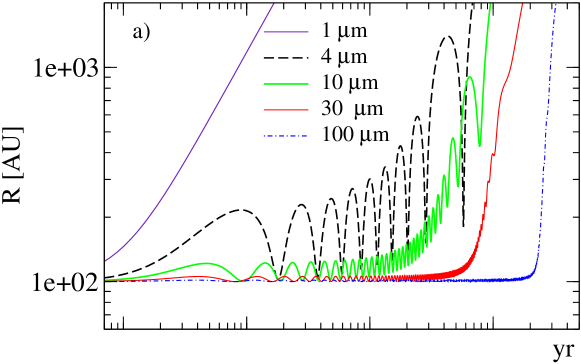
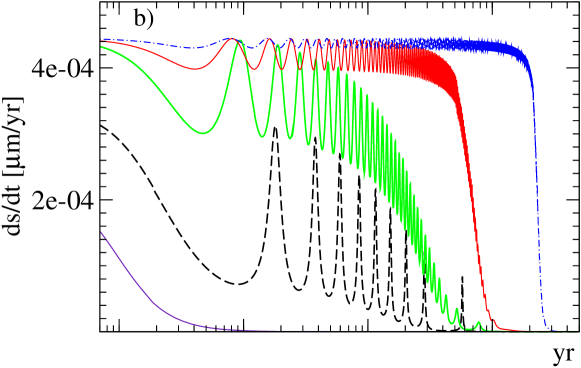
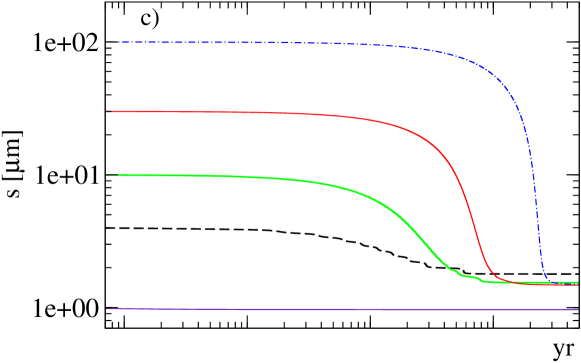
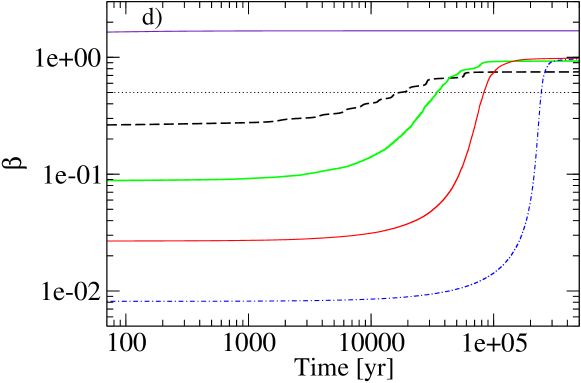
The full dynamical effect of size erosion has been taken into account in a batch of simulations where test particles motions are obtained by integrating Eq. 12 (Fig. 8). Our results show that for all initial particle sizes considered, we are here always in the outward migration regime. All particles released at 100 AU reach 1000 AU on a timescale comprised between a few yr for the smallest considered bound grains (m) and a few yr for large submillimetre grains. An interesting consequence of these strong outward migrations is that no grain ever gets fully eroded to . In fact, once grains enter the outbound orbit regime (), the outward migration rate increases very sharply and gets much higher than the size erosion rate. This imbalance between migration and erosion rates is self-amplifying: as the grain gets ejected its erosion rate rapidly decreases (since ). Eventually, the grain gets ejected from the system before it has time to be fully eroded, and its size no longer evolves once the grain has passed beyond AU and reaches an asymptotic value (see Fig. 8c). Interestingly, this asymptotic value, which is in the 1–2 m range, is relatively independent of the grain’s initial size , the only difference being that it is reached faster for initially smaller particles.
Nevertheless, the end result is the same as if the particles had been fully eroded: they are all eventually removed from the system. Moreover, for the bigger grains, the timescale for this removal (which we conservatively define as the time it takes for a grain at initial distance distance to migrate beyond ) is comparable to estimated in the previous section. Indeed, for a grain in the submillimetre to millimetre range, most of the sputtering erosion takes place at a constant distance from the star. It is then followed by a relatively brief ejection phase, which begins once its size has dropped below the limit, so that the total time from start to ejection is almost equal to the erosion time to reach (m). This time is in turn almost equal to the full erosion time (the erosion time from m to 0 being negligible compared to ). For grains with smaller initial , the situation is less simple, the time required to reach m getting significantly shorter than when is close to . Furthermore, the ejection timescale is no longer negligible compared to and has to be taken into account when estimating . For even smaller unbound grains, of course, sputtering plays only a very minor role. These particles are ejected before any significant erosion takes place, so that .
A set of additional runs has been carried out, where is estimated, for the m to 5 mm size range, as a function of initial distance from the star (Fig. 9). As expected, differences with the “static” case increase as gets smaller. For the smallest grains, is much shorter than and is comparable to the orbital timescale at 100 AU, i.e. yr.
3.1.5 Comparison with collision timescales
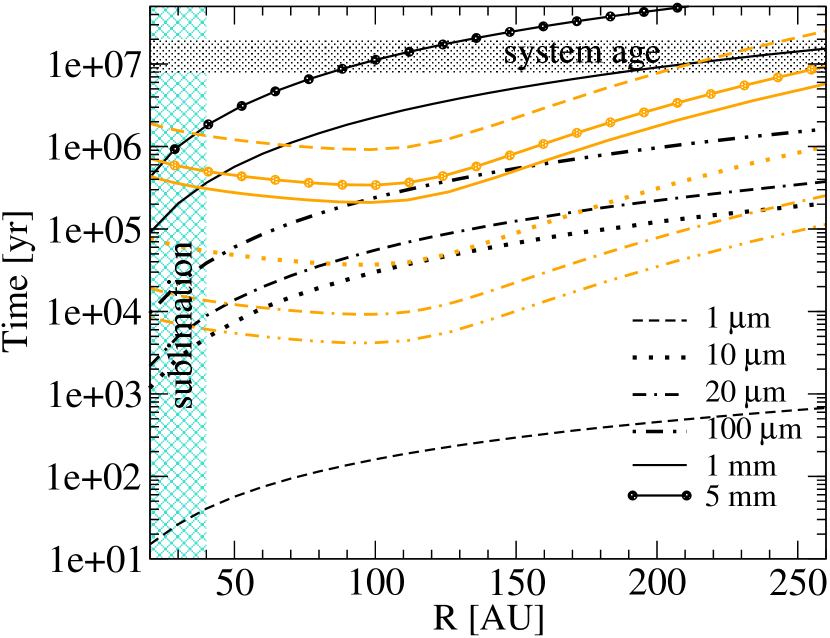
In Fig. 9, we present a summary of all our results regarding ice survival times in the Pic system. A first conclusion is that in the region where most of the dust is observed ( AU), sputtering is always the dominant ice removal mechanism. We also clearly see what has been already mentioned in the previous subsections, i.e. that for all particles in the dust size range, ice survival timescales (be it due to sublimation or sputtering erosion combined to dynamical ejection) are always shorter than the system’s age. We confirm the result derived in the static case, i.e. that the smallest icy grains which can survive in the whole AU region over yr have a size mm.
However, the system’s age is probably not the only relevant timescale, has to be compared to. Indeed, it is well established that no debris disc grains are primordial, but that they should be continuously resupplied by collisions among bigger and undetectable objects (e.g., Thébault et al., 2003, for a detailed discussion on the subject). In this case, a small and (partially) icy grain could be produced from a bigger particle for which and possibly be destroyed by another collision before sputtering is able to fully erode it.555We here consider “erosion” in the extended sense of erosion to the limit followed by dynamical ejection.
A first issue is here to see if collisions cannot by themselves evaporate all ices from a grain’s surface. From the estimates given in Table I of Tielens et al. (1994), the threshold impact velocity for achieving vaporization of water ice is km s-1. This value is very high: it exceeds the orbital velocity beyond AU, thus making the occurrence of collisions at very unlikely (except possibly for very small unbound ( grains).
The rate at which dust grains are produced and destroyed by collisions should in principle be estimated with proper numerical simulations which exceed by far the scope of this paper (see e.g. Thébault et al., 2003; Krivov et al., 2006; Thébault & Augereau, 2007). We will here consider the collisional lifetime666The collisional lifetime being defined as the time it takes for a given particle of size to lose 100% of its initial mass, be it by accumulation of numerous partially eroding (cratering) impacts, or by one violent fragmenting (i.e. total shattering) event. If the system is in collisional equilibrium, is also equal to the production lifetime, i.e. the time it takes to produce (by collisions among bigger bodies) the total number of size particles present in the system. semi-empirical formula numerically derived by Thébault & Augereau (2007) for extended debris discs, valid in the size range:
| (19) |
with and , and
| (20) |
where is the usual, and often misleading reference collision timescale directly derived from the vertical optical depth ( being the angular orbital velocity). For the radial distribution of the optical depth, we follow Grigorieva et al. (2007) and assume the best fit obtained by Augereau et al. (2001).
As can be seen from Fig. 9, the situation is a complex one. To better understand the role of collisions, let us here make the simplifying but reasonable assumption that a particle of a given size is mostly produced from collisions involving parent bodies which are typically of size (Thébault et al., 2003). Let us now consider as a reliable starting point the smallest particles that are able to retain ices over the system’s age regardless of the additional effect of collisions, i.e. the ones with . As already discussed, this corresponds to objects with size mm. Fragments produced from these parent bodies, which are predominantly in the mm range, should thus initially contain ices. Since for these 1 mm objects almost everywhere in the disc (beyond AU), we can assume that most of these grains will remain icy over their collisionally-imposed lifetime. If we carry on with this iterative procedure, we see that we can work our way down to m before begins to get comparable to in some regions of the system. For all sizes below this limit, ice survival times are smaller than collisional lifetimes, implying it is unlikely that collisionally produced fragments can remain icy. As a consequence, m may be considered as the approximate lower boundary for grains which can have an icy component in the Pic disc, at least in the 50–150 AU region where most of the dust has been detected.
Of course these results should be taken with great care, since this very complex issue should in principle be addressed using full scale collision evolution simulations. Such detailed study will be the purpose of a forthcoming paper.
3.1.6 Gas production rate
For the specific case of Pic, these studies of photosputtering and its consequences can be taken one step further than estimating grain sizes which be icy. Indeed, as mentioned in Sect. 2.3 sublimation and photosputtering do not simply “remove” ice from the system, they transform it into gas. Water molecules desorbed from the surface are quickly dissociated in gas phase by the stellar UV radiation into H and O (Li & Greenberg, 1998a). Using the assumptions of Sect. 3.1.3 together with the dust distribution derived by Augereau et al. (2001), we estimate that, should most of the grains be icy (), the corresponding production rate of gas would be yr-1, and the column density production of oxygen cm-2 yr-1. Since oxygen is expected to be neutral, it is also dynamically inert in the disc (Fernández et al., 2006). This means that oxygen released is not easily removed, and will only slowly redistribute itself in the disc. By comparing to the observed O I column density cm-2 (Roberge et al., 2006), we find that all the observed oxygen would be produced from photosputtering on an extremely short timescale, yr. Together with the fact that dust grains unexposed by radiation are continuously produced in debris from collisions, this implies that the parent bodies must be very poor in water ice. Otherwise, the efficiency of the photosputtering process would quickly refill the system with unrealistically large amounts of gaseous oxygen.
3.2 Other systems
| Name | Type | (m yr-1) | (yr) | |
|---|---|---|---|---|
| 20m | 1 mm | |||
| HD66591∗ | B4V | 7 | (2)∗ | (140)∗ |
| HD142165∗ | B5V | 0.9 | (20)∗ | ()∗ |
| Vega∗ | A0V | 0.09 | (250)∗ | ()∗ |
| HR 4796A | A0V | 0.04 | 600 | 2 |
| Fomalhaut | A3V | 3 | 7 | 3 |
| Pic | A5V | 4.5 | 5.5 | 2.3 |
| HD 40136 | F1V | 5 | 5 | 2 |
| HD 1581 | G0V | 2 | ||
| HD 20807 | G2V | 2 | ||
| Eridani | K2V | 2 | 5 | |
| AU Mic | M1Ve | 4 | 5 | 2.5 |
Performing similarly extensive studies for all debris disc systems is out of the scope of the present paper. We will here present, for a selection of 11 representative systems, estimates of at a reference distance of 100 AU, as derived from Eq.7. Furthermore, for each system we present the numerically derived values for , for a “big” 1 mm and a “small” m grain. As can be seen from Table 2, varies by 7 orders of magnitude depending on the stellar type.777UV fluxes were obtained from the MAST archive http://archive.stsci.edu/index.html. The systems with debris discs were selected from the Debris Disc Database http://www.roe.ac.uk/ukatc/research/topics/dust/identification.html.
A can be clearly seen, for all considered stars, the sputtering removal timescale of a m grain is always shorter than the age of the system. The only exception is the M star AU Mic, where the erosion timescale is Myr, i.e. at least 4 times the age of the system (12 Myr). For bigger, 1 mm grains, the situation is more favorable, at least around the less luminous G, K and M stars, where the erosion timescale of a 1 mm grain exceeds 1 Gyr. However, for F stars and upwards, millimetre-sized icy particles cannot survive for more than 1–2 yr, which is less than the minimum age of a typical debris disc.
The above numerical estimates are presented to give a first estimate of photosputtering effects as a function of stellar type and should be interpreted carefully. They are given at a reference distance of 100 AU, whereas dust might be observed significantly closer or further away from the star. This limitation is, however, not too crucial since, as a first approximation, the erosion rates and timescales we computed can be rescaled with distance following a quadratic dependence of irradiation on . Another issue that has not been addressed here is the complex interplay between sputtering and collisions. Since for most of the presented systems, dust size and spatial distribution is not as well constrained as for Pic, such an exploration would be somewhat tentative. It should, however, be kept in mind that intense collisional activity could affect grain survivability. Furthermore, the microscopic structure of the evaporating grain will certainly undergo change in the course of radiative de-icing. The resultant sputtered grain may be much more porous than in the initial phase or, on the contrary, develop a microcometary structure in which dust is mixed with ice in the large core, and with an altered organic “crust” near the surface (a possibility mentioned in Artymowicz, 1997). How the mechanical properties of a grain evolve with time in that case and how the phenomenon of dust avalanches is enhanced by icy nature of grains are new and potentially important questions.
Our preliminary conclusion is that, with the possible exception of M stars, there is no system where photosputtering effect can be fully neglected. Of course, each of these systems has to be more carefully investigated, and our sputtering erosion estimates utilized in more advanced global dust evolution models.
4 Summary and Conclusion
We have reconsidered the issue of icy grain presence and survival in debris discs by quantitatively exploring the role of UV sputtering in addition to the well known sublimation mechanism. Taking the archetypal Pic debris disc as a reference system, we show that sputtering is able to significantly erode icy grains far beyond the sublimation-imposed snow line. Using a dynamical model coupling grain erosion and orbital evolution, we find that, in the 50–150 AU region where the bulk of Pic’s grain population is thought to reside, all grains smaller than a threshold size mm (basically corresponding to all particles detectable by observations) cannot retain their icy component over the age of the system. Taking into account possible collisional activity slightly improves the situation. There is indeed a non negligible size range below for which collision timescales are shorter than sputtering erosion times, so that steady collisional reprocessing starting at grains just above (in the icy “reservoir” size range) could maintain a significant amount of smaller icy grains. However, when checking this icy grains hypothesis against the observational constraints on gas abundances, we find that the rate at which O I should be steadily produced by photosputtering would very quickly lead to column densities exceeding by several orders of magnitudes observational upper limits. This seems like a relatively robust argument for ruling out the assumption that, for the Pic system, the observed grain population is predominantly icy.
We have explored the amplitude of the sputtering mechanism for other debris discs systems, deriving sputtering rates and survival timescales, for different grain sizes, as a function of spectral type We have shown that for all stars other than M dwarfs, no icy grain in the m range can survive for more than yr, while millimetre-sized ice grains can survive in G stars and below. These derivations are of course first order approximations. The obtained erosion rates have to be included in more sophisticated dust evolution models, taking for instance into account the coupled effect of collisions and sputtering. This will be the purpose of a forthcoming study.
Acknowledgements.
We thank Helen Fraser for providing detailed comments on the manuscript, and the referee Aigen Li for the careful review.References
- Andersson et al. (2006) Andersson, S., Al-Halabi, A., Kroes, G.-J., & van Dishoeck, E. F. 2006, ArXiv Astrophysics e-prints, 124
- Artymowicz (1988) Artymowicz, P. 1988, ApJ, 335, L79
- Artymowicz (1994) Artymowicz, P. 1994, in Circumstellar Dust Disks and Planet Formation, ed. R. Ferlet & A. Vidal-Madjar, 47–+
- Artymowicz (1996) Artymowicz, P. 1996, in The Role of Dust in the Formation of Stars, Proceedings of the ESO Workshop Held at Garching, Germany, 11 - 14 September 1995. Edited by Hans U. Käufl and Ralf Siebenmorgen. Springer-Verlag Berlin Heidelberg New York. Also ESO Astrophysics Symposia (European Southern Observatory), p.137, ed. H. U. Käufl & R. Siebenmorgen, 137–+
- Artymowicz (1997) —. 1997, Annual Review of Earth and Planetary Sciences, 25, 175
- Augereau et al. (2001) Augereau, J. C., Nelson, R. P., Lagrange, A. M., Papaloizou, J. C. B., & Mouillet, D. 2001, A&A, 370, 447
- Brandeker et al. (2004) Brandeker, A., Liseau, R., Olofsson, G., & Fridlund, M. 2004, A&A, 413, 681
- Buck (1981) Buck, A. L. 1981, Journal of Applied Meteorology, 20, 1527
- Burns et al. (1979) Burns, J. A., Lamy, P. L., & Soter, S. 1979, Icarus, 40, 1
- Carlson (1980) Carlson, R. W. 1980, Nature, 283, 461
- Chen et al. (2007) Chen, C. H., Li, A., Bohac, C., et al. 2007, ApJ, 666, 466
- Chen et al. (2006) Chen, C. H., Sargent, B. A., Bohac, C., et al. 2006, ApJS, 166, 351
- Creech-Eakman et al. (2002) Creech-Eakman, M. J., Chiang, E. I., Joung, R. M. K., Blake, G. A., & van Dishoeck, E. F. 2002, A&A, 385, 546
- Di Folco et al. (2004) Di Folco, E., Thévenin, F., Kervella, P., et al. 2004, A&A, 426, 601
- Dijkstra et al. (2003) Dijkstra, C., Dominik, C., Hoogzaad, S. N., de Koter, A., & Min, M. 2003, A&A, 401, 599
- Dominik et al. (2005) Dominik, C., Ceccarelli, C., Hollenbach, D., & Kaufman, M. 2005, ApJ, 635, L85
- Fanale & Salvail (1984) Fanale, F. P. & Salvail, J. R. 1984, Icarus, 60, 476
- Fernández et al. (2006) Fernández, R., Brandeker, A., & Wu, Y. 2006, ApJ, 643, 509
- Freudling et al. (1995) Freudling, W., Lagrange, A.-M., Vidal-Madjar, A., Ferlet, R., & Forveille, T. 1995, A&A, 301, 231
- Galland et al. (2006) Galland, F., Lagrange, A.-M., Udry, S., et al. 2006, A&A, 447, 355
- Gibb et al. (2004) Gibb, E. L., Whittet, D. C. B., Boogert, A. C. A., & Tielens, A. G. G. M. 2004, ApJS, 151, 35
- Golimowski et al. (2006) Golimowski, D. A., Ardila, D. R., Krist, J. E., et al. 2006, AJ, 131, 3109
- Grigorieva et al. (2007) Grigorieva, A., Artymowicz, P., & Thébault, P. 2007, A&A, 461, 537
- Harrison (1967) Harrison, e. a. 1967, Science, 157
- Jura et al. (1998) Jura, M., Malkan, M., White, R., et al. 1998, ApJ, 505, 897
- Karmann et al. (2003) Karmann, C., Beust, H., & Klinger, J. 2003, A&A, 409, 347
- Krivov et al. (2006) Krivov, A. V., Löhne, T., & Sremčević, M. 2006, A&A, 455, 509
- Lamy (1974) Lamy, P. L. 1974, A&A, 35, 197
- Lecavelier des Etangs et al. (2001) Lecavelier des Etangs, A., Vidal-Madjar, A., Roberge, A., et al. 2001, Nature, 412, 706
- Li & Greenberg (1998a) Li, A. & Greenberg, J. M. 1998a, A&A, 331, 291
- Li & Greenberg (1998b) —. 1998b, A&A, 338, 364
- Li et al. (2003) Li, A., Lunine, J. I., & Bendo, G. J. 2003, ApJ, 598, L51
- Lien (1990) Lien, D. J. 1990, ApJ, 355, 680
- Lisse et al. (2006) Lisse, C. M., Beichman, C. A., Bryden, G., & Wyatt, M. C. 2006, ArXiv Astrophysics e-prints
- Marti & Mauersberger (1993) Marti, J. & Mauersberger, K. 1993, Geochim. Res. Lett., 20, 363
- Mauersberger & Krankowsky (2003) Mauersberger, K. & Krankowsky, D. 2003, Geochim. Res. Lett., 30, 21
- Meeus et al. (2001) Meeus, G., Waters, L. B. F. M., Bouwman, J., et al. 2001, A&A, 365, 476
- Roberge et al. (2006) Roberge, A., Lecavelier Des Etangs, A., Vidal-Madjar, A., et al. 2006, in ASP Conf. Ser. 348: Astrophysics in the Far Ultraviolet: Five Years of Discovery with FUSE, ed. G. Sonneborn, H. W. Moos, & B.-G. Andersson, 294–+
- Ruscic et al. (2002) Ruscic, B., Wagner, A. F., Harding, L. B., et al. 2002, J. Phys. Chem. A., 106, 2727
- Smith & Terrile (1984) Smith, B. A. & Terrile, R. J. 1984, Science, 226, 1421
- Smithsonian Meterological Tables (1984) Smithsonian Meterological Tables. 1984, in 5th ed., 350
- Tamura et al. (2006) Tamura, M., Fukagawa, M., Kimura, H., et al. 2006, ApJ, 641, 1172
- Telesco et al. (2005) Telesco, C. M., Fisher, R. S., Wyatt, M. C., et al. 2005, Nature, 433, 133
- Thébault & Augereau (2005) Thébault, P. & Augereau, J.-C. 2005, A&A, 437, 141
- Thébault & Augereau (2007) —. 2007, A&A, 472, 169
- Thébault et al. (2003) Thébault, P., Augereau, J. C., & Beust, H. 2003, A&A, 408, 775
- Tielens et al. (1994) Tielens, A. G. G. M., McKee, C. F., Seab, C. G., & Hollenbach, D. J. 1994, ApJ, 431, 321
- Westley et al. (1995) Westley, M. S., Baragiola, R. A., Johnson, R. E., & Baratta, G. A. 1995, Planet. Space Sci., 43, 1311
- Zuckerman et al. (2001) Zuckerman, B., Song, I., Bessell, M. S., & Webb, R. A. 2001, ApJ, 562, L87