Diffuse Galactic light at high Galactic latitude: nature and interpretation
Abstract
The hypothesis of an extended red emission (ERE) in diffuse Galactic light (DGL) has been put forward in 1998 by Gordon, Witt & Friedmann who found that scattered starlight was not enough to explain the amount of DGL in the R band, in some high Galactic latitude directions. This paper re-investigates, for high Galactic latitudes, the brightnesses and colors of DGL, integrated starlight (ISGL), and of the total extra-solar light (ISGL+DGL) measured by Pioneer. Under the traditional assumption that DGL is forward scattering of background starlight by interstellar dust on the line of sight, ISGL and Pioneer have very close colors, as it is found in Gordon, Witt & Friedmann (1998). Pioneer observations at high thus accept an alternative and simple interpretation, with no involvement of ERE in DGL.
keywords:
ISM: clouds - (ISM:) dust, extinction - ISM: general1 Introduction
Existence of a diffuse Galactic light component (DGL) in the night sky, at visible wavelengths, arising from the scattering of starlight by interstellar matter in the Galaxy, was established in the 1930s (Struve & Elvey, 1936; Elvey & Roach, 1937). It was quickly realized that the scattering is not of Rayleigh type, but that most of the scattered starlight is thrown in the direction of the incident beam; and that the grains have a large albedo (Struve, 1937; Henyey & Greenstein, 1941). The particles responsible for the scattering must therefore be large interstellar grains, rather than fine cosmic dust, presumably the same which are responsible for the linear visible extinction (Stebbins, Huffer & Whitford, 1939). Interstellar extinction and DGL occur in discrete, structured, Galactic clouds, in which dust grains and gas are intimately mixed (Lilley, 1955), and not from a pervasive, homogenous medium [Schalén (1929) and Stebbins, Huffer & Whitford (1939) for extinction; Mattila (1970); Roach & al. (1972) for DGL].
In this paper I shall be interested in DGL at high Galactic latitudes (), which is much weaker than towards the Milky Way (fig. 4 in Roach & al. (1972)), but may be easier to interpret because of the low column densities generally found along these sight-lines. Early observation of DGL at high can be found in de Vaucouleurs (1955) (see Zagury (2000)), on Palomar plates (Lynds, 1965), and in Sandage (1976). In the late 1970s’ and in the 1980s’, two major advances in astrophysical means of observation completed our understanding of DGL, and allowed a better estimate of its strength at high Galatic latitudes. Firstly, night sky brightness surveys have been done from outside our atmosphere (Pioneer observations, Toller (1981); Toller, Tanabe & Weinberg (1987)), thus facilitating evaluation of extra solar system light (DGL + direct starlight), especially at the high , since atmospheric effects are removed.
Secondly, the InfraRed Astronomical Satellite (IRAS) images have revealed the thermal emission of the same interstellar large grains responsible for the visible interstellar extinction and for DGL, and give a direct view to the interstellar clouds in which DGL takes its origin. IRAS shows that the high latitude sky is largely covered by cirrus-like interstellar clouds with average low column densities (Figs. 1, 2, 3). These high latitude clouds (HLCs) appear as extended layers of dust and gas, with filamentary structures, and represent a natural ’barrier’ between the background starlight and us. They usually lie within 1 kpc from the sun. Following the interpretation of DGL recalled above, DGL from one high latitude direction should be nothing but the light from background stars close to this direction, forward-scattered by interstellar grains within the interstellar cirrus on the line of sight. The relative proximity of HLCs from the sun is a non-negligible parameter for the proportion of DGL in Pioneer observations: the farther they are, the less scattered light we will receive because a smaller proportion of stars will participate in their illumination (the dilution of scattered starlight with distance should also intervene, but to a lesser extent, since most of it is thrown in the forward direction). High latitude nebulosities discussed in Sandage (1976) are HLCs’ regions of local brightness enhancements, either because of a local increase of the incident radiation field (due to the proximity of a bright star, for instance), a closer distance of the HLC to the sun, or because of higher column densities than the average.
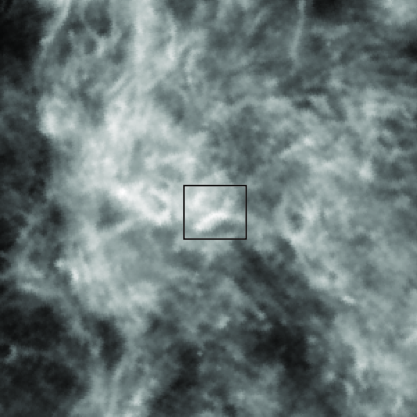
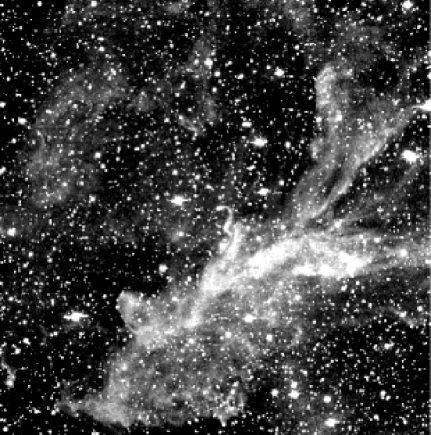
Observation of HLCs in the visible will generally require specific methods, like the recent CCD imaging techniques of low brightness objects, introduced by Guhathakurta & Tyson (1989). Even so, the visible images one obtains are confusing most of the time (figs. 2, 3, and 4 in Guhathakurta & Tyson (1989)). Only one field out of the program initiated by Guhathakurta & Tyson (1989), MCLD 123.5 +24.9 in the Polaris Flare ( pc from the sun), gave detailed high resolution images, in the B, R and I bands, of the small scale structure a high latitude cloud can have, at a resolution of (150 times better than IRAS). These images (Fig. 2) zoom into an HLC close to Polaris, and prove that interstellar cirrus are structured to much smaller scales than previously recorded by IRAS. Their analysis and comparison with IRAS image of the field (Zagury, Boulanger & Banchet 1999), demonstrate that the brightnesses of the cloud in the R and I bands is due to forward scattering by large grains, in agreement with the interpretation of DGL. It further indicates that the observed region consists in a widespread medium of low optical depth (which fills the entire image of Fig. 2), within which structures of much higher column densities (the spectacular features on the figure) are observed.
Successive improvements in the observation of DGL have permitted a refined reflection on its nature, the main question being to know whether or not forward scattering by large interstellar grains explains all of DGL. Isotropic scattering by the gas or by tiny dust, or a backscattering lobe in the scattering cross-section of the large grains, for instance, could contribute to DGL. Emission processes could also participate in some wavelength range.
An isotropic phase function, or a strong back-scattering lobe, would mean that DGL is, at least in part, reflected light. This has been suggested by Witt (1968) after an analysis of observations in the same areas as Henyey & Greenstein (1941), or by Sandage (1976), whose calculations showed that high latitude nebulosities observed in the visible could be reflected light from the Galactic plane (an hypothesis suggested by van der Bergh (1966)). None of these hypothesis however seem to hold. van de Hulst & de Jong (1969) (see also Mattila (1971)), proved that a rigorous treatment of the radiative transfer used by Witt (1968), applied to the same observations, leads to a strong forward scattering phase function and a large albedo, as Henyey & Greenstein (1941) had found. The van der Bergh - Sandage ’s proposal that HLCs are illuminated by the Galactic plane is also problematic (Zagury, 2000), since dense clumps at high latitude are observed in absorption. The findings of Toller (1981), that the ratio of DGL to direct integrated starlight (ISGL) decreases with increasing latitude and has no pronounced dependence on longitude, would further be difficult to understand, since, if illumination comes from the Galactic plane, DGL in one direction would not depend on ISGL in the same direction (and should vary with longitude). Therefore, there is at present no indication that backscattering plays a significant role in DGL, a result I will use in the rest of the paper.
The possibility of an emission process in DGL at high , in addition to scattering, was recently advanced by Gordon, Witt & Friedmann (1998) (GWF hereafter), who find that some of DGL, in the red, comes from luminescence, an emission process (ERE for ‘Extended Red Emission’) of some, yet still unknown particles, which would re-emit in the red the energy they absorb at shorter wavelengths. This discovery was strengthened by the Guhathakurta & Tyson (1989) (see also Guhathakurta & Cutri (1994)) article, who found ERE at high from an analysis of visible B and R images of HLCs.
The Guhathakurta & Tyson (1989) detection of ERE in HLCs is based on Sandage ’s hypothesis of an illumination by the Galactic plane, and on an isotropic phase function, which, as recalled above, are not verified by observation. Furthermore, the red light from MCLD 123.5 +24.9 is well explained by scattering alone, excluding any emission process : if, in MCLD 123.5 +24.9, red filaments over the field are red, it is because they are denser, and therefore extinguish blue light more quickly than red light. In the densest cores (as the dense clump detected in CO by Falgarone et al. (1998), and seen in absorption on the visible images), all B and R light is extinguished, leaving only small residual brightness in the I band, in conformity with what is expected from scattering.
The finding of ERE at high Galactic latitude meets other important difficulties. Which are these particles that must be numerous enough to produce such a large emission in the red, and will require an extreme luminescence photon conversion efficiency close to (Zubko, Smith & Witt, 1999)? Why can’t the phenomenon be reproduced on earth where we have at our disposal a much more sophisticated chemistry than can be presumed to be the case in the basic and very low density conditions of an average high latitude cirrus?
There are, therefore, reasons to question the GWF finding of ERE at high , and to confront the GWF data with what one can expect from forward scattering by large grains in HLCs. This is a critical issue since ERE has become an important and unresolved topic in the study of the interstellar medium.
This paper will be divided in two. The first part, Sects. 2 to 4, is an analysis of the GWF data and of the detection of ERE in DGL. In the second part, the low average column density of HLCs will be used to propose an approach for the calculation of HLCs’ brightness which involves only a few assumptions (a strong forward scattering phase function and a large albedo, as it has been justified previously). Orders of magnitude will be calculated for the brightnesses and colors of ISGL, DGL, and Pioneer, in the direction of a low column density cirrus, assuming DGL is scattering alone. An important outcome will be to verify whether or not these estimates can explain the very close colors found for Pioneer and integrated starlight in GWF.
2 Notations and data
I follow GWF’s notations which define, for a given direction, in units of intensities per unit solid angle: and , the Pioneer surface brightnesses in the B and R bands, after zodiacal light has been substracted; and , the ‘integrated star/Galaxy light’ (ISGL) for objects with V-magnitudes larger than 6.5 (), estimated from a compilation of several star catalogues; and the B and R brightnesses of DGL. Stars brighter than mag in V have been substracted to the data for the calculation of these quantities.
With these definitions
| (1) |
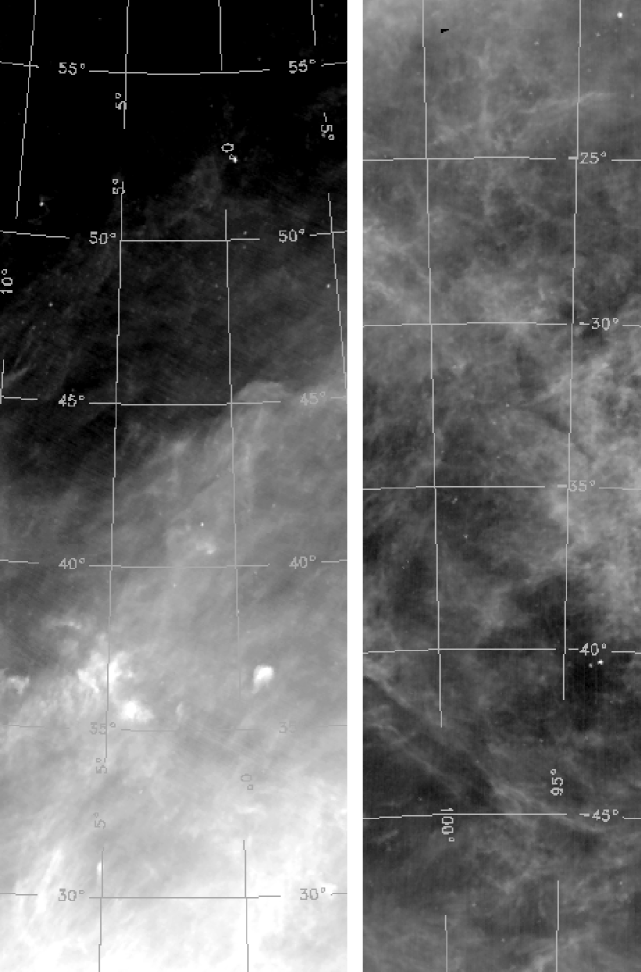
and , and , and and , are estimated in boxes large, and along two cuts at Galactic longitudes , between latitudes and , and , with , called respectively region (a) and region (b).
Fig. 3 displays IRAS m images of regions (a) and (b). Region (b) and the high latitudes areas () of region (a) each sample a low column density HLC. The two lower Galactic latitude areas of field (a) are at the edge of the Scorpio-Centaurus association.
The color of either Pioneer, ISGL, or DGL, is the ratio of the brightnesses in the R and B bands. The larger it is, the redder the color under consideration.
The input data, from which all quantities will be deduced, of GWF’s work are Pioneer’s night sky brightnesses in the B and R bands (brightest stars apart), and , on the one hand, the integrated starlight and galaxies brightnesses (brightest stars apart), and , computed from several star catalogues, on the other. Relative error margins estimated in GWF are and for and (sect. 2.1 in GWF), for and . Therefore, the error margins on Pioneer and ISGL colors are
| (2) |
(with , Fig. 4).
The error on the color difference is .
3 GWF demonstration of a non scattered component in DGL
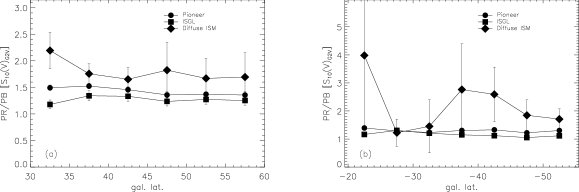
By subtracting the estimated ISGL to Pioneer B and R brightnesses, GWF calculate and , the B and R DGL brightnesses. DGL color is then compared to ISGL’s and Pioneer’s. GWF conclude: “From Figure 14, it is obvious that the diffuse ISM is redder (larger ratio) than either the Pioneer measurements or the ISGL. As the scattered component of the diffuse ISM (DGL) is bluer (see § 4.1) than Pioneer measurements, this requires that the nonscattered component is present in the red diffuse ISM intensity.” (GWF, p.531).
Fig. 14 of GWF is reproduced here (Fig. 4).
GWF demonstration of a non-scattered component in DGL is thus divided into two. GWF first attempt to show from observations that DGL is redder than ISGL and Pioneer. In the mean time, § 4.1 of GWF relies on the Witt-Petersohn (‘WP’) model (Witt & Petersohn, 1994) to show that scattered-DGL should be bluer than ISGL and Pioneer. The contradiction between observations and the WP model leads the authors to assume there is ERE in DGL.
4 Comparison of ISGL, DGL and Pioneer colors
4.1 On the detection of ERE in DGL at and
The second part of the GWF demonstration will easily be accepted: HLCs, as long as they are of low column density (presumed to be the case at high Galactic latitudes), must give a bluer scattered-DGL than ISGL does. In view of GWF fig. 14 (here Fig. 4), and of the very large error bars on DGL color, the problem is rather to determine how precise is the comparison of DGL color to Pioneer’s or ISGL’s?
The comparison, undertaken in GWF, of DGL’s to Pioneer’s or ISGL’s colors is extremely unprecised due to the considerable amplification of the error margin of DGL color (Fig. 4), a consequence of the successive subtractions and division necessary to its estimate. However, as demonstrated below, this comparison can be done with much better accuracy through a direct comparison of the ‘input’ data, ISGL and Pioneer colors.
Indeed, to compare and is like comparing and . This is also equivalent to the comparison of and of ; that is (Equalities 1) of and of .
Therefore, the comparison of and is strictly equivalent to the comparison of and of . One will similarly prove that the comparison of DGL color to Pioneer’s , is equivalent to that of ISGL and Pioneer.
We have
| (3) |
Comparison of DGL and ISGL colors could have been resumed, with far better accuracy, to that of the input data, Pioneer’s and ISGL’s.
For DGL to be much redder than ISGL, Pioneer needs to be significantly redder than ISGL. It is seen from the two bottom curves in each plot of Fig. 4 (fig. 14 in GWF) that this is generally not the case. For all areas except the lower latitude one of field (a) (and maybe also the (a) area at ), ISGL and Pioneer colors are equal within the error margin. It is therefore incorrect to deduce from this figure that observed DGL is redder than ISGL.
The only areas in which one could claim to have detected ERE are the two lowest latitudes of cut (). Notwithstanding, the ISGL color is abnormally low in these areas. While it is expected to strongly increase when moving towards the Galactic plane (see Fig. 5; the lowest latitude areas of field () cover regions with high column densities and should have an even redder ISGL color than shown on the figure), the GWF’s ISGL color along the cut decreases at the lowest latitudes. Therefore, either these two areas do not follow standard Galactic laws, or, the error margin given in GWF are underestimated (at least in these areas). The later case would imply that it is not possible to guarantee that Pioneer is, in these areas, much redder than ISGL. In the former, since is much higher in these areas than at higher latitudes (Sect. 6), it is still necessary to prove that scattered-DGL must be bluer than ISGL (this will be discussed in Sect. 6.1.2). Dense clumps in MCLD 123.5 +24.9 for instance have nearly no blue surface brightness, and thus appear red, but this is an effect of extinction, not of ERE.
4.2 Error bars in the GWF data
The too blue ISGL color found in field (a) low latitude areas could result from the method used to calculate B and R magnitudes of stars in the GWF Master Catalog, generally from the magnitude at one wavelength alone. For stars and galaxies with a magnitude between 9.5 and 13, B and R magnitudes are extrapolated either from the V () or J () magnitudes of the Guide Star Catalog (sect. 3.2 in GWF). For stars between 6.5 V magnitude and 9.5 magnitude, with no available B and/or R magnitudes, GWF will estimate the R and B magnitudes from the V one, with an algorithm which supposes a uniform reddening, dependent on the stars’ distance only. This algorithm is the same for all regions, and does not take into account the much larger extinction in the lower latitude areas of field (a). It would be good to know, in each area, what proportion of ISGL’s B and R brightnesses was extrapolated by this method. A possible correction would necessarily go in the sense of a redder ISGL (and a color closer to Pioneer’s) than shown on the left plot of Fig. 4 for the low latitude points. In this case, the conservative error margin adopted in GWF (sect. 2.1) for the calculation of ISGL is underestimated.
A second puzzling question on the GWF data concerns the ratios of DGL to ISGL in B and in R. These ratios, are, from figs. 12 and 13 in GWF (the values are unfortunately not tabulated in the paper), of order in and in B (corresponding to DGL/Pioneer ratios of and ). This represents a considerable amount of DGL, even higher to what is found in the direction of the Galactic plane (). From Toller (1981), or table 39 of Leinert et al. (1998), ratios should be less than for , with no pronounced dependence on Galactic longitude. A too large DGL/ISGL ratio can result either from an over-estimate of Pioneer brightnesses, or, from an under-estimate of ISGL. A correction would necessarily increase the proportion of ISGL in Pioneer, and here again, contribute to make Pioneer and ISGL colors on Fig. 4 even more indistinguishable.

5 Modeling Pioneer data at high latitudes
Beside the question of an emission process in the red, the GWF paper raises the important problem of the pertinence of a model, and of the reliability of the conclusions one will deduce from it. To show that scattered-DGL should be bluer than ISGL (or Pioneer), and to estimate the strength of the non-scattered DGL (due to emission), the authors compute from a model which is meant to represent the Galaxy (“Such a model exists and it is the Witt-Petersohn DGL model…The WP model treats the Galaxy as a gigantic reflection nebula.” GWF, p.23) the color of scattered DGL. The model of the Galaxy is constructed from HI measurements in different directions, from which the authors will deduce a structure for the interstellar medium on the lines of sight.
The WP model predictions never match the R band observations of DGL. For field (a) the predicted DGL scattered light surface brightness is lower than the observed one, which the authors attribute to the presence of ERE (fig. 16 in GWF); in field (b) however, the predicted R brightness is curiously larger than the observed one (where is the ERE?). In the blue (fig. 15 in GWF), where ERE is not suspected, there is no more agreement between the model and the observations: the model fails to reproduce the shape of observed DGL in field (a); it is larger for field (b) by a factor of 4.
On what basis is it possible to accredit the conclusions of a model which is so far from the reality of the observations it is meant to describe? GWF argue that any change of parameters in the model will give the same scattered-DGL color, bluer than ISGL and Pioneer (fig. 17 of GWF), and therefore that observed DGL is definitely redder than it should be if it was scattering alone. This may be inherent to the GWF-WP model, and certainly true for scattering through a low column density medium (in which case no model is necessary), but does it mean that all models will give the same color? When will DGL be bluer than ISGL and Pioneer, and can’t it be redder?
Models for the interstellar medium have been used (Mattila & Scheffler (1978), and references therein) to study the properties of DGL, and may be justified for regions close to the Galactic plane, which sample sight-lines with separated layers of different and high optical depths. The situation at high Galactic latitudes is much different. In HLCs with low column densities on the average, in which CO is generally not detected, high optical depth clumps must give a marginal contribution to the overall brightness of the cirrus at visible wavelengths, which should allow the use of low column densities approximations, and avoid constraining the structure of the interstellar medium in a way we are not able to verify. This might provide an easier and more realistic way to understand the observations at hand.
6 Analysis of DGL data at high Galactic latitudes
Field (), and the areas of field () with a Galactic latitude of over , have 100 m surface brightnesses between 1.5 MJy/sr and 5 MJy/sr (the infrared surface brightness decrease with increasing Galactic latitude is due to the decrease of the radiation field). A m to visible extinction ratio of MJy/sr/mag (Boulanger & Pérault, 1988), will give values of less than 0.3 mag.
The same order of magnitudes will be deduced from the NASA/IPAC ExtraGalactic Database (NED: http://nedwww.ipac.caltech.edu/index.html) calculator of Galactic extinction (Schlegel et al., 1998). NED provides, from the analysis of infrared IRAS and DIRBE images, mean values of averaged over fields wide, with a precision of . For all but the two lowest latitude areas in (a), ranges from 0.1 to 0.3 mag., with corresponding between 0.07 and 0.25, and between 0.1 and 0.4. , , given by NED are deduced from and standard conversion factors (Table 3 of Cardelli et al. (1989)). For the two lowest latitudes of (a), NED will find between 0.5 and 0.7, between 0.3 and 0.6, and between 0.6 and 1.
The low average optical depth values found in all bands and in most of the GWF areas imply that high column density clumps, if there are any, occupy a very small fraction of the sky and do not contribute much to DGL in these directions. Except, maybe, for the two lowest latitude areas in (a), the radiative transfer through the cirrus on the line of sight, independently of its structure, can be treated using the single scattering approximation (Zagury et al., 1999) (eventually the low column density approximation when is sufficiently small). These approximations constitute, for a given optical depth, an upper value of the scattered light surface brightness (in the front direction, it will diminish with multiple scattering).
For one direction of the sky (one direction at high , as considered by GWF), and a given optical band (B, R, or V), let be the average optical depth of the cirrus in that direction, and the surface brightness (units of power per unit area per unit solid angle and unit wavelength) of direct starlight corrected for the cirrus reddening.
I introduce , the proportion of reddened by cirrus on the line of sight (). is the proportion of which either comes from stars in front of the cirrus, or from background stars seen through a hole. is linked to the spatial repartition of the stars and to the filling factor of the cirrus. Blue stars being, on the average, closer to the Galactic plane should be larger than . , as shown below, and will be an important parameter when the area which is considered contains directions with much different optical depths than the average.
will be the proportion of forward scattered by the cirrus, which is equal to the albedo, , of interstellar grains, if single scattering applies and for a large forward scattering phase function of the grains. The exact value of , which is known to be large, is not a critical point for the orders of magnitudes which will be derived. For calculation purposes I will use, as GWF did and as it is traditionally accepted (see fig. 5 of Mathis, Rumpl & Nordsieck (1977); Draine (2003); GWF and references therein): .
The surface brightness, , of light forward scattered by a cirrus on the line of sight can be estimated from the energy balance between the forward directed light impinging on the cirrus, and coming out from it. The light absorbed by the cirrus corresponds to a surface brightness, using the single scattering approximation, of . Consequently
| (4) | |||||
does not depend on the exact shape of the phase function (as long as it is forward directed).
Then
| (5) |
Since ISGL is observed to be redder than the source radiation field , must be larger than 1. With , it implies that is larger than , and therefore: .
In any band, the ratio of DGL to ISGL is (Eqs. 5)
| (6) | |||||
The last approximation holds for the areas in which NED finds low column densities on the average (up to ). In these areas, for to be between 0.15 and 0.20 (table 39 of Leinert et al. (1998)), or more (GWF), with an albedo , needs to be close to 1. Therefore most of the direct starlight we receive from fields (a) and (b) comes from behind the cirrus on the lines of sight (Fig. 3) and is largely reddened by them. With , from Eqs. 5
| (7) |
If is less than at high latitudes (table 39 of Leinert et al. (1998)) is less than , which is what NED finds over field (b) and the high latitudes areas of field (a). Scattered-DGL to ISGL ratios larger than 0.3 in B, as it is found in GWF (figs. 12 and 13), would imply larger optical depths () along these sight-lines.
The ratio of the input data ISGL and Pioneer (last equality of Eqs. 7), , should be larger in R than in B, with in between and . GWF find a larger ratio in B ( to against 65 to in R, fig. 12 in GWF), and a difference of . This difference between expectations and the GWF data could be related to the possible sources of error on Pioneer and ISGL discussed in Sect. 4.2.
With , colors are
The color difference between Pioneer and ISGL will be
| (9) | |||||
will give a color difference of in absolute value, and a conservative of less than 0.17. ISGL and Pioneer are thus expected to have very close colors, which agrees, despite the possible sources of error in the data (Sect. 4), with Fig. 4. To establish the presence of ERE in DGL, it is necessary to prove that Pioneer is redder than ISGL, and that the colors are separated with better precision than the present (Sect. 2).
Eqs. LABEL:eq:col1 also show that, as long as one can consider a mean reddening over the field, DGL will be twice bluer (even bluer than found in GWF), than ISGL or Pioneer. This may not always be the case however. If the medium is structured, and contains clumps of high optical depth but with small surface coverage, the color of ISGL could be that of the region outside the clumps and not differ much from the color of , while the color of DGL will be . DGL will be redder than ISGL for values larger than .
For high column density clumps (of optical depth , large enough for blue light to be neglected, and with small overall surface coverage) immersed in a medium of negligible optical depth (), one will obtain
| (10) | |||||
and
| (11) |
since single scattering gives an upper limit of scattered light brightness. Pioneer is now, as DGL, redder than ISGL. But, while the difference of reddening between DGL and ISGL can be large, the color difference between Pioneer and ISGL will remain small, less than (with and ).
6.1 Discussion
6.1.1 Low column densities regions
With little assumptions the preceding calculations give a quantitative account of observations of night sky background starlight at high Galactic latitudes. It is clear from Eqs. LABEL:eq:col1 that in areas where column densities are not too high, DGL will be much bluer than the unreddened starlight color (by a factor of 2) and thus than ISGL or Pioneer. However, Pioneer color in these areas is not determined by DGL, but by ISGL, and the color difference between ISGL and Pioneer is expected to be extremely small, as was observed.
These results are in conformity with what simple reasoning would give. At high latitudes, extinction is e.g. low, Pioneer should be dominated by the ISGL, which suffers little extinction, while DGL represents a smaller fraction of Pioneer’s surface brightness, because little extinction also means little scattering. Thus, Pioneer’s color should ressemble that of ISGL. On the other hand, DGL is expected to be much bluer, in the proportion of . However, because DGL is weak, its color won’t be easily determined, unless Pioneer and ISGL brightnesses can be set precisely.
The interpretation of GWF fig. 14 (here Fig. 4) for areas in field (a) at , and over all field (b), is then straightforward: in these areas, ISGL and Pioneer have very close colors which cannot be separated within the GWF error margin.
Local increases of column density in these areas, due to the small scale structure of the medium, will not modify the low column density approximation. Because of the low optical depths NED finds in field (b) and for the (a)-field areas at , the number of such high density clumps must remain marginal. Note that CO is not detected in these areas.
6.1.2 Effect of an increase of column density on the observed colors
To get better insight into the effect an increase of column density can have, I have considered (end of Sect. 6) the case in which one of the GWF areas would be composed of very dense clumps (dense enough to extinguish background starlight, and absorb all blue light, as for the dense clump mentioned in Zagury et al. (1999)) with an appreciable surface coverage, embedded in a low column density medium. The color of DGL, given by the color of the clumps, will be red. The color of ISGL, on the contrary, will be given by the stars observed through the low column density medium, and be much bluer than DGL. In this case, scattered-DGL, and Pioneer, can be redder than ISGL.
We see that the relative colors of DGL, Pioneer, and ISGL, depend on the column density and on the structure of the interstellar medium. The claim that DGL should always be bluer than ISGL, whichever model is used, is therefore not correct.
The (a) areas under (3 data-points on Fig. 4) are in the densest parts of the HI loop at the edge of the Scorpio-Centaurus association and have high infrared surface brightnesses. Zeta Oph (), a few degrees apart, may contribute to the heating of the region and to the enhancement, up to MJy/sr, of its m infrared emission. Notwithstanding, the column density must be higher in these areas than it is in the higher latitudes ones of field (a), or in field (b). There is, in these areas, an increase in the average HI column density (de Geus, 1988), and hence of the visible extinction, attested by the much higher values found by NED; CO is detected at the brightest IRAS positions (Laureijs et al., 1995). The highest column densities are also proved by the drop in ISGL brightnesses (GWF, fig. 12, left plot) GWF finds in these areas.
It is improbable, however, that the higher column densities in these regions can explain the difference between Pioneer and ISGL colors observed on Fig. 4. It would first require clumps with values larger than 1 and an appreciable surface coverage (end of Sect. 6). Even so, the color difference between ISGL and Pioneer should be much less than 0.2 (if DGL is scattered light only). As pointed out in Sect. 4.2, this difference needs to be confirmed by a more precise estimate of the uncertainties in the GWF data.
7 Conclusion
This study of DGL at high has first unravelled several problems in the method and data GWF have used to propose detection of ERE in DGL. It was also found that the near equality between Pioneer and ISGL colors, found by GWF, is expected if DGL results from the scattering of background starlight by interstellar dust in the cirrus on the line of sight. Also, orders of magnitudes have been calculated which agree with observation and do not introduce assumptions on the structure of the interstellar medium, for the strength and color of Pioneer, ISGL, and (scattered) DGL, at high Galactic latitudes.
Concerning the GWF paper, it was remarked that comparison of DGL and Pioneer or ISGL colors could be reduced, with far better accuracy and no need of estimating the color of DGL, to the comparison of Pioneer and ISGL colors. This comparison shows that, in most areas, Pioneer and ISGL colors are equal within the error margins. It is therefore not possible to conclude, in these areas, on the presence of ERE in DGL.
It is only in the two areas of field (a) at latitudes under that Pioneer and ISGL colors are separated enough to indicate a possible detection of ERE. However, column densities in these areas, at the edge of Scorpio-Centaurus association, are much larger than at higher latitudes, so that there is no more guaranty that DGL should be bluer than ISGL.
Detection of ERE in GWF coincides with peculiarities of the GWF data which would need a detailed examination: a too blue color of ISGL in the low latitudes areas of field (a), and a much too large proportion of DGL in Pioneer, in all areas. The algorithm used to derive ISGL’s B and R brightnesses, from the V magnitude of the stars, doesn’t integrate the larger optical depths along some lines of sight, and may contribute to its too blue color in the lowest latitudes of field (a). The much larger DGL/ISGL ratio () than expected (, Toller (1981); Leinert et al. (1998)), especially in the red, found in GWF, may indicate that Pioneer background night sky brightnesses are overestimated or that ISGL’s are underestimated. Correction of either one or the other effects will bring ISGL and Pioneer colors of GWF’s fig. 14 even closer. Therefore, either uncertainties have been underestimated, or, Galactic longitudes and have specific, remarkable properties which need to be investigated.
The investigations and orders of magnitude derived in Sect. 6, for Pioneer, ISGL, and scattered-DGL brightnesses and color, are consistent with observation. They show the agreement between the observed range of average optical depths given by NED in fields (a) and (b), and the observed ratios of DGL to ISGL given by Toller (1981) or table 39 of Leinert et al. (1998), assuming all of DGL is scattered starlight. They explain the close colors of ISGL and Pioneer, which cannot be separated within the precision of the observations, found in most of the GWF areas. These investigations also prove that scattered-DGL can take a wide range of colors, from much bluer than ISGL and Pioneer in not too high column density media, to much redder than ISGL if the medium is structured and contains clumps of sufficiently high values. ISGL’s color should always stay close to that of Pioneer.
Pioneer data can therefore be well understood, without the use of a hypothetical model of the interstellar medium, within the traditional comprehension of DGL, which is the scattering of background starlight by dust embedded in foreground interstellar cirrus. In this respect, IRAS images, combined with reddening estimates and models of the distribution of stars in the Galaxy, appear to be a powerful tool for the analysis of DGL observations.
It will also be noted that this standard interpretation of DGL was found to hold well for the visible images of HLC MCLD 123.5 +24.9, at a resolution better than , in comparison to the GWF boxes.
In view of the analysis here of the data presented by GWF, the detection of ERE in the diffuse interstellar medium seems premature, and requires further investigations.
Acknowledgments
This work was partially funded by a NATO fellowship.
References
- van der Bergh (1966) van der Bergh S., 1966, AJ, 71, 990
- Boulanger & Pérault (1988) Boulanger F., Pérault M., 1988, ApJ, 330, 964
- Cardelli et al. (1989) Cardelli J.A., Clayton, Mathis J.S., 1989, ApJ, 345, 245
- de Vaucouleurs (1955) de Vaucouleurs, G., 1955, AJ, 60, 126
- Draine (2003) Draine B.T., 2003, ApJ, 598, 1017
- Elvey & Roach (1937) Elvey C.T., Roach F.E., 1937, ApJ, 85, 213
- Falgarone et al. (1998) Falgarone E., Panis J.F., Heithausen A., Pérault M., Stutzki J., Puget J.L., Bensch F., 1998, A&A, 331, 669
- de Geus (1988) de Geus E., 1988, Ph.D. thesis, Leiden University
- Gordon, Witt & Friedmann (1998) Gordon K.D., Witt A.N., Friedmann B.C., 1998, ApJ, 498, 522 (GWF)
- Guhathakurta & Tyson (1989) Guhathakurta P., Tyson J.A, 1989, ApJ, 346, 773
- Guhathakurta & Cutri (1994) Guhathakurta, P. & Cutri, R.M., 1994, ASP Conf. Series, 58, 34
- Henyey & Greenstein (1941) Henyey L.C., Greenstein J.L., 1941, ApJ, 93, 70
- van de Hulst & de Jong (1969) van de Hulst H.C., de Jong T., 1969, Physica, 41, 151
- Laureijs et al. (1995) Laureijs R.J., Fukui Y., Helou G., Mizuno A., Imaoka K., Clark F.O., 1995, ApJS, 101, 87
- Leinert et al. (1998) Leinert Ch., et al., 1998, A&AS, 127,1
- Lilley (1955) Lilley A.E., 1955, ApJ, 121, 559
- Lynds (1965) Lynds, B.T., 1965, ApJS, 12, 163
- Mattila (1970) Mattila K., 1970, A&A, 9, 53
- Mattila (1971) Mattila K., 1971, A&A, 15, 292
- Mattila & Scheffler (1978) Mattila K., Scheffler H., 1978, A&A, 66, 211
- Mathis, Rumpl & Nordsieck (1977) Mathis J.S., Rumpl W., Nordsieck K.H., 1977, ApJ, 217, 425
- Roach & al. (1972) Roach F.E., Smith L.L., Pfleiderer J., Batishko C., Batishko K., 1972, ApJ, 173, 343
- Robin et al. (2003) Robin A.C., Reylé C., Derrière S., Picaud S., 2003, A&A, 409, 523
- Sandage (1976) Sandage, A., 1976, AJ, 81, 954
- Schalén (1929) Schalén C., 1929, Ast. Nach., 236, 249
- Schlegel et al. (1998) Schlegel D., Finkbeiner D.P., Davis M., 1998, ApJ, 500, 525
- Stebbins, Huffer & Whitford (1939) Stebbins J., Huffer C.M., Whitford A.E., 1939, ApJ, 90, 209
- Struve & Elvey (1936) Struve O., Elvey C.T., 1936, ApJ, 83, 162
- Struve (1937) Struve O., 1937, ApJ, 85, 194
- Toller (1981) Toller G.N., Ph.D. Thesis, State University of New York at Stony Brook
- Toller, Tanabe & Weinberg (1987) Toller G.N., Tanabe H., Weinberg J.L., 1987, A&A, 188, 24
- Witt (1968) Witt A.N., 1968, AJ, 152, 59
- Witt & Petersohn (1994) Witt A.N., Petersohn L.K., 1994, ASP Conf. Ser. 58, eds R.M. Cutri & W.B. Latter
- Zagury et al. (1999) Zagury F., Boulanger F., Banchet V., 1999, A&A, 352, 645
- Zagury (2000) Zagury F., 2000, NewA, 5, 285
- Zubko, Smith & Witt (1999) Zubko V.G., Smith T.L., Witt A.N., 1999, ApJ, 511, L57