11email: guedel, atellesc@astro.phys.ethz.ch 22institutetext: Max-Planck-Institute for Astronomy, Königstuhl 17, 69117 Heidelberg, Germany
The X-ray soft excess in classical T Tauri stars
Abstract
Aims. We study an anomaly in the X-ray flux (or luminosity) ratio between the O vii 21.6-22.1 triplet and the O viii Ly line seen in classical T Tauri stars (CTTS). This ratio is unusually high when compared with ratios for main-sequence and non-accreting T Tauri stars (Telleschi et al. 2007). We compare these samples to identify the source of the excess. A sample of recently discovered X-ray stars with a soft component attributed to jet emission is also considered.
Methods. We discuss data obtained from the XMM-Newton Extended Survey of the Taurus Molecular Cloud (XEST) project, complemented by data from the published literature. We also present data from the CTTS RU Lup.
Results. All CTTS in the sample show an anomalous O vii/O viii flux ratio when compared with WTTS or MS stars. The anomaly is due to an excess of cool, O vii emitting material rather than a deficiency of hotter plasma. The excess plasma must therefore have temperatures of MK. This soft excess does not correlate with UV excesses of CTTS, but seems to be related with the stellar X-ray luminosity. The spectra of the jet-driving TTS do not fit into this picture.
Conclusions. The soft excess depends both on the presence of accretion streams in CTTS and on magnetic activity. The gas may be shock-heated near the surface, although it may also be heated in the magnetospheric accretion funnels. The soft component of the jet-driving sources is unlikely to be due to the same process.
Key Words.:
Stars: coronae – Stars: formation – Stars: pre-main sequence – X-rays: stars1 Introduction
Classical T Tauri stars (CTTS) are optically revealed young stars distinguished by spectra showing strong line emission of, e.g., H or Ca ii H&K. Their H and ultraviolet (UV) line and continuum emission is times stronger than in active main-sequence (MS) stars, regardless of the photospheric effective temperature but correlated with the mass accretion rates derived from the optical continuum (Bouvier, 1990; Johns-Krull et al., 2000). The consensus, based on such correlations and line profiles, is that accreting material is heated in shocks near the stellar surface (e.g., Calvet & Gullbring 1998; Gullbring et al. 1998). Some of the emission lines (e.g., H, Ca ii) may also form in the accretion funnels or in stellar winds (Ardila et al., 2002).
Nearly free-falling gas will indeed heat to maximum temperatures K in shocks (Calvet & Gullbring, 1998). UV and optical line emission thus diagnoses the accretion velocity, the mass accretion rate, and possibly the surface filling factor of accretion funnels. If the photoelectric absorption by the accreting gas is small, then the softest X-ray range may reveal the high- tail of the shock emission measure. Güdel (2006), Telleschi et al. (2007c) and Güdel et al. (2007c) were first to identify an excess in the O vii/O viii Ly flux (or luminosity) ratio in CTTS when compared with MS stars, or weak-line T Tauri stars (WTTS) in the XEST project (Güdel et al., 2007a), the so-called X-ray soft excess of CTTS. This feature may define the high- continuation of the excess emission diagnosed for the K range.
The appreciable accretion rates predict shock densities of cm-3, as first indeed reported for the CTTS TW Hya from line diagnostics of O vii and Ne ix, forming at a few MK (Kastner et al., 2002; Stelzer & Schmitt, 2004). However, some accreting young stars show much lower , such as AB Aur (Telleschi et al., 2007b) and T Tau (Güdel et al., 2007c); the same discrepancy between expected and observed has also been reported from UV density diagnostics (Johns-Krull et al., 2000).
Here, we present new evidence for the soft excess and discuss it in a larger context. We are interested in comparing CTTS with WTTS to assess whether the anomaly can be attributed to accretion in CTTS; we will therefore include WTTS as a test sample and compare with samples of MS stars. Further, we will test whether the anomalous O vii/O viii flux ratio is due to a high O vii flux or rather due to a suppressed O viii Ly flux. We compare these stellar samples with a small group of accreting, jet-driving stars that also show an anomalous soft component (Güdel et al., 2007b). We also compare the X-ray soft excess with UV line and continuum excesses reported earlier.
2 Data and Results
Ratios between fluxes in the O vii triplet (, summed over all three lines) and the O viii Ly 18.97 line have been derived from fluxes from Telleschi et al. (2007c) (for the WTTS HD 283572, V773 Tau, V410 Tau, and HP Tau/G2; for the CTTS SU Aur, DH Tau, DN Tau, BP Tau; and for the Herbig star AB Aur), Güdel et al. (2007c) (for the CTTS T Tau N), Robrade & Schmitt (2006) (for the CTTS BP Tau, TW Hya, and CR Cha), Argiroffi et al. (2005) (for the multiple CTTS-WTTS system TWA 5; it is unknown whether the CTTS or the WTTS is the dominant X-ray source), Günther et al. (2006) (for the CTTS V4046 Sgr), and Argiroffi et al. (2007) (for the old CTTS MP Mus), and our own analysis for the CTTS RU Lup.111XMM-Newton ObsID 0303900301, observed on 2005 August 8 during 29.8 ks; data reduction followed the same procedures as described by Güdel et al. (2007a) and Telleschi et al. (2007c); the line fluxes were found from spectral fits based on the apec model in the XSPEC software package (Arnaud, 1996). Key results: Three spectral components with keV, keV, and keV; emission measure ratio = 1.0:2.9:1.5; cm-2. Luminosity of the O vii triplet: erg s-1; of the O viii Ly line: erg s-1; total X-ray [0.3 keV, 10 keV] luminosity: erg s-1. The distance to RU Lup is 140 pc (Bertout et al., 1999).
We determined the unabsorbed fluxes by correcting for wavelength-dependent transmission, as calculated in XSPEC using the “wabs” model. We used the absorption column densities, , toward the target stars, also given by the above authors. We adopted cm-3 for V4046 Sgr, as suggested by Günther et al. (2006). Finally, line luminosities were calculated using the published distances.
Total X-ray luminosities, , were taken from the same authors; for V4046 Sgr, the spectral line fluxes are about half as high as for TW Hya (see comparison in Günther et al. 2006) while the distance seems to be very uncertain; we adopted a distance of 83 pc (Quast et al., 2000); the uncertainties will not be crucial for our investigation. For MP Mus, distance and are from Mamajek et al. (2002).
Data for solar-analog (G-type) MS stars were taken from Telleschi et al. (2005), and for a larger MS sample from Ness et al. (2004). These authors list , the energy fluxes (in erg cm-2 s-1) in the O viii Ly line and in the O vii He triplet (only the line in Ness et al. 2004), from which (O viii) resp. (O vii) were calculated. For these stars, is low and does not need to be considered.

Fig. 1 highlights the soft excess for the CTTS T Tau N. The figure compares the X-ray spectrum of the active, evolved binary HR 1099 dominated by emission from a K-type subgiant (top panel; archival XMM-Newton data, see Audard et al. 2001) with the spectrum of the weakly absorbed WTTS V410 Tau (Telleschi et al., 2007c), the CTTS T Tau (Güdel et al., 2007c), and the old single F-type star Procyon (archival XMM-Newton data, see Raassen et al. 2002). HR 1099 and V410 Tau show the typical signatures of a hot, active corona: a strong continuum, strong lines of Ne x, and highly-ionized Fe lines but little flux in the O vii line triplet. In contrast, the spectrum of Procyon is dominated by lines of C, N, and O, the O vii triplet exceeding the O viii Ly line in flux. The observed spectrum of T Tau reveals a hybrid situation, with signatures of a very active corona shortward of 19 Å but also an unusually strong O vii triplet. Because its hydrogen absorption is large (in contrast to V410 Tau - note the latter’s N vii Ly 24.8 line formed over a wide temperature range), we have modeled the intrinsic, unabsorbed spectrum based on transmissions determined in XSPEC (based on the “wabs” model) using from Güdel et al. (2007c) ( cm-2), but also the somewhat lower value found from EPIC spectra ( cm-2; Güdel et al. 2007a). In either case, the O vii lines are now the strongest lines in the X-ray spectrum, reminiscent of the situation in Procyon.
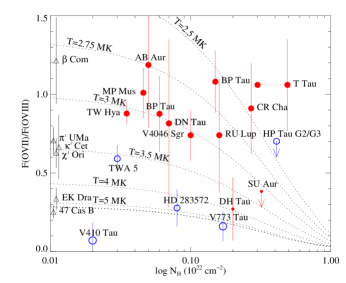
Fig. 2 shows the measured (absorbed) O vii/O viii Ly photon-flux ratio, , versus the X-ray determined 222DN Tau has been reconsidered, with very similar results as in Telleschi et al. (2007c); for SU Aur and HP Tau G2/G3, upper limits to the O vii flux derived by Telleschi et al. (2007c) [see also their Fig. 8] have been adopted; BP Tau is plotted twice, given the discrepant values between Robrade & Schmitt (2006) and Telleschi et al. (2007c). CTTS and WTTS are marked, respectively, by filled (red) and open (blue) circles; the flaring CTTS SU Aur and DH Tau are marked by small, filled circles. The dotted lines mark the loci of for an isothermal plasma; the labels give the electron temperatures. The plasma contributing to O vii and O viii is, however, not isothermal as the hotter plasma also contributes to the O viii flux. All CTTS show in this range of . WTTS are found at much lower values; their published spectra show at best marginal evidence of the O vii triplet (e.g., Telleschi et al. 2007c).
MS solar analogs are plotted near although their true are much lower. Characteristic coronal temperatures, , of MS stars are a function of . For solar analogs at different activity levels, increases from MK for a solar twin with erg s-1 to MK for a ZAMS star with erg s-1 (Telleschi et al., 2005). Consequently, is expected to decrease toward higher activity levels (i.e., the O vii line becomes progressively less important; Fig. 1). This is indeed the case, the most active solar analog in the sample, 47 Cas B, showing , and the least active one, Com, . The values of for WTTS and the two active, near-ZAMS stars 47 Cas B and EK Dra are similar, whereas for CTTS they are similar to inactive solar analogs with ages of Gyr.
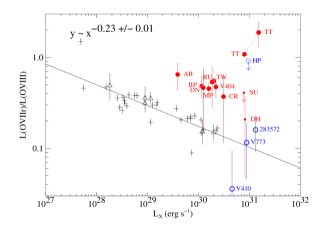
Fig. 3a shows the ratio between the intrinsic (unabsorbed) luminosities of the O vii and the O viii Ly lines as a function of , comparing with solar analogs from Telleschi et al. (2005) and the larger MS sample from Ness et al. (2004). For the TTS of Telleschi et al. (2007c), a good approximation to compute (O vii ) from (O vii) is (O vii ) (O vii) (Porquet et al., 2001).333We cannot strictly use the ratio to derive the fractional flux of the O vii line (Porquet et al., 2001) because the plasma is unlikely to be isothermal. The trend of a decreasing ratio with increasing for MS stars is followed by the sample of WTTS, while CTTS again show a significant excess. This also holds if the the surface X-ray flux () is used on the abscissa (not shown).
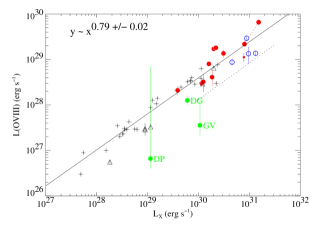
In principle, a suppressed O viii Ly flux in CTTS would produce the same anomaly, but as we show in Fig. 3b, (O viii) of CTTS and WTTS both follow the same trend (rather than being suppressed for CTTS by a factor of 3–4), also indistinguishable from MS stars. Therefore, the CTTS soft excess is due to an excess in the O vii flux.
We also consider a sample of strongly accreting Two-Absorber X-ray (TAX) sources that show an anomalous soft component additional to a much more strongly absorbed coronal component; the soft component contributes essentially all of the observed O vii and O viii Ly flux; it has been interpreted as originating from the base of jets (Güdel et al., 2007b). The low-resolution EPIC spectra are not useful to derive an ratio, but the spectral fits are appropriate to estimate the luminosity in the dominant O viii Ly line from the model. Overplotting (O viii) in Fig. 3b shows a poor correlation, as should be expected because the coronal component shows a separate (harder) spectrum whose O viii Ly line is, however, entirely absorbed.
3 Discussion and conclusions
All CTTS (except the two flaring ones) show an X-ray soft excess defined by an anomalously high ratio between the fluxes of the O vii triplet and the O viii Ly line, compared to WTTS and MS stars. The anomaly refers to CTTS only, while WTTS show line ratios comparable with very active MS stars. In contrast, the correlation between (O viii) and is indistinguishable between CTTS, WTTS, and MS stars, suggesting that the CTTS soft excess is indeed due to an excess of cool material with MK rather than a relative suppression of the O viii Ly line (e.g., due to resonance scattering). The strongly accreting TAX sources do not fit into this picture; strong absorption makes their coronal O vii and O viii Ly lines inaccessible.
Is the X-ray soft excess described here the high-temperature equivalent of the UV/optical continuum and line excesses? We correlated (O vii ), which is dominated by the excess emission, with UV Si ii, Si iv, C iv, and 1958 continuum luminosities (all strongly dominated by excess emission) derived from fluxes presented by Valenti et al. (2000), applying the extinction law given by Cardelli et al. (1989). No correlation was found. This is little surprising given that the UV excess luminosities amount to times the levels of “normal” stars, with a large scatter over the entire range (Johns-Krull et al., 2000), while the O vii excess is comparatively small. Fig. 3 in fact suggests that for most CTTS reported here, the (O vii )/(O viii) ratio is a factor of 3–4 that of equivalent MS stars, i.e., (O vii ) scales with (O viii) as in MS stars, except that it is enhanced by a factor of 3–4. (O viii) in turn is “normal” and scales with (Fig. 3b). Because O vii and O viii have overlapping formation temperature ranges, their flux ratio cannot take arbitrary values for reasonable EM distributions. However, much larger (but also smaller) excesses are easily possible given the variations in the UV excess. For very cool excess plasma, the added O vii flux could be small and the correlation with the UV excess be masked by scatter, but then the O vii would be close to the “normal” coronal level.
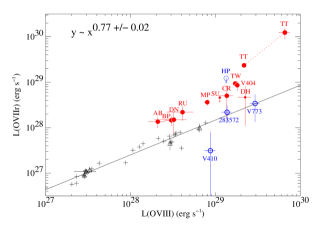
The (O vii ) vs. (O viii) relation is shown in Fig. 3c (to avoid larger error bars, we have used (O vii ) without the minor correction for the non-excess contribution). This trend does not connect to the behavior of the UV excess at lower but is reminiscent of the systematic factor deficiency of (harder) X-rays from hotter plasma in CTTS with respect to WTTS (Telleschi et al., 2007a). It appears that the X-ray soft excess depends on the level of magnetic (“coronal”) activity. At the same time, it depends on the presence of accretion.
Magnetic accretion streams may shock-heat gas at the impact point in the stellar photosphere to X-ray emitting temperatures. If (O vii ) (similarly to the UV excess, Johns-Krull et al. 2000), and since (Muzerolle et al., 2003), (Telleschi et al., 2007a), and (O viii) (Fig. 3b), one might expect (O vii ) (O viii)1.49±0.18 although this is not a physical relationship. This relation is steeper than in Fig. 3c; also, a direct correlation with the UV excess (which itself correlates with ; Johns-Krull et al. 2000) is not seen.
On the other hand, the two dependencies may point to an interaction between accretion and magnetic activity. The cool, infalling material may partly cool pre-existing heated coronal plasma, or reduce the efficiency of coronal heating in the regions of infall (Preibisch et al., 2005; Telleschi et al., 2007c; Güdel et al., 2007c). A model of this kind in which the soft excess is formed in the accretion funnels by the coronal heating process would make a correlation with the (coronal) plausible, and would at the same time explain why CTTS are statistically X-ray fainter compared with WTTS (Preibisch et al., 2005; Telleschi et al., 2007a). The deficit of hot material may then reflect in additional, cooled (or less heated) plasma evident in the soft excess in CTTS, i.e., the soft excess connects to the hotter, coronal EM, as observed, rather than to the cooler UV excess. Either way, it clearly argues in favor of a substantial influence of accretion on the X-ray properties of pre-main sequence stars.
Acknowledgements.
We thank our referee, Fred Walter, for stimulating suggestions that have improved this paper. Kevin Briggs is acknowledged for help in the data reduction. The International Space Science Institute (ISSI) in Bern financially supported the XEST project. This research is based on observations obtained with XMM-Newton, an ESA science mission with instruments and contributions directly funded by ESA member states and the USA (NASA).References
- Ardila et al. (2002) Ardila, D., Basri, G., Walter, F. M., Valenti, J. A., & Johns-Krull, C. M. 2002, ApJ, 567, 1013
- Argiroffi et al. (2005) Argiroffi, C., Maggio, A., & Peres, G., et al. 2005, A&A, 439, 1149
- Argiroffi et al. (2007) Argiroffi, C., Maggio, A., & Peres, G. 2007, A&A, 465, L5
- Arnaud (1996) Arnaud, K. A. 1996, in Astronomical Data Analysis Software and Systems V, ed. G. Jacoby & J. Barnes (San Francisco: ASP), 17
- Audard et al. (2001) Audard, M., Güdel, M., & Mewe, R. 2001, A&A, 365, L318
- Bertout et al. (1999) Bertout, C., Robichon, N., & Arenou, F. 1999, A&A, 352, 574
- Bouvier (1990) Bouvier, J. 1990, AJ, 99, 946
- Calvet & Gullbring (1998) Calvet, N., & Gullbring, E. 1998, ApJ, 509, 802
- Cardelli et al. (1989) Cardelli, J. A., Clayton, G. C., & Mathis, J. S. 1989, ApJ, 345, 245
- Güdel (2006) Güdel, M. 2006, in High-Resolution X-Ray Spectroscopy; http:// www.mssl.ucl.ac.uk/gbr/workshop2/, astro-ph/0609281
- Güdel et al. (2007a) Güdel, M., Briggs, K. R., Arzner, K., et al. 2007a, A&A, 468, 353
- Güdel et al. (2007b) Güdel, M., Telleschi, A., Audard, M., et al. 2007b, A&A, 468, 515
- Güdel et al. (2007c) Güdel, M., Skinner, S.L., Mel’nikov, S.Y., et al. 2007c, A&A, 468, 529
- Gullbring et al. (1998) Gullbring, E., Hartmann, L., Briceño, C., & Calvet, N. 1998, ApJ, 492, 323
- Günther et al. (2006) Günther, H.M., Liefke, C., & Schmitt, J.H.M.M. 2006, A&A, 459, L29
- Johns-Krull et al. (2000) Johns-Krull, C.M., Valenti, J.A., & Linsky, J.L. 2000, ApJ, 539, 815
- Kastner et al. (2002) Kastner, J. H., Huenemoerder, D. P., Schulz, N. S., Canizares, C. R., & Weintraub, D. A. 2002, ApJ, 567, 434
- Mamajek et al. (2002) Mamajek, E. E., Meyer, M. R., & Liebert, J. 2002, AJ, 124, 1670
- Muzerolle et al. (2003) Muzerolle, J., Hillenbrand, L., Calvet, N., Briceño, C., & Hartmann, L. 2003, ApJ, 592, 266
- Ness et al. (2004) Ness, J.-U., Güdel, M., Schmitt, J. H. M. M., Audard, M., & Telleschi, A. 2004, A&A, 427, 667
- Preibisch et al. (2005) Preibisch, T., Kim, Y.-C., Favata, F., et al. 2005, ApJS, 160, 401
- Porquet et al. (2001) Porquet, D., Mewe, R. Dubau, J., Raassen, A. J. J., & Kaastra, J. S. 2001, A&A, 376, 1113
- Quast et al. (2000) Quast, G. R., Torres, C. A. O., de La Reza, R., da Silva, L., & Mayor, M. 2000, IAU Symp. 200, eds. B. Reipurth & H. Zinnecker, 28
- Raassen et al. (2002) Raassen, A. J. J., Mewe, R., Audard, M., et al. 2002, A&A, 389, 228
- Robrade & Schmitt (2006) Robrade, J., & Schmitt, J.H.M.M. 2006, A&A, 449, 737
- Stelzer & Schmitt (2004) Stelzer, B., & Schmitt, J. H. M. M. 2004, A&A, 418, 687
- Telleschi et al. (2005) Telleschi, A., Güdel, M., Briggs, K. R., et al. 2005, ApJ, 622, 653
- Telleschi et al. (2007a) Telleschi, A., Güdel, M., Briggs, K. R., et al. 2007a, A&A, 468, 425
- Telleschi et al. (2007b) Telleschi, A., Güdel, M., Briggs, K. R., et al. 2007b, A&A, 468, 541
- Telleschi et al. (2007c) Telleschi, A., Güdel, M., Briggs, K. R., et al. 2007c, A&A, 468, 443
- Valenti et al. (2000) Valenti, J.A., Johns-Krull, C.M., & Linsky, J.L. 2000, ApJS, 129, 399