Self-regulated gravitational accretion in protostellar discs
Abstract
We present a numerical model for the evolution of a protostellar disc that has formed self-consistently from the collapse of a molecular cloud core. The global evolution of the disc is followed for several million years after its formation. The capture of a wide range of spatial and temporal scales is made possible by use of the thin-disc approximation. We focus on the role of gravitational torques in transporting mass inward and angular momentum outward during different evolutionary phases of a protostellar disc with disc-to-star mass ratio of order 0.1. In the early phase, when the infall of matter from the surrounding envelope is substantial, mass is transported inward by the gravitational torques from spiral arms that are a manifestation of the envelope-induced gravitational instability in the disc. In the late phase, when the gas reservoir of the envelope is depleted, the distinct spiral structure is replaced by ongoing irregular nonaxisymmetric density perturbations. The amplitude of these density perturbations decreases with time, though this process is moderated by swing amplification aided by the existence of the disc’s sharp outer edge. Our global modelling of the protostellar disc reveals that there is typically a residual nonzero gravitational torque from these density perturbations, i.e. their effects do not exactly cancel out in each region. In particular, the net gravitational torque in the inner disc tends to be negative during first several million years of the evolution, while the outer disc has a net positive gravitational torque. Our global model of a self-consistently formed disc shows that it is also self-regulated in the late phase, so that it is near the Toomre stability limit, with a near-uniform Toomre parameter . Since the disc also has near-Keplerian rotation, and comparatively weak temperature variation, it maintains a near-power-law surface density profile proportional to .
keywords:
accretion, accretion discs — hydrodynamics — instabilities — ISM: clouds — stars: formation1 Introduction
The presence of finite angular momentum in a prestellar cloud core provides a significant obstacle to the formation of stellar-sized objects, contributing to the overall “angular momentum problem” of star formation. Even the relatively small ( km s-1 pc rad s-1) rotation rates measured in cloud cores (e.g. Goodman et al., 1993) imply that most of the infalling matter will land on a protostellar disc rather than directly on to the protostar. Indeed, discs are observed or inferred around at least some class 0 and class I protostars, most T Tauri stars, and even around brown dwarfs. However, the observed mass ratios between the disc and central object are typically (Andrews & Williams, 2005; Scholz et al., 2006). This implies that there is an efficient mechanism to transport angular momentum outward and mass inward that sets in very early during the life of the disc and even while it is forming.
Vorobyov & Basu (2005b, 2006) have recently modeled numerically the self-consistent collapse of a rotating molecular cloud leading to the formation and evolution of a protostellar disc. During the early ( Myr) evolution, mass infall from the core envelope can episodically destabilise the disc through gravitational instability and lead to the formation of spiral structure and dense clumps within the arms. Gravitational torques associated with the spiral arms drive the clumps on to the protostar, generating mass accretion and luminosity bursts comparable to those observed in FU Ori stars. During this early phase, most of the protostellar mass is accreted during the bursts rather than in the quiescent phase between the bursts. The early burst phase terminates when the infalling envelope has lost most of its gas reservoir. The protostar then enters a T Tauri phase and its subsequent evolution is characterised by a low-level accretion. The physical mechanism or mechanisms that drive this low-level accretion are not well understood. The magnetorotational instability (MRI; Balbus & Hawley, 1998) has been suggested as the means of angular momentum and mass transport in protostellar discs. However, the thermal ionisation in most parts of T Tauri discs is too low to allow sufficient magnetic coupling for the MRI to operate. This problem may be mitigated by invoking nonthermal ionisation by cosmic rays in the upper layers of the disc (Gammie, 1996), or X-rays from the central star (Glassgold et al., 1997). Turner et al. (2007) have shown that the MRI-induced activity can indeed extend to the disc midplane at distances AU under some circumstances. Nevertheless, the overall ability of partial unstable regions of the disc to drive effective transport throughout the disc remains unresolved. Furthermore, Hartmann et al. (2006) have recently suggested that a combination of the MRI and gravitational instabilities may be necessary to explain the observed accretion rates for at least the more massive T Tauri stars.
Given the lingering uncertainties associated with the MRI and the additional suggestion made by Hartmann et al. (2006) that disc masses may have been systematically underestimated (due to poorly constrained dust opacities), it is tempting to consider the T Tauri accretion phase as merely the residual phase of gravitationally driven accretion. Numerical simulations of isolated protostellar discs do indicate that gravitational instabilities may work if the disc masses are sufficiently large (e.g. Tomley et al., 1991; Laughlin & Bodenheimer, 1994; Lodato & Rice, 2005), and efforts have also been made to describe the effect of such global instabilities in terms of local viscous dynamics (e.g. Lodato & Rice, 2004). Numerical studies with simple prescribed cooling and heating have shown that the nonaxisymmetric structure in protostellar discs washes out and density fluctuations become less than one per cent when the Toomre -parameter becomes larger than a few (e.g. Pickett et al., 2000; Lodato et al., 2007). However, it is not clear when this phase begins and gravitational instabilities cease to operate.
In our opinion, the fundamental limitation of the above numerical simulations is in the isolated nature of the model discs. The onset of the axisymmetric phase (if any) should depend not only on the disc physics but also on the physics of the surrounding medium. The infall of gas from the surrounding envelope (certainly in the early evolutionary phase) or gravitational perturbations from companions and parent nonaxisymmetric molecular cloud can drive a protostellar disc away from an axisymmetric state. A memory of initial core conditions also determines the distribution of angular momentum and mass in the disc as well as its intrinsic size. Edge-effects can certainly affect the disc’s ability to support persistent density fluctuations, as we emphasise in this paper. As Larson (1984) pointed out, even small density fluctuations of the order of a few per cent in a self-gravitating disc can create gravitational torques that can provide angular momentum transport comparable to what is often invoked via the ad-hoc -viscosity mechanism. Observations do seem to support the existence of a pronounced nonaxisymmetry in discs that are several Myr old, e.g. around AB Aurigae (Fukagawa et al., 2004) and HD 100546 (Grady et al., 2001). Hence, it is important for numerical models to take into account the effects of the environment on the long-term evolution of protostellar discs.
In this paper we extend our previous numerical analysis of disc accretion (Vorobyov & Basu, 2005b, 2006) to the T Tauri phase. We start our simulation in the prestellar phase and terminate it when the central protostar and the surrounding disc are about 3 Myr old. Such long integration times are made possible by the use of the thin-disc approximation. We are particularly interested in the ability of gravitational torques to drive accretion in relatively aged protostellar discs. Here, we focus on the evolution of a single model in order to present a detailed study of the internal disc dynamics. A parameter study is left for future presentation.
2 Model description and initial conditions
We use the thin-disc approximation to compute the evolution of nonaxisymmetric rotating, gravitationally bound cloud cores. For details of the basic equations, numerical methods, and numerical tests we refer the reader to Vorobyov & Basu (2006). Here we briefly provide the basic equations. For simplicity, we neglect the contribution of a frozen-in supercritical magnetic field (accounted for in some models of Vorobyov & Basu, 2006), which does not change the main qualitative results. The equations of mass and momentum transport are
| (1) | |||||
| (2) |
where is the mass surface density, is the vertically integrated gas pressure, is the velocity in the disc plane, is the gravitational acceleration in the disc plane, and is the gradient along the planar coordinates of the disc. The system of equations is closed with a barotropic equation that makes a transition from isothermal to adiabatic evolution at a critical density, i.e.
| (3) |
where is the isothermal sound speed, is the ratio of specific heats, and g cm-2, which corresponds to a critical number density cm-3 under the assumption of vertical hydrostatic equilibrium (see Vorobyov & Basu, 2006). Equation (3) yields a density-temperature relation that is in good agreement with the density-temperature relation derived using exact spherically symmetric frequency-dependent radiation transfer simulations (for a detailed comparison see Vorobyov & Basu, 2006). We have also not included the effect of stellar irradiation, which can be a significant heating source in the disc during the late accretion phase (Chiang & Goldreich, 1997). Such considerations require detailed modeling of (or assumptions about) the vertical structure (e.g. flaring) of the disc (see also Garaud & Lin, 2007). For simplicity, we do not keep track of the vertical structure of the disc in this study. The gravitational potential in the plane of the disc is computed as
| (4) | |||||
where is the radius of the cloud core (see Binney & Tremaine, 1987).
Equations (1)–(4) are solved in polar coordinates on a numerical grid with points. The radial points are logarithmically spaced. The innermost grid point is located at AU, and the size of the first adjacent cell is 0.3 AU. We initiate the accretion phase after the central surface density exceeds by introducing a “sink cell” at AU, which represents the central protostar plus some circumstellar disc material, and impose a free inflow inner boundary condition. The outer boundary (at 8000 AU) remains fixed in position and there is no radial inflow or outflow allowed, i.e. the cloud has a constant mass and volume.
In this paper we analyse the details of the internal disc dynamics for a single model which follows the evolution of a cloud core with initial mass and outer radius pc. The gas has a mean molecular mass and is initially isothermal with temperature K. The subsequent high-density evolution is of course not isothermal due to our barotropic equation of state. The initial surface density () and angular velocity () distributions are characteristic of a collapsing axisymmetric magnetically supercritical core (Basu, 1997):
| (5) |
| (6) |
These profiles have the property that the specific angular momentum is a linear function of the enclosed mass. We choose a central surface density g cm-2 (corresponding to a central number density cm-3) and , so that the latter is comparable to the Jeans length of an isothermal sheet. The central angular velocity is km s-1 pc-1.
3 Long-term evolution of the mass accretion rate
Our simulations employing the thin-disc approximation can perform efficient calculation of the time evolution starting from the prestellar phase and ending in the T Tauri phase when the central protostar is about 3 Myr old. Such long-term integration coupled with resolution of a wide range of length scales is currently prohibitive for three-dimensional simulations.
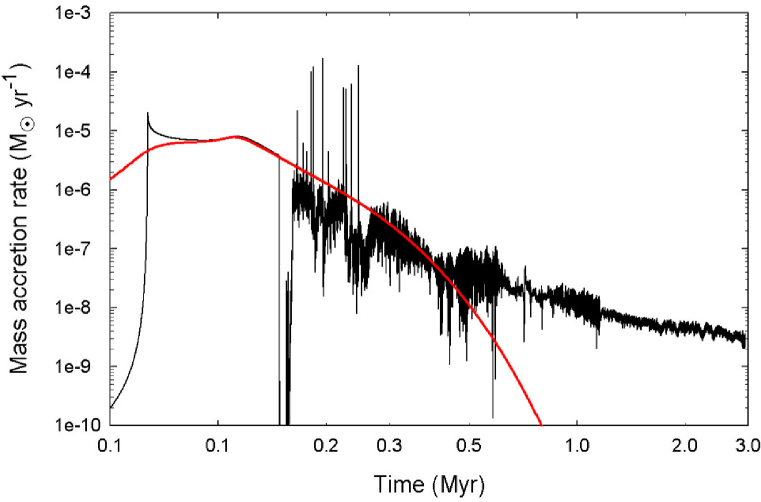
The solid line in Fig. 1 shows the temporal evolution of the mass accretion rate in to the sink cell, where we use the inflow velocity of gas at AU. A sharp increase in the mass accretion rate at Myr to a peak value yr-1 marks the formation of the central protostar. The subsequent evolution is characterised by a near-constant accretion at yr-1 until Myr when the rarefaction wave from the outer boundary approaches the protostar. This phenomenon is explained in detail by Vorobyov & Basu (2005a). The mass accretion rate then gradually declines until Myr when the first layer of gas from the infalling envelope hits a centrifugal barrier outside the sink cell and the protostellar disc begins to form. During the subsequent evolution, matter initially lands on the disc rather than falling directly in to the central sink. The mass accretion rate initially drops to a negligible value but rises to yr-1 shortly thereafter. The enhanced accretion is attributable to newly developed gravitational instability and spiral structure, induced by the continuous infall of matter from the envelope. Dense clumps form within the spiral arms and are quickly driven on to the protostar by the action of gravitational torques from the spiral arms. These episodes of clump infall produce the bursts of mass accretion seen in Fig. 1 between Myr and Myr. During the bursts, yr-1, which is reminiscent of the FU Ori eruptions. This “burst mode” was discussed in detail by Vorobyov & Basu (2005b, 2006). We note that the disc mass never exceeds , which is reached at 0.45 Myr. Subsequently, it gradually declines to at 3 Myr. These numbers correspond to disc-to-star mass ratios of 0.15 and 0.11, respectively.
In this paper, we focus on the evolution of the mass accretion rate after the bursts cease to occur. Figure 1 indicates that is in the range yr-1 in the quiescent phase between the bursts and then decreases gradually in the later residual accretion phase (after the burst mode has ended), reaching yr-1 at Myr. It is interesting to compare with , the mass accretion rate on to the disc, calculated at AU. This is safely outside the centrifugal disc that is usually localised within the inner 100 AU. The red line shows the evolution of . It is greater than during the quiescent phase of the burst mode and becomes much less than after Myr. The bursts tend to occur during the time that . In principle, this inequality can be estimated observationally and used to determine if a disc is in the quiescent phase of the burst mode, i.e. in between mass accretion bursts.
4 Radial structure of protostellar discs
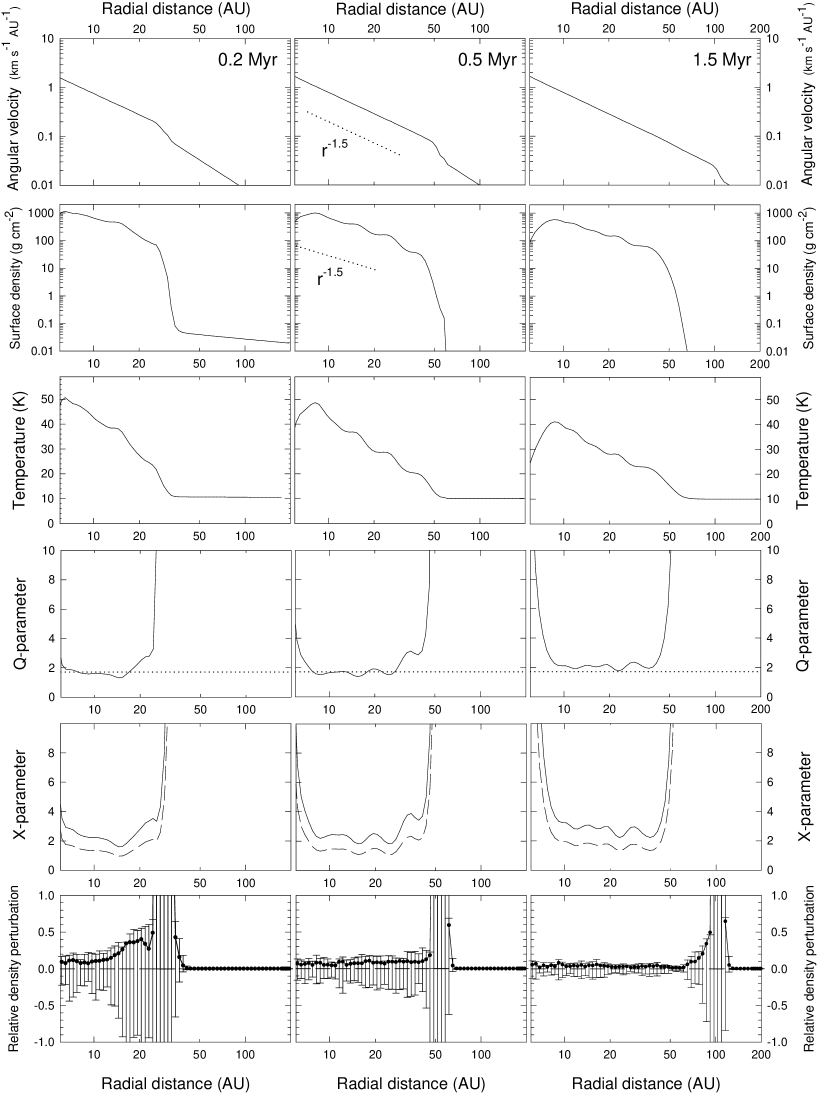
Insight into the phenomenon that drives accretion in the quiescent phase between the bursts and in the later residual accretion phase can be obtained from the radial structure of protostellar discs. Figure 2 shows the radial profiles of the azimuthally-averaged values of , , temperature , Toomre parameter , the -parameter (defined later), and the relative surface density perturbation at Myr (left column), Myr (middle column), and Myr (right column). The Toomre parameter is calculated as , where is the effective sound speed. In each computational zone () we calculate
| (7) |
where is the number of grid zones in the azimuthal direction.
Several important conclusions can be drawn by analysing Fig. 2, which we review from top to bottom. The first row shows that the protostellar disc is characterised by near-Keplerian rotation during its evolution, since the stellar mass always dominates the disc mass (see fig. 6 of Vorobyov & Basu, 2006). (This justifies our use of in the definition of , since the epicyclic frequency for Keplerian rotation.) Note the visible break in the profile which marks the edge of the centrifugal disc. The surface density profile (second row) is also proportional to in much of the disc, with the exceptions of near the inner and outer boundaries. This profile has a similar form as the minimum mass solar nebula, g cm-2 (Weidenschilling, 1977). The mild decrease in surface density near the disc’s inner boundary is caused by the inflow condition on the inner computational boundary. At the same time, the surface density at several tens of AU shows a sharp drop by many orders of magnitude, implying that the disc has a sharp physical boundary. This is an important new result of our self-consistent calculation of disc formation. We emphasise that the outer computational boundary is at 8000 AU and has virtually no influence on the protostellar disc dynamics or the formation of its sharp edge. The disc grows in radius from approximately AU at Myr to about AU at 3 Myr.
The third row shows that the disc, in contrast to the envelope, is decidedly nonisothermal. As with and , there is a sharp drop in temperature at the disc edge. The temperature generally increases inward as the surface density increases, in accordance with the barotropic equation of state. Nevertheless, the variation in temperature within the disc is much less than the variations in and , which follow power-law profiles. We note that the temperature distribution in our model disc during the late accretion phase is an approximate value since we have not included the complex roles of stellar irradiation and radiative transfer. The model of Chiang & Goldreich (1997), which accounts for heating from a central star onto a passive minimum mass solar nebula model, yields temperatures in the range 50-60 K for a disc at 10 AU, in comparison to our model temperature of 40 K at this radius at late times. More detailed models by Garaud & Lin (2007), who add viscous dissipation within the context of steady-state accretion in an -prescription (the resulting surface density is much shallower than ), yield even greater midplane temperatures in many cases, but generally agree with the Chiang & Goldreich (1997) model for an accretion rate 10-8 M☉ yr-1. An exact comparison of our calculated temperatures with either of these models is difficult due to their sensitive dependence on disc flaring, a quantity that we do not follow in this study, and due to the different surface density distribution of our model discs.
The radial distribution of the azimuthally-averaged Toomre parameter is shown in the fourth row of Fig. 2. A substantial portion of the disc at Myr and Myr is characterised by below a fiducial critical value of (estimated from the linear analysis of Polyachenko et al., 1997, and shown by the dotted line). However, at Myr becomes greater than and the relative amplitude of density perturbations in the disc is expected to diminish. In all cases, maintains near-uniformity in space due to a self-regulation mechanism in the disc that prevents it from falling substantially below the critical value. If falls below a critical value , the gas disc becomes vigorously unstable, develops a spiral structure, and may even fragment to form dense clumps within the arms. Accretion on to the central sink as well as heating induced by density enhancements work to restore back toward the critical value. Ultimately, the near surface density profile within the disc that is illustrated in the second row is a result of this self-regulation of the Toomre parameter coupled with the near-Keplerian angular velocity and relatively weak temperature variation. We note that our obtained distribution of the azimuthally averaged Toomre parameter is qualitatively similar to that obtained by Lodato & Rice (2004) using SPH simulations of isolated discs with a simple parametrisation for the cooling function.
Although cannot drop to arbitrarily low values, what prevents the disc from quickly achieving a high state in which density fluctuations are quickly washed out due to pressure gradients or shear? We believe that the answer is swing amplification. Numerical simulations indicate that the transition between stable and unstable phases is usually a smooth process rather than an instantaneous switch. There can exist a situation when the disc sustains low-amplitude density perturbations for a substantially long time even though the Toomre parameter averaged over the whole disc is above the critical value and the disc is stable globally. This phenomenon can take place if gravitational instability is powered by swing amplification. Amplification occurs when any leading spiral disturbance unwinds into a trailing one due to differential rotation (Goldreich & Lynden-Bell, 1965; Toomre, 1981, and others). The importance of swing amplification is in its essentially local nature – it provides transitory gravitational amplification to a local patch of gas where a leading spiral disturbance unwinds into a trailing one and the stabilising influence of shear is temporarily cancelled (Binney & Tremaine, 1987, p. 378). It is important to realise that swing amplification can work when the disc is stable globally but unstable locally. In this case, spiral density perturbations would be amplified locally (if local conditions favour gravitational instability) but the gain would be too small for gravitational instability to grow globally throughout the disc. In order for this process to work for a long time, a feedback mechanism must be present that constantly feeds a gas disc with leading spiral disturbances (Binney & Tremaine, 1987, p. 379). In this case, a reflection of trailing spiral disturbances from the sharp outer disc edge can provide the necessary feedback mechanism.
It is convenient to introduce the -parameter when considering the effect of swing amplification. It is defined as , where is the circumferential wavelength of an -armed spiral disturbance, is the longest unstable wavelength in a cold disc, and is the epicyclic frequency. According to Goldreich & Lynden-Bell (1965), the gain from the swing amplifier in a gaseous disc is greatest when . Generally speaking, swing amplification is most efficient when . For and , the swing amplifier is strongly moderated by local shear and gas pressure, respectively. Figure 2 (fifth row) shows the radial distribution of the azimuthally-averaged -parameter in the disc for the spiral mode (solid line) and spiral mode (dashed line). It is evident that the favourable conditions for swing amplification are present in the inner few tens of AU and the maximum gain of the swing amplifier is expected for higher order modes . Consequently, the disc is expected to develop a flocculent multi-armed spiral structure, which is indeed seen in fig. 4 of Vorobyov & Basu (2006).
The presence of swing-amplified density perturbations is illustrated in Fig. 2 (bottom row). The filled circles show the azimuthally-averaged relative density perturbations at different disc radii. Note that we azimuthally average the absolute values of in order to avoid a partial cancellation of positive and negative relative density perturbations along the azimuth. The error bars indicate the maximum positive and negative relative density perturbations at a specific radius. A substantial portion of the disc at Myr is characterised by . A steady increase of with radius is evident, suggesting that density perturbations are powered by the swing-amplified spiral disturbances reflected off the disc outer edge. The magnitude of relative density perturbations decreases with time, which agrees with a gradual stabilisation of the disc inferred from the temporal evolution of . For instance, throughout most of the disc at Myr, though local relative density perturbations can fall within the range . At Myr, everywhere except just at the outer disc edge. We note that the actual densities are very low there and large relative density perturbations have little influence on the disc dynamics.
To summarise, the nonaxisymmetry diminishes with time and is less pronounced in yr-old discs than in yr-old discs. Interestingly, nonaxisymmetric structure is observed in the several Myr old discs around HD 100546 and AB Aurigae (Grady et al., 2001; Fukagawa et al., 2004).
5 A closer look at gravitational torques
5.1 Self-regulated gravitational accretion
Even the slightest deviation from axial symmetry in a protostellar disc produces gravitational torques. The strength of the gravitational torques contributes to the rate of angular momentum redistribution (Larson, 1984), and by implication, the mass accretion rate. In this section, we consider the effect of gravitational torques on the radial redistribution of mass and angular momentum within protostellar discs.
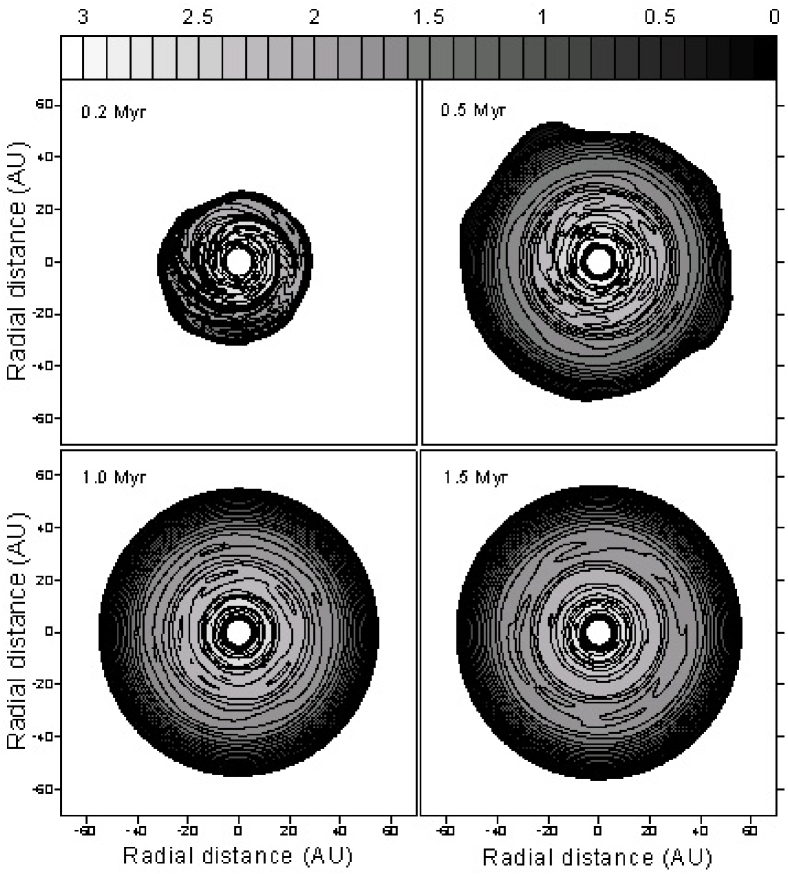
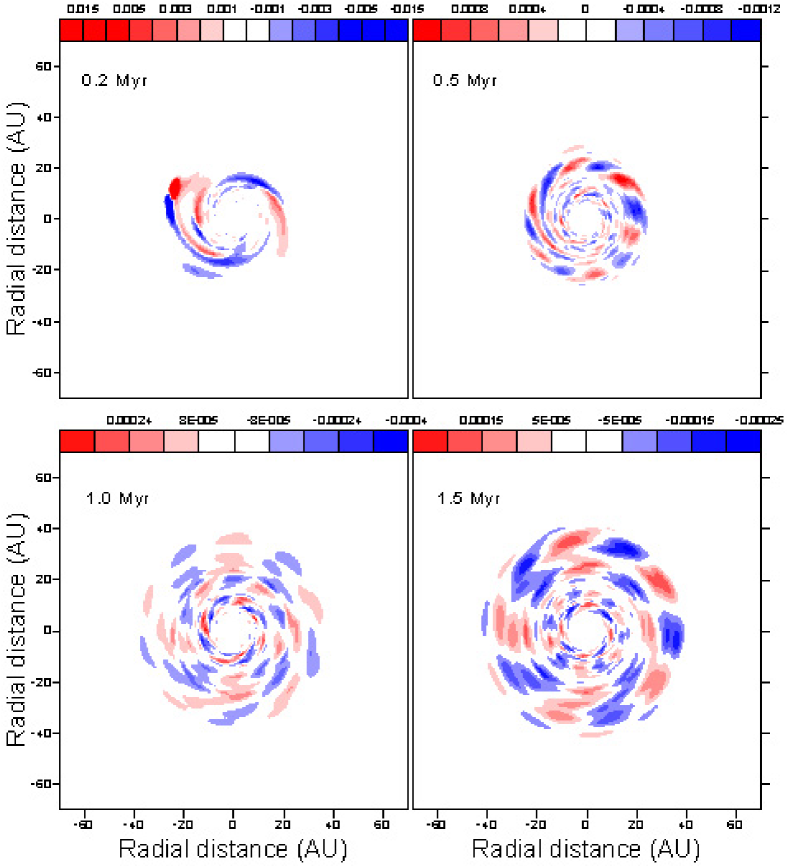
Figure 3 illustrates the gas surface density of the protostellar disc at four evolutionary times (see also fig. 4 in Vorobyov & Basu, 2006). It is evident that multiple spiral arms are present at Myr but that they disappear by about Myr. During the subsequent evolution, only low-amplitude nonaxisymmetric density inhomogeneities are present in the disc. It is well known that negative torques drive matter inward and angular momentum outward, and that positive torques act in the opposite manner (e.g. Laughlin & Bodenheimer, 1994; Tomley et al., 1991; Vorobyov & Theis, 2006, and others). A spatial distribution of gravitational torques in the protostellar disc is shown in Fig. 4, in which the positive and negative gravitational torques are plotted at four evolutionary times in shades of red and blue, respectively (see also fig. 5 in Vorobyov & Basu, 2006). The regions with near-zero are shown with white space. Trailing spiral arms can be clearly seen in the distribution of gravitational torques at Myr. In particular, the inner part of a spiral arm is usually characterised by negative , whereas the end of a spiral is characterised by positive .
The spatial distribution of gravitational torques in the later evolution ( Myr) is particularly interesting. It shows an alternating behaviour in the azimuthal direction – local gas patches characterised by positive are followed by patches with negative and vice versa. We note that this pattern fluctuates with time. Even though the net global effect of negative and positive torques appears (by eye) to cancel out, it is clear that the net inward mass accretion exhibited by our model requires a residual negative gravitational torque (due to the density inhomogeneities), at least within the inner disc.
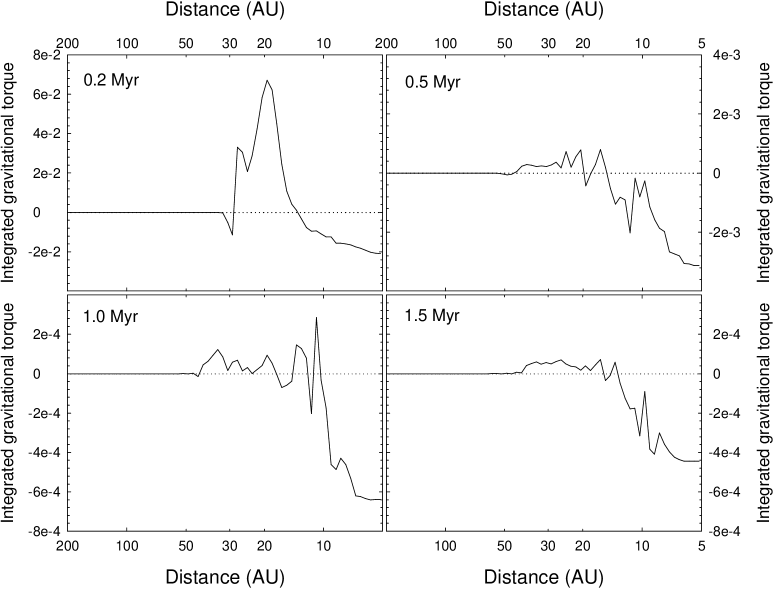
To further investigate the net effect of local positive and negative gravitational torques when averaged over a significant portion of the disc, we calculate the cumulative gravitational torque in a radial bin between 200 AU and . For instance, would represent the sum of all local gravitational torques starting from 200 AU and ending at AU. The gravitational torques are expected to be small at large radial distances due to both the low gas surface density and effective axial symmetry in the envelope. Figure 5 shows the resulting integrated gravitational torque as a function of radial distance at four evolutionary times. Clearly, it is virtually zero at large radial distances. Moving radially inward, the integrated gravitational torque first becomes positive and then becomes negative. This implies that the outer parts of the protostellar disc are dominated by positive gravitational torques, whereas the inner regions of the disc are dominated by negative gravitational torques. This important feature contributes to the overall mass and angular momentum redistribution within the disc.
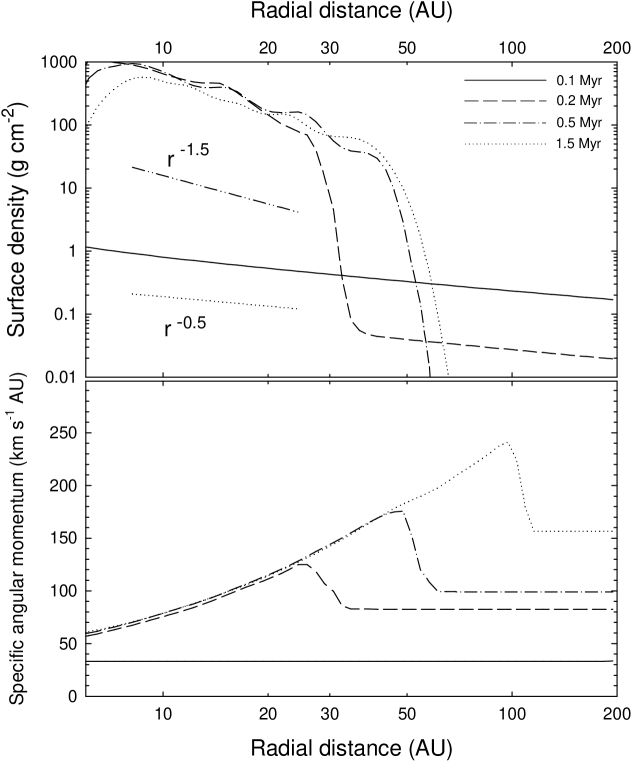
The global effect of gravitational torques is illustrated in Fig. 6, where we show the radial profiles of the gas surface density (top) and specific angular momentum (bottom) at four evolutionary times. Before disc formation at Myr, the infalling envelope has a shallow radial surface density profile, essentially , and the specific angular momentum is nearly uniform in the inner 200 AU. Profiles of the form and ( const.) are the expected self-similar profiles for the freely-falling regions inside an expansion wave but outside the centrifugal disc (Saigo & Hanawa, 1998). After disc formation, the radial density within the disc develops a much steeper profile, , indicating an inward transport of mass. On the other hand, the specific angular momentum in the disc is obviously transported outward, which is indicated by a developed positive slope in the radial distribution of . Outside the disc, the specific angular momentum remains nearly spatially uniform though growing with time.
5.2 Diffusive nature of the accretion process
A diffusive nature of the radial mass transport in the late evolution of the disc can be visualised by considering the temporal evolution of a radially narrow gas annulus located initially at some distance from the inner disc boundary. Any mechanism of radial mass and angular momentum transport will change the radial position and shape of the annulus during the subsequent evolution.
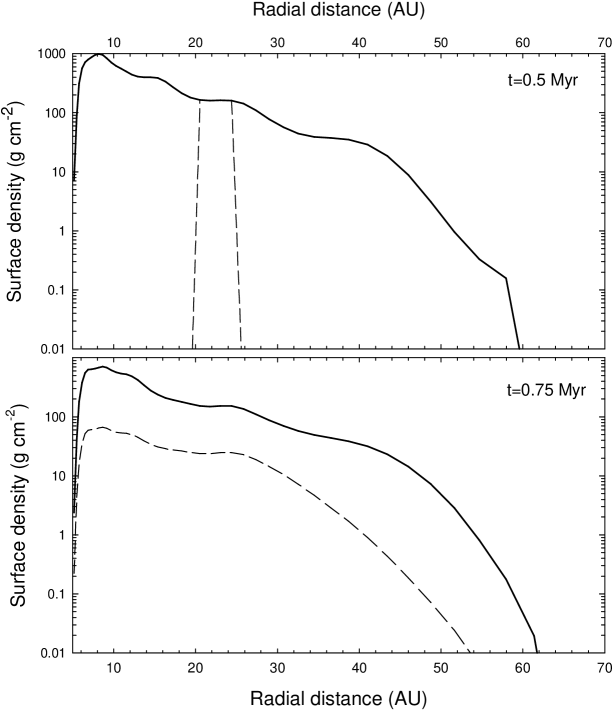
To perform this test, we follow the evolution of a radial gas annulus initially located between 20 AU and 25 AU. We solve a separate continuity equation for the annulus starting at Myr, when the protostellar disc has reached a radial size of approximately 50 AU. The initial gas surface density of the annulus is shown in the upper panel of Fig. 7 with the dashed line. It equals the corresponding gas surface density in the disc and is set to a negligibly small value elsewhere. The resulting gas surface density distribution of the annulus at Myr is shown in the bottom panel of Fig. 7 with the dashed lines. For comparison, the solid line shows the gas surface density in the disc at the same evolutionary time. Clearly, the annulus spreads out rather than moves homologously in the radial direction. This behaviour is in agreement with a diffusive nature of the radial mass transport in a protostellar disc. Because the net gravitational torque is negative, the annulus spreads out predominantly inward, resulting in a radially declining surface density profile at Myr. To quantify this effect, we find the percentile of the initial mass of the annulus () that was transported inwards and outwards of its initial location between 20 AU and 25 AU. At Myr, the mass inside 20 AU is or 50 per cent of the initial annulus mass and the mass outside 25 AU is or 30 per cent of the initial annulus mass. These percentiles show an even greater contrast during the subsequent evolution at Myr. Another intriguing result is that the shape of the gas surface density profile in the spread-out annulus (dashed line) closely resembles that of the disc (solid line) after Myr.
6 Summary and Discussion
Our model of the self-consistent formation of a protostellar disc from the collapse of its parent cloud core and the subsequent long-term evolution of the disc reveals that it settles into a self-regulated state. In this state, the gravitational torques are responsible for inward mass transport at a rate that is in agreement with typical accretion rates inferred in T Tauri star discs (Hartmann, 1998). Persistent nonaxisymmetric density perturbations are the key ingredient that leads to the gravitational torques. The amplitude of these nonaxisymmetric density perturbations decreases with time but the decline is moderated by the action of swing amplification, aided by the presence of a self-consistently-formed sharp edge at the interface between the protostellar disc and core envelope. The disc self-regulation by gravitational torques maintains a near-uniform value of the azimuthally-averaged Toomre parameter. The mass accretion also maintains the disc-to-star mass ratio to be , and the rotation rate within the disc is approximately Keplerian. Since the temperature variation in the disc is much smaller in magnitude than the power-law variation in , the self-regulated state with near-uniform implies that the surface density .
The near uniformity of may be understood using an analogy to convection in stellar envelopes. A highly superadiabatic temperature gradient cannot be maintained in a stellar envelope, since convection will set in and bring the temperature gradient back to a near-adiabatic value. Similarly, gravitational torques work to maintain at essentially the stability limit. However, it must be emphasised that our model discs are not turbulent. There are density perturbations in the disc, but they are not fed in globally from the largest scales of the disc and are indeed declining in amplitude over time. The swing amplification mechanism does sustain the structure for a substantially long time, but is driven by transient local gravitational instabilities. We do not believe that the labels “turbulent” or even “gravitoturbulent” are justified: rather we refer to this mode as “self-regulated gravitational accretion”.
The profile is in agreement with estimates of the minimum mass solar nebula (Weidenschilling, 1977), made by adding the solar abundance of light elements to each planet and spreading the masses through zones surrounding the planetary orbits. The disc-to-star mass ratio in our model remains greater than that inferred for the solar nebula or for typical external star-disc systems. However, Hartmann et al. (2006) have recently pointed out that disc masses based on dust emission may be systematically underestimated. In any case, other transport mechanisms, primarily associated with magnetic fields, may indeed operate in real discs, and may also be more important in the inner 5 AU that we do not model. Since the level of magnetic coupling in the disc also remains uncertain, our model provides a very clear physical baseline for the global behaviour of discs before accounting for other more poorly-understood effects.
Acknowledgments
We thank the referee and Wolfgang Dapp for helpful comments on the manuscript, and Martin Houde and the SHARCNET consortium for access to computational facilities. This work was supported by the Natural Sciences and Engineering Research Council of Canada, RFBR grant 06-02-16819-a, South Federal University grant 05/6-30, and Federal Agency of Education (project code RNP 2.1.1.3483). EIV gratefully acknowledges support from a CITA National Fellowship
References
- Andrews & Williams (2005) Andrews, S. M., Williams, J. P., 2005, ApJ, 631, 1134
- Balbus & Hawley (1998) Balbus, S. A., Hawley, J. F., 1998, Rev. Mod. Phys., 70, 1
- Basu (1997) Basu, S., 1997, ApJ, 485, 240
- Binney & Tremaine (1987) Binney, J., & Tremaine, S., 1987, Galactic Dynamics. Princeton Univ. Press, Princeton
- Chiang & Goldreich (1997) Chiang, E. I., Goldreich, P., 1997, ApJ, 490, 368
- Fukagawa et al. (2004) Fukagawa, M., Hayashi, M., Tamura, M., Itoh, Y. et al., 2004, ApJ, 605, L53
- Gammie (1996) Gammie, C. F., 1996, ApJ, 457, 355
- Garaud & Lin (2007) Garaud, P., Lin, D. N. C., 2007, ApJ, 654, 606
- Glassgold et al. (1997) Glassgold, A. E., Najita, J., Igea, J., 1997, ApJ, 480, 344
- Goldreich & Lynden-Bell (1965) Goldreich, P., Lynden-Bell, D., 1965, MNRAS, 130, 125
- Goodman et al. (1993) Goodman, A. A., Benson, P. J., Fuller, G. A., Myers, P. C., 1993, ApJ, 406, 528
- Grady et al. (2001) Grady, C. A., Polomski, E. F., Henning, Th., Stecklum, B., et al., 2001, AJ, 122, 3396
- Hartmann (1998) Hartmann, L., 1998, Accretion Processes in Star Formation. Cambridge Univ. Press, Cambridge
- Hartmann et al. (2006) Hartmann, L., D’Alessio, P., Calvet, N., Muzerolle, J., 2006, ApJ, 648, 484
- Larson (1984) Larson, R. B., 1984, MNRAS, 206, 197
- Laughlin & Bodenheimer (1994) Laughlin, G., Bodenheimer, P., 1994, ApJ, 436, 335
- Lodato & Rice (2004) Lodato, G., Rice, W. K. M., 2004, MNRAS, 351, 630
- Lodato & Rice (2005) ., 2005, MNRAS, 358, 1489
- Lodato et al. (2007) Lodato G., Meru F., Clarke C. J., Rice W. K. M., 2007, MNRAS, 374, 590
- Pickett et al. (2000) Pickett, B. K., Cassen, P., Durisen, R. H., Link, R., 2000, ApJ, 529, 1034
- Polyachenko et al. (1997) Polyachenko V. L., Polyachenko E. V., Strel’nikov A. V., 1997, Astron. Zhurnal, 23, 598 (translated Astron. Lett. 23, 525)
- Saigo & Hanawa (1998) Saigo, K., Hanawa, T., 1998, ApJ, 493, 342
- Scholz et al. (2006) Scholz, A., Jayawardhana, R., Wood, K., 2006, ApJ, 645, 1498
- Stone & Norman (1992) Stone, J. M., Norman, M. L., 1992, ApJS, 80, 753
- Tomley et al. (1991) Tomley, L., Cassen, P., Steiman-Cameron, T., 1991, ApJ, 382, 530
- Toomre (1981) Toomre, A., 1981, in Fall S. M., Lynden-Bell D., eds, The Structure and Evolution of Normal Galaxies. Cambridge Univ. Press, Cambridge
- Turner et al. (2007) Turner, N. J., Sano, T., Dziourkevitch, N., 2007, ApJ, 659, 729
- Vorobyov & Basu (2005a) Vorobyov, E. I., Basu, S., 2005a, MNRAS, 360, 675
- Vorobyov & Basu (2005b) ., 2005b, ApJ, 633, L137
- Vorobyov & Basu (2006) ., 2006, ApJ, 650, 956
- Vorobyov & Theis (2006) Vorobyov, E. I., Theis, Ch., 2006, MNRAS, 373, 197
- Weidenschilling (1977) Weidenschilling, S. J., 1977, ApSS, 51, 153
Appendix A The Relative Role of Artificial Viscosity
A.1 Comparison with gravitational torques
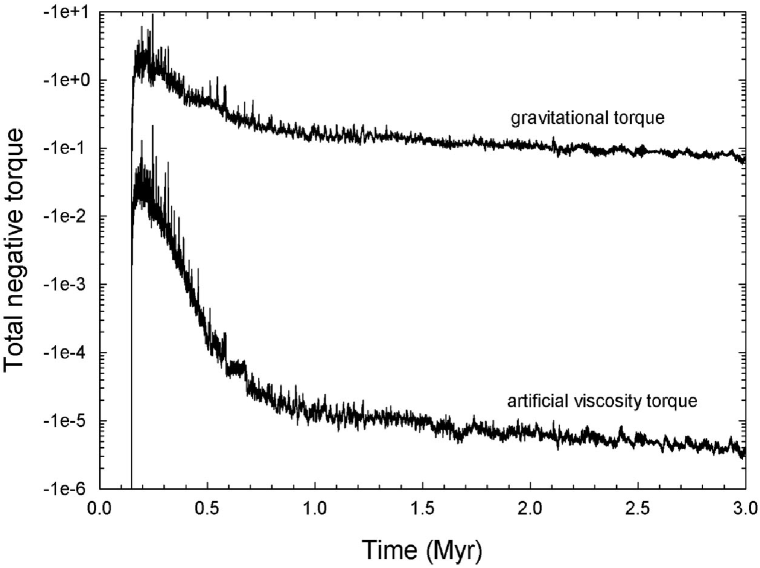
In principle, the torques due to artificial viscosity (present in our Eulerian numerical hydrodynamics code) could also contribute to the radial transport of mass and angular momentum. To quantify this effect, we calculate the net artificial viscosity torque in the disc , defined as the sum of local artificial viscosity torques in the inner 600 AU. Here, is the surface area occupied by a cell with polar coordinates and is the artificial viscosity pressure defined according to the usual von Neumann & Richtmyer prescription (see e.g. Stone & Norman, 1992). The net gravitational torque is found by summing all local gravitational torques in the inner 600 AU. We find that is at least ten orders of magnitude smaller than and fluctuates near zero during the evolution, meaning that the positive and negative artificial viscosity torques essentially cancel each other globally. Furthermore, we must make sure that even the negative part of the artificial viscosity torque cannot compete with the corresponding negative gravitational torque and lead to spurious radial mass transport. Hence, we also calculate the total negative torques due to gravity and artificial viscosity by summing only negative values of and in the inner 600 AU, respectively. Figure 8 shows these total negative torques at different evolutionary times. The negative torque due to gravity is clearly many orders of magnitude greater than the negative torque due to artificial viscosity, especially in the late disc evolution when the spiral arms have disappeared. These tests enable us to conclude that artificial viscosity has little influence on the radial transport of mass in our numerical simulations.
A.2 Accretion without gravity
A decisive test to confirm the principal role of gravitational torques is to see if a non-self-gravitating disc can drive accretion rates comparable to those in the self-gravitating disc. To do this, we turn off self-gravity at Myr, i.e. just before disc formation but well after the central protostar has formed. Figure 9 shows the previously calculated with self-gravity (black line) as well as the newly computed in the absence of self-gravity (red line). The two rates are identical before the disc forms at Myr. Afterwards, in the non-self-gravitating disc declines quickly to a remarkably low value yr-1 during 0.1 Myr, confirming the principal role of self-gravity and gravitational torques in driving the mass accretion in our model. We also note that it is not possible to follow the simulations further in time, since the gas density near the inner boundary becomes negative. This is because the accretion is then driven by small numerical imperfections of the inner inflow computational boundary. As a result, the computational cells that are immediately adjacent to the inner boundary can become depleted of gas due to the absence of gravitationally driven inward transport of gas from the outer disc.