Statistical Investigation of Connected Structures of Stock Networks in Financial Time Series
Abstract
In this study, we have investigated factors of determination which can affect the connected structure of a stock network. The representative index for topological properties of a stock network is the number of links with other stocks. We used the multi-factor model, extensively acknowledged in financial literature. In the multi-factor model, common factors act as independent variables while returns of individual stocks act as dependent variables. We calculated the coefficient of determination, which represents the measurement value of the degree in which dependent variables are explained by independent variables. Therefore, we investigated the relationship between the number of links in the stock network and the coefficient of determination in the multi-factor model. We used individual stocks traded on the market indices of Korea, Japan, Canada, Italy and the UK. The results are as follows. We found that the mean coefficient of determination of stocks with a large number of links have higher values than those with a small number of links with other stocks. These results suggest that common factors are significantly deterministic factors to be taken into account when making a stock network. Furthermore, stocks with a large number of links to other stocks can be more affected by common factors.
pacs:
89.65.Gh, 89.75.Fb, 89.75.HcI Introduction
Stock markets are known to form a pricing mechanism by interactions of stocks having a variety of characters. The academic world recognizes that one of its major research tasks is to observe the dynamics of such interactions between stocks. Recently, stock networks have been throughly analyzed in the field of econophysics to understand the interactions between stocks. Mantegna visually presented the complicated relationships between stocks in a topological space using the minimal spanning tree (MST) method. He achieved this by taking advantage of the degree of correlations between stocks, which is called a stock network [1]. Thereafter, many studies have verified diverse properties of stock networks derived from the MST method by using time series data of financial markets of various countries [2-7]. In the meantime, there have also been studies which have observed stock networks derived from the same test process using returns generated directly from theoretical pricing models [8-10]. These studies were under taken in order to observe the formation principles and factors of determination for the connected structures of stock networks.
Based on statistics, we examined factors of determination which can affect the link structures of stock networks. A major index which represents a link structure of a stock network is the number of links which a specific stock has with other stocks. That is, most stocks have a small number of links with other stocks but a few stocks have a very large number of links with other stocks. Exploring the factors of determination that can influence the number of links of these stocks will help us to understand the formation principles and factors of determination for the connected structures of stock networks. Of the factors of determination available, we use common factors which are widely recognized in the field of finance. Common factors refer to factors that can commonly influence stocks and major common factors mentioned in the finance sector. These include market factors, industrial factors, macroeconomic factors and corporate factors [11-13]. Examples of major pricing models reflecting such common factors are the one-factor model [14], three-factor model [15] and multi-factor model [16]. We use the multi-factor model, which is generated by a statistical approach, to verify the connected structures of stock networks. According to the results of our observation, stocks which have a large number of links to other stocks in stock networks are more likely to be explained by common factors than those which have a small number of links. This indicates the fact that common factors are the factors of determination that can have a significant influence on the link structures of stock networks.
In the next section, we describe the data and methods of the test procedures used in this paper. In section III, we present the results obtained according to our established research aims. Finally, we summarize the findings and conclusions of the study.
II DATA and METHODS
II.1 Data
We used the individual stocks traded on the stock market indices of Korea, Japan, Canada, Italy, and the UK. That is, we used the daily prices of 127 stocks in the KOSPI 200 market index of the Korean stock market, 202 stocks in the Nikkei 225 of Japan, 118 stocks in the TSX of Canada, 111 stocks in the Milan Comit General of Italy, and 69 stocks in the FTSE 100 of the UK. The individual stocks that had daily prices for the last 15 years, from January 1992 to December 2006, were selected from each country. The returns, , are calculated by the logarithmic change of the price, , where is the stock price at day.
II.2 Minimal Spanning Tree Method
The stock network visually displays the significant links among all possible links, . This is based on the correlation matrix between stocks, using the MST method. The MST, a theoretical concept in graph theory [17], is also known as the single linkage method of cluster analysis in multivariate statistics [18-19]. We created the stock networks using the correlation matrix calculated from the return, . The correlation matrix, , is defined by
| (1a) |
where the notation means an average over time. In order to create the stock network, the metric distance, , relates the distance between two stocks to their correlation coefficient [20], and is defined as
| (1b) |
The MST is the spanning tree of the shortest length using the Kruskal or Prim algorithm [21-22]. In our study, we used the Kruskal algorithm. The Kruskal algorithm is a graph without a cycle connecting all nodes with links. The correlation coefficient can vary between while the distance can vary between . Here, small values of the distance imply strong correlations between stocks.
In this paper, using the individual stocks traded on the stock market index of each country, we created a stock network by utilizing the MST method. The largest number of links with other stocks in the stock networks of each country is 14 for Korea, 15 for Japan, 12 for Canada, 16 for Italy and 10 for the UK. In addition, we needed to assure standardization by the maximum and minimum links because the degree distribution of stock networks for each country is different. According to the results, we found that the degree distribution of stock networks follows a power-law with the exponent . In other words, most stocks have a small number of links to other stocks, while a few stocks have a large number of links to other stocks.
II.3 Multi-factor Model
In this paragraph, we look into the test process of the multi-factor model, a theoretical concept of the arbitrage pricing model [23]. The independent variables used in the multi-factor model are common factors that are estimated through factor analysis in multivariate statistics [24]. Factor analysis widely used in the field of social science can reduce the many variables in the given data set to a few factors. Using factor analysis, we chose significant factors which are regarded as having economic significance. Accordingly, we regard significant factors as common factors. We also created the new time series having the attributes of significant factors, called factor scores in statistics. That is, the factor scores are time series data of common factors. Furthermore, the factor scores are used as independent variables in the multi-factor model. In the multi-factor model, the stock returns, , can be explained by the common factors, . They are defined by
| (2) |
where is an expected return on the stock, are a stock’s sensitivity to changes in common factors, and is the residuals [, , and ]. To establish the multi-factor model as in Eq. 2, we have to determine the number of common factors, , and control the problem of multicolinearity between common factors [25]. First, in order to determine the number of significant factors, we used the Kaiser rule [26]. That is, measured eigenvalues determine the factors corresponding to the number having a value of ”1” or higher as the number of significant factors. Second, results exhibiting the problem of multicolinearity might be distorted according to the higher correlation between the independent variables. Therefore, in order to minimize the correlation between common factors, we created a new time series according to factor analysis controlled by the rotated varimax method.
In this paper, the number of common factors chosen by the Kaiser rule is 10 for Korea, 20 for Japan, 7 for Canada, 7 for Italy, and 8 for the UK. The correlation between the common factors have much lower values and the mean value of the correlations is for Korea, for Japan, for Canada, for Italy, and for the UK. That is, there are no problems concerning multicolinearity that may occur in multi-factor models.
III Results
In this section, we present the observed results. The representative index for topological properties of a stock network is the number of links with other stocks. In the multi-factor model, we can evaluate whether common factors such as independent variables are the important deterministic factors according to whether the independent variables can explain a dependent variable. That is, the major index is the coefficient of determination, . The coefficient of determination has a higher value if the independent variables sufficiently explain a dependent variable. Therefore, we investigated the relationship between the number of links in the stock network and the coefficient of determination in the multi-factor model.
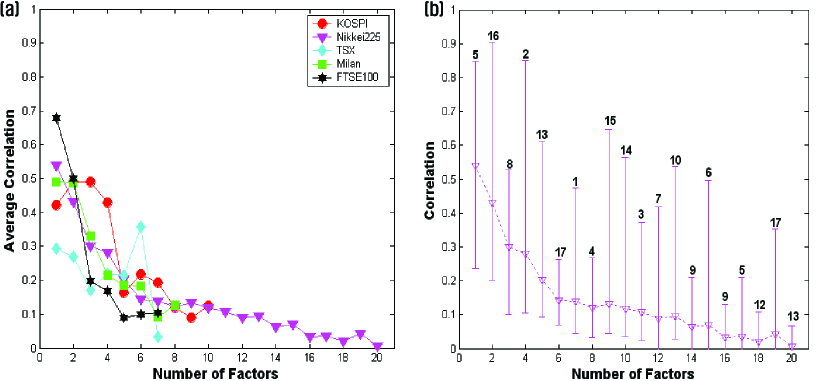
First of all, we examined the economic significance of common factors used as independent variables in the multi-factor model. Common factors mentioned in the field of finance include market effects, industrial effects and macroeconomic effects. We calculated measurement values that can show the properties of industrial effects, . This represents the average value of which is the returns of individual stocks belonging to a specific industry, , that was defined as an industrial average index having an industrial property. That is, this corresponds to methods that calculate the equal-weighted indices which are widely used in the field of finance. To calculate a measurement value having industrial effects properties, however, we excluded the industries that have four or less individual stocks. The number of industrial average indexes obtained through this calculation process was 10 for Korea, 17 for Japan, 7 for Canada, 8 for Italy, and 2 for the UK. The results are shown in Fig. 1.
Figure 1 indicates the correlations between common factors and industrial average indexes. In Fig. 1(a), axis x represents the number of common factors. The highest number of common factors is 20 for Japan; therefore, axis x had a maximum value of 20. Correlations between the common factors and the industrial average indexes are calculated and the average values of those correlations are indicated on axis y. For Japan, for example, the number of common factors is 20 and the number of industrial average indexes is 17. The average correlations between the first common factor and the 17 industrial average indexes are indicated. Similarly, the average correlation coefficients from the second common factor to the last common factor are repeatedly indicated. In Figure 1, Korea is indicated by red circles, Japan by magenta triangles, Canada by cyan diamonds, Italy by green boxes, and the UK by black pentagrams. For Fig. 1(a), the maximum, average and minimum value of the correlation matrix calculated for Japan are indicated by an error-bar graph in Fig. 1(b). The number of industrial average indexes used is 17. The numbers indicated on the top of the graph in the figure represent the numbers of the industrial average indexes which have the maximum value of correlations for each common factor.
According to the results, the correlations between common factors and industrial average indexes are high on average within the range of common factors 1-3, regardless of the data used. However, the degree of correlations rapidly declines thereafter in Fig. 1(a). In addition, each common factor has a high correlation with a specific industrial average index in Fig. 1(b). That is, most of the 20 common factors selected from the Japanese stock market have the highest correlation with different industrial average indexes among the 17 industrial average indexes. These results indicate that, although time series data derived from statistics were used as independent variables of the multi-factor model, these data have the same economic significance as the common factors mentioned in the field of finance.
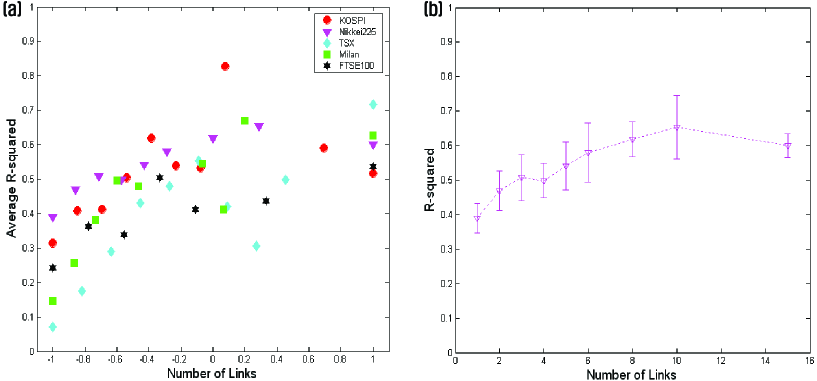
Next, we investigated the relationship between common factors and link structures of stock networks. In the multi-factor model, common factors are independent variables while returns of individual stocks are dependent variables. We calculated the coefficient of determination, , which represents the measurement value of the degree in which dependent variables are explained by independent variables. Then, we investigated the number of links, , , that each stock has with other stocks in a stock network by utilizing the MST method. Then, we calculated an average coefficient of determination of individual stocks, , which are included in each number of links. The results are shown in Fig. 2.
Figure 2 indicates the relationship between the number of links in a stock network and the average coefficient of determination in the multi-factor model. In Fig. 2(a), x-axis indicates the number of links. The largest number of links to other stocks in the stock networks of each country is 14 for Korea, 15 for Japan, 12 for Canada, 16 for Italy and 10 for the UK. In addition, we needed to assure standardization by the maximum and minimum links, because the degree distribution of stock networks for each country is different. The normalized value lies within . Axis y represents the average coefficient of determination of individual stocks belonging to each number of links. In Fig. 2, Korea is indicated by red circles, Japan by magenta triangles, Canada by cyan diamonds, Italy by green boxes and the UK by black pentagrams. Meanwhile, regarding the results of Fig. 2(a), Fig. 2(b) indicates an error-bar graph of the maximum, average and minimum value of the coefficients of determination for each number of links for Japan. The maximum number of links in a stock network is 15 for Japan.
The results indicate that stocks having more links to other stocks in a stock network have higher average coefficients of determination. That is, when the common factors were used as independent variables of the multi-factor model, stocks with more links to other stocks show higher coefficients of determination that measure the degree of explanation of changes in returns of individual stocks. Compared with stocks with less links to other stocks in a stock network, stocks with more links are more likely to be explained by common factors. The results suggest that common factors are the factors of determination that can have a significant influence on the formation process of connected structures of stock networks.
IV Conclusions
We investigated factors of determination that can affect link structures of stock networks in viewpoint of statistics. The number of links which a specific stock has with other stocks was used as a major index that represents the connected structure of a stock network. Of possible factors of determination, common factors widely recognized in the field of finance were used. Thus, exploring the factors of determination that can influence the number of links of a stock is expected to be of great help in understanding formation principles and factors of determination for link structures of stock networks. For a pricing model reflecting common factors, we verified link structures of stock networks by using a multi-factor model generated by a statistical approach.
Our study produced the following conclusions. First, we confirmed the economic significance of common factors which were used as independent variables in the multi-factor model. We found that common factors extracted by a statistical base have industrial effects properties mentioned in the field of finance. That is, common factors have an economic significance. Second, we verified the relationship between common factors and the number of links which represents the link structure properties of a stock network. We discovered that stocks having more links to other stocks in a stock network are more likely to be explained by common factors than those with fewer links. Through these results, we have demonstrated that the common factors mentioned in the field of finance are factors of determination that can have a significant influence on the formation process of link structures of stock networks.
References
- (1) R.N.Mantegna, Eur. Phys. J. B 11 (1999) 193.
- (2) G.Bonanno, N.Vandewalle, and R.N.Mantegna, Phys. Rev. E 62(6) (2000) 7615.
- (3) G.Bonanno, F.Lillo, and R.N.Mantegna, Quant. Finance 1 (2001) 96.
- (4) G.Bonanno, G.Caldarelli, F.Lillo, S.Micciche, N.Vandewalle, and R.N.Mantegna, Eur. Phys. J. B 38 (2004) 363.
- (5) R.Coelho, S.Hutzler, P.Repetowicz, and P.Richmond, Physica A, 373(1) (2007) 615.
- (6) J.P.Onnela, A.Chakraborti, K.Kaski, J.Kertesz, and A.Kanto, Phys. Rev. E 68(5) (2003) 056110.
- (7) J.P.Onnela, A.Chakraborti, K.Kaski, and J.Kertesz, Physica A 324 (2003) 247.
- (8) G.Bonanno, G.Caldarelli, F.Lillo and R.N.Mantegna, Phys. Rev. E 68 (2003) 046130.
- (9) Cheoljun Eom, Gabjin Oh, and Seunghwan Kim, Physica A 383 (2007) 139.
- (10) Cheoljun Eom, Gabjin Oh, and Seunghwan Kim, Preprint available at arxiv.org, physics/0612068, 2006.
- (11) B.F.King, J. Business 39(1) (1996) 139.
- (12) J.L.Farrell, Jr., J. Business 47(2) (1974) 186.
- (13) N.Chen, R.Roll, and S.A.Ross, J. Business 59 (1986) 383.
- (14) F.Black, M.Jensen, and M.Scholes, Working Paper (from SSRN), 1972.
- (15) E.F.Fama, and K.R.French, J. Financial Econ. 33 (1993) 3.
- (16) S.A.Ross, J. Econ. Theory 13 (1976) 343.
- (17) D.B.West, Introduction to Graph Theory, Prentice-Hall, Englewood Cliffs NJ. 1996.
- (18) Gower,J.C., and G.J.S.Ross, Appl. Stat. 18(1) (1969) 54.
- (19) B.S.Everitt, Cluster Analysis, Heinemann Educational Books, London, 1974.
- (20) J.C.Gower, Biometrika 53 (1966) 325.
- (21) J.B.Kruskal, Proc. Am. Math. Soc. 7 (1956) 48.
- (22) R.C.Prim, Bell System Techn. J. 36 (1957) 1389.
- (23) S. A. Ross, J. Econ. Theory 13 (1976) 343.
- (24) H.H.Harman, Modern Factor Analysis, The University of Chicago Press, Chicago, 1976.
- (25) D.N.Gujarati, Basic Economatrics, McGraw-Hill International Editions, New York, 1998.
- (26) H.F.Kaiser, Psychometrika 23 (1958) 187.