Mid-Infrared Spectroscopy of 70 Selected Distant Luminous Infrared Galaxies
Abstract
We present mid-infrared spectroscopy obtained with the Spitzer Space Telescope of a sample of 11 optically faint, infrared luminous galaxies selected from a Spitzer MIPS 70 imaging survey of the NDWFS Boötes field. These are the first IRS spectra presented of distant 70-selected sources. All the galaxies lie at redshifts and have very large infrared luminosities of L. Seven of the galaxies exhibit strong emission features attributed to polycyclic aromatic hydrocarbons (PAHs). The average IRS spectrum of these sources is characteristic of classical starburst galaxies, but with much larger infrared luminosities. The PAH luminosities of Lν(7.7m) imply star formation rates of M⊙ yr-1. Four of the galaxies show deep 9.7m silicate absorption features and no significant PAH emission features (6.2 equivalent widths 0.03). The large infrared luminosities and low fν(70m)/fν(24m) flux density ratios suggests that these sources have AGN as the dominant origin of their large mid-infrared luminosities, although deeply embedded but luminous starbursts cannot be ruled out. If the absorbed sources are AGN-dominated, a significant fraction of all far-infrared bright, optically faint sources may be dominated by AGN.
Subject headings:
galaxies: active — galaxies: starburst — infrared: galaxies — quasars: general1. Introduction
Luminous and ultra-luminous infrared galaxies (LIRGs: L(8-1000) 1011 L⊙; Sanders et al. 1988) have been studied extensively in the local Universe with the Infrared Astronomical Telescope (IRAS; Soifer et al. 1987; Saunders et al. 1990), the Infrared Space Observatory (ISO; e.g., Lutz et al. 1998; Genzel & Cesarsky 2000; Tran et al. 2001), and more recently, with the Infrared Spectrograph (IRS; Houck et al. 2004) on (Weedman et al. 2005; Brandl et al. 2006; Armus et al. 2007; Desai et al. 2007). These galaxies exhibit a large range of properties in the mid-IR, some showing strong PAH emission features characteristic of powerful (up to 1000 M⊙ yr-1) star formation rates (e.g., Brandl et al. 2006; Smith et al. 2007), and all exhibiting a large range in 9.7 silicate absorption or emission strengths (e.g., Weedman et al. 2005; Desai et al. 2007; Imanishi et al. 2007). IRS is now enabling the study of the mid-infrared spectra of LIRGs to much higher redshifts (2.6; Houck et al. 2005 Yan et al. 2005). Although rare locally, LIRGs become an important population at high redshifts and account for an increasing fraction of the star-formation activity in the Universe (Le Floc’h et al., 2005). By studying their infrared properties, one can estimate the extent to which AGN and star-formation contribute to their infrared luminosities, and therefore determine a correct census of starbursts and AGN at epochs in the Universe when their luminosity density was at its maximum.
A particularly interesting population of high redshift optically faint infrared sources has been discovered using the Multiband Imaging Photometer (MIPS; Rieke et al. 2004). Various observing programs with IRS have found that MIPS sources at flux density levels of fν(24) 1 mJy with optical magnitudes 24 Vega magnitudes are typically at z 2 (Houck et al. 2005; Yan et al. 2007; Weedman et al. 2006b). Most of the sources are characterized by strong absorption by the 9.7 silicate feature, but sources chosen with an additional indicator of star formation (sub-mm detection or shape of the spectral energy distribution) often shown strong polycyclic aromatic hydrocarbon (PAH) emission features (Lutz et al. 2005; Weedman et al. 2006a; Menéndez-Delmestre et al. 2007; Yan et al. 2007; Sajina et al. 2007). Using traditional optical techniques to characterize these sources is difficult because they are too faint in the optical band. Mid-infrared spectroscopy is the best currently available tool in understanding these sources but we need to learn how to categorize them from the different features that are exhibited in the infrared band. We might expect sources which are selected on the basis of their large far-infrared flux densities to contain large amounts of cool dust and show signatures of starbursts. Mid-infrared spectroscopy of these sources will test this assumption and may help our understanding of high redshift LIRGs as a whole.
In this paper, we present the first Spitzer IRS spectra of a small sample of galaxies selected on the basis of their large 70 flux densities and optical faintness. We have previously reported results on sources chosen only with criteria of large infrared to optical flux ratios, as measured by comparison of their 24 flux density, fν(24) with optical magnitude (-[24]¿14; Houck et al. 2005; Weedman et al. 2006b). We now extend the IRS observations to additional sources in Boötes that are less extreme in their -[24] colors but are selected with the additional criteria of detection at 70m by MIPS.
A cosmology of , =0.3, and =0.7 is assumed throughout.
2. Source Selection
We selected a sample of optically faint far-infrared luminous sources from the Spitzer MIPS 70 survey of the NOAO Deep Wide-Field (NDWFS; Jannuzi & Dey 1999) Boötes field for follow-up with IRS. Such sources have not previously been studied and our paper provides the first census of their basic mid-IR properties. The 70 observations reach a 5 limiting flux density of f70μm=25 mJy, and yield a total of 330 sources. To insure a highly reliable 70 catalog, and allow follow-up observations with IRS, we only included 70 sources with a 24 flux density, f1 mJy and f30 mJy (this resulted in only 16 rejected sources and should not bias our sample to sources with unusually high 24 flux densities). We measured optical photometry in the publicly available NDWFS -band images, and selected all sources with 20 Vega mag. Although ideally, we would like to select sources as red in their optical to infrared colors as the [24]14 sources previously observed in the Boötes field, the lack of available candidates has required us to relax this criteria. Our sample have a larger range of optical to infrared colors corresponding to 11-[24]16.5. Although the optical obscuration is likely to be less extreme, the combined faint optical and bright infrared selection should still select distant infrared bright galaxies. The basic optical and infrared properties of the 11 sources are presented in Table 1. The IRAC photometry is from the IRAC Shallow Survey (Eisenhardt et al., 2004).
| IRS ID | MIPS | a,b | a,b | a,b | a,b | f3.6c | f4.5c | f5.8c | f8c | f24c | f70 | f160 | R-[24] |
|---|---|---|---|---|---|---|---|---|---|---|---|---|---|
| name | mag | mag | mag | mag | mJy | mJy | mJy | mJy | mJy | mJy | mJy | mag | |
| 70Bootes1 | SST24 J142651.9+343135 | 22.7 | 20.6 | 19.8 | 16.7e | 0.11 | 0.09 | 0.08 | 0.17 | 1.39 | 32.84.2 | 120 | 11.3 |
| 70Bootes2 | SST24 J142732.9+324542 | 22.7 | 20.7 | 19.9 | 0.07 | 0.07 | 0.09 | 0.21 | 1.22 | 34.64.1 | 120 | 11.2 | |
| 70Bootes3 | SST24 J143639.0+345222 | 23.2 | 22.0 | 21.1 | 0.13 | 0.10 | 0.10 | 0.12 | 1.26 | 35.06.3 | 14529 | 12.6 | |
| 70Bootes4 | SST24 J143218.1+341300 | 23.3 | 22.0 | 21.0 | 17.8d | 0.10 | 0.09 | 0.09 | 0.12 | 1.22 | 36.65.1 | 10020 | 12.6 |
| 70Bootes5 | SST24 J143050.8+344848 | 24.6 | 22.4 | 0.04 | 0.04 | 0.08 | 0.24 | 4.25 | 43.25.1 | 7014 | 16.5 | ||
| 70Bootes6 | SST24 J143830.6+344412 | 23.8 | 21.1 | 18.7 | 0.13 | 0.14 | 0.22 | 0.78 | 3.19 | 45.24.0 | 120 | 12.7 | |
| 70Bootes7 | SST24 J143151.8+324327 | 22.3 | 20.5 | 19.7 | 0.20 | 0.16 | 0.17 | 0.37 | 2.18 | 51.84.7 | 13527 | 11.7 | |
| 70Bootes8 | SST24 J143341.9+330136 | 22.7 | 21.1 | 20.2 | 17.8d | 0.08 | 0.06 | 0.09 | 0.21 | 4.72 | 63.23.9 | 10521 | 13.1 |
| 70Bootes9 | SST24 J143820.7+340233 | 22.7 | 20.3 | 19.3 | 15.7d | 0.40 | 0.27 | 0.32 | 0.34 | 3.46 | 67.23.1 | 24549 | 12.0 |
| 70Bootes10 | SST24 J143449.3+341014 | 23.6 | 21.5 | 20.7 | 17.5d | 0.25 | 0.23 | 0.68 | 0.97 | 2.19 | 94.54.5 | 12024 | 12.7 |
| 70Bootes11f | SST24 J143205.6+325835 | 21.3 | 20.1 | 19.8 | 0.08 | 0.13 | 0.27 | 1.3 | 16.66 | 115.812.8 | 120 | 13.5 |
3. Observations and Data Reduction
The spectroscopic observations were made with the IRS Short Low module in order 1 only (SL1) and with the Long Low module in orders 1 and 2 (LL1 and LL2), described in Houck et al. (2004). These orders give low resolution spectral coverage from 8 m to 35 m. Sources were placed on the slits by offsetting from a nearby 2MASS star. The integration times for individual sources are given in Table 2.
Because these faint sources are dominated by background signal, we restrict the number of pixels used to define the source spectrum, applying an average extraction width of only 4 pixels (which scales with wavelength). This improves the signal-to-noise ratio, although some source flux in outlying pixels is lost so a correction is needed to change the fluxes obtained with the narrow extraction to the fluxes that would be measured with a standard extraction. This flux correction is derived empirically by extracting an unresolved source of high S/N with both techniques and is a correction of about 10%, although the correction varies with order and with wavelength.
The background which was subtracted for LL1 or LL2 includes co-added backgrounds from both nod positions having the source in the other slit (i.e., both nods on the LL1 slit when the source is in the LL2 slit), added together with the alternative nod position in the same slit, yields a background observation with three times the integration time as for the source. For SL1, there was no separate background observation with the source in the SL2 slit, so background subtraction was done between co-added images of the two nod positions in SL1. Independent spectral extractions for each nod position were compared to reject highly outlying pixels in either spectrum, and a final mean spectrum was produced. Data were processed with version 13.0 of the SSC pipeline, and extraction of source spectra was done with the SMART analysis package (Higdon et al., 2004).
| IRS | exp. timea | IRS | b | LIR(7.7)c | LIR(24+70+160)d | SFRe | f(15)/f(6) | S10f | PAH EWg | IRS | |
|---|---|---|---|---|---|---|---|---|---|---|---|
| ID | s | log() | log() | log(L⊙) | log(L⊙) | M⊙ yr-1 | classh | ||||
| 70Bootes1 | 480,1200 | 0.501 | 43.89 | 44.53 | 11.72 | 12.15 | 90 | 4.2 | 0.260.05 | sb | |
| 70Bootes2 | 480,1200 | 0.366 | 43.65 | 44.18 | 11.36 | 11.79 | 40 | 1.8 | 0.850.17 | sb | |
| 70Bootes3 | 600,1440 | 0.986 | 44.69 | 45.37 | 12.56 | 13.05 | 625 | 4.3 | 0.480.05 | sb | |
| 70Bootes4 | 480,1200 | 0.975 | 44.24 | 45.32 | 12.51 | 12.95 | 565 | 9.6 | 0.590.07 | sb | |
| 70Bootes5 | 240,480 | 1.21 | 45.51 | 13.24 | 7.1 | -1.0 | 0.02 | abs | |||
| 70Bootes6 | 240,480 | 0.94 | 45.27 | 13.01 | 4.0 | -1.9 | 0.01 | abs | |||
| 70Bootes7 | 480,960 | 0.664 | 44.46 | 45.20 | 12.39 | 12.61 | 430 | 3.4 | 0.290.04 | sb | |
| 70Bootes8 | 240,480 | 0.81 | 44.79 | 12.88 | 7.7 | -3.6 | 0.03 | abs | |||
| 70Bootes9 | 240,480 | 0.668 | 44.62 | 45.43 | 12.62 | 12.81 | 720 | 4.0 | 0.530.04 | sb | |
| 70Bootes10 | 480,960 | 0.512 | 44.43 | 44.80 | 11.98 | 12.41 | 170 | 2.1 | 0.130.01 | sb | |
| 70Bootes11i | 240,480 | 0.48 | 44.75 | 12.49 | 8.3 | -2.2 | 0.02 | abs |
4. IRS Spectral Characteristics
The IRS spectra of the eleven 70 selected sources are presented in Figure 1. They are boxcar smoothed over a resolution element (approximately two pixels). Most of the sample (7 of 11) exhibit PAH emission features with measurable 6.2 PAH equivalent widths in their infrared spectra and are hereafter refered to as PAH-dominated sources (denoted as “sb” in Table 2). The large PAH equivalent widths are consistent with them being starburst-dominated sources and was anticipated because the large 70 fluxes imply that the spectra are dominated by dust that is cooler than that typically associated with AGN. The remaining four sources exhibit strong 9.7 silicate absorption features, no obvious PAH emission features, and are classified as absorption-dominated sources (denoted as “abs” in Table 2).
For the PAH-dominated sources, redshifts are determined from the strong PAH emission features at rest wavelengths 6.2m, 7.7m, and 11.3m. With sufficient signal-to-noise ratios, use of these features gives redshifts consistent with optically-derived redshifts to 0.001 (Houck et al. 2006). Redshift precision for faint sources depends on the signal-to-noise ratio, so for the spectra with PAH features, we consider the redshifts accurate only to 0.05. For the absorbed sources, redshifts are determined primarily from the localized maximum in the IRS continuum, or “hump”, which is blueward of the absorption feature. In the absorption-dominated sources, this feature is produced by absorption on either side of the feature, and with a possible contribution of 7.7m PAH emission in composite sources. We determine redshifts for absorption-dominated sources by assuming this hump has a rest-frame wavelength of 7.9m (see average spectra in Hao et al. (2006) and Spoon et al. (2007)). Comparison with optical redshifts (e.g., Brand et al. 2007) suggests that they can be uncertain to 0.1 in .
We constructed an average mid-infrared spectra of the 7 sources classified as PAH-dominated and for the 4 sources classified as absorption-dominated. This was achieved by wavelength correcting each individual spectrum to the rest frame (), interpolating them to a common wavelength scale of 0.1m/pix, and taking a straight (non-weighted) average at each wavelength position. The resulting average spectra are shown in Figure 2. We discuss each class in turn.


4.1. PAH-dominated 70 sources
The average IRS spectrum of the 7 PAH-dominated sources in Figure 2 is characteristic of classical starbursts. The spectrum is very similar in shape to the average low redshift (and lower luminosity) starburst template presented by Brandl et al. (2006), although the PAH emission features at 11.3 and 12.7 appear to be weaker in relation to the 7.7 PAH emission feature. The presence of low ionization [Ne II] 12.81 and [Ne III] 15.56 emission lines and lack of significant high ionization features such as [Ne V] 14.32, are also very typical of starbursts. There is a possible detection of the rotational H2 S(3) 9.7 emission line in the averaged spectrum. This feature is seen in both high and low resolution IRS spectra of nearby starburst galaxies (e.g., Brandl et al. 2006; Higdon et al. 2006; Farrah et al. 2007; Armus et al. 2007) and suggests the presence of warm molecular gas. We measure the rest-frame 6.2 PAH equivalent widths by fitting a single Gaussian and using the continuum adjacent to the feature, between 5.5 and 7. The values shown in Table 2 are similar to that of the lower redshift starburst galaxies presented by Brandl et al. (2006) and Desai et al. (2007).
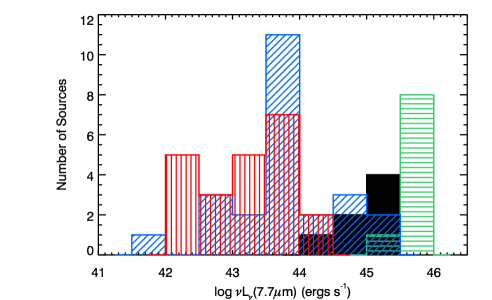
These sources are interesting because of their extreme mid-infrared luminosities and red colors. The median continuum luminosity is Lν(6m)=4 1044 ergs s-1 (1 1011 L⊙). For comparison, the median luminosity for starbursts in the Boötes f10 mJy sample of Houck et al. (2007) is 1 1043 ergs s-1 (3 109 L⊙) and for the prototype starburst NGC 7714 of Brandl et al. (2006) is 5 1042 ergs s-1 (1 109 L⊙). In Figure 3 we compare the PAH luminosities, log(Lν(7.7m)), of our sample to other starbursts. The mean PAH luminosity of the PAH-dominated sources is orders of magnitude larger than that of the local starbursts from Brandl et al. (2006). The least luminous sources in our sample are comparable to the most luminous starbursts in the local Universe. The luminosities are slightly lower than that of the high redshift starbursts from Weedman et al. (2006a) which were chosen from the existence of a stellar photospheric peak in their near-IR SEDs. If we use the conversion in Houck et al. (2007) between the 7.7 PAH luminosity and star formation rate, we find that our most luminous source has a star-formation rate of 720 M⊙ yr-1. This is only 50% lower than the upper limit on the H estimated star formation rates in local bright galaxies (Kennicutt, 1998). Table 2 shows that these sources have larger infrared luminosities (as estimated from their 24, 70, and 160 luminosities) than is estimated from their 7.7 PAH luminosities. Their infrared luminosities are among the largest known for starforming galaxies.
We measure the rest-frame fν(6m) and fν(15m) flux densities from the IRS spectra. fν(6m) is measured just shortward of 6 to avoid the 6.2 PAH feature and provide a measurement of the hot dust continuum. In Figure 4, we show the distribution of 6m luminosities (L6μm) as a function of continuum slope as measured by the rest-frame flux density ratio, fν(15m)/fν(6m) and observed flux density ratio, fν(70m)/fν(24m). The PAH-dominated sources have a lower mean fν(15m)/fν(6m) than that of the lower luminosity starbursts of Brandl et al. (2006). Although this could suggest a contribution from an AGN to the infrared emission (since the hot dust results in a shallower spectral slope), a larger sample size is needed to show this with any confidence.


4.2. Absorption-dominated 70 sources
The four absorption-dominated 70 sources have IRS spectra which are generally more characteristic of AGN: they have no obvious PAH emission features (6.2 PAH equivalent width 0.03) but deep silicate absorption features. They have 6 luminosities that are larger than that of the PAH-dominated sources and similar to that of the X-ray selected AGN in Brand et al. (2007). The infrared luminosities are also very large (L).
We measure the silicate strength S10,
| (1) |
using the method of Spoon et al. (2007) where is the observed flux density at the peak of the 10 feature and is the continuum flux at the peak wavelength, extrapolated from the continuum to either side. The silicate absorption depths are S10= 1.0, 1.9, 3.6, and 2.2 for 70Bootes5, 70Bootes6, 70Bootes8, and 70Bootes11 respectively. These correspond to very heavy absorption, similar to the median for ULIRGs in Hao et al. (2006) and Spoon et al. (2007) (S10= 1.6) and places them among the most heavily absorbed sources known (the most extreme example known has S10= 4.0; Spoon et al. 2006). Hao et al. (2006) find that the silicate strength correlates with the infrared slope at high mid-IR wavelengths (14-30) but not at lower mid-IR wavelengths (5-14 ), supporting the idea that the silicate feature arises in the cooler dust (although note that no correlation between the fν(60)/fν(25) flux density ratio and silicate strength is seen by Imanishi et al. (2007) in their sample of low redshift ULIRGs). Give that our selection criteria preferentially picks sources which are bright at 70 , the large silicate strengths for the absorption-dominated sources are consistent with the findings of Hao et al. (2006).
Are these sources powered by AGN or starburst activity? The individual spectra show no significant PAH-emission features (although there is a hint of the 7.7, 8.6, and 12.7 PAH features in the averaged spectrum in Figure 2), so they appear most similar to class 3A (little to no PAH emission, strong silicate absorption) in the scheme of Spoon et al. (2007). The IRS spectra are similar to that of 2 sources with deep silicate absorption strengths in a sample of 87 local Seyfert galaxies presented by Buchanan et al. (2006). Farrah et al. (2007) suggest that sources with very deep silicate absorption are likely to be AGN-dominated sources. The four sources have the largest 6 rest-frame luminosities in the sample and large infrared luminosities, again suggesting AGN activity. We observe no significant [Ne V] emission line that we might expect for AGN-dominated sources. However, given that [Ne V] often has a low equivalent width and that there are only 4 IRS spectra with low signal-to-noise at the observed wavelength of [Ne V] (see noise spectrum in Figure 1), this is not strong evidence against a large contribution from AGN emission.
Because AGN-dominated galaxies typically have shallower mid-IR slopes than starburst-dominated galaxies (e.g., Brand et al. 2006), measuring flux density ratios at wavelengths free of strong absorption or emission lines may help in determining their primary power source. For heavily absorbed sources, estimating the slope at large rest-frame mid-infrared wavelengths is important because dust may absorb near-IR photons and re-emit them at longer wavelengths, steepening the spectral slope. Figure 4 shows that the absorption-dominated sources have observed-frame fν(70m)/fν(24m) flux density ratios that are smaller than the PAH-dominated sources and closer to that of the X-ray selected AGN presented in Brand et al. (2007), suggesting that they have shallower infrared spectral slopes indicative of AGN-dominated sources. We note that one must be cautious in interpreting these results since the flux densities are in the observed frame and the rest-frame flux density ratio may vary with redshift. Although we can directly measure rest-frame flux density ratios at shorter wavelengths, these wavelengths are more likely to be affected by absorption. The fν(15m)/fν(6m) flux density ratios of absorption-dominated sources are generally larger than that of the PAH-dominated sources. We suggest that strong dust absorption in the absorption-dominated sources results in a steeper infrared slope at these shorter infrared wavelengths, despite the fact that they have small fν(70m)/fν(24m) flux density ratios and are likely to be dominated by AGN.
We conclude that these are examples of very obscured sources, which are likely to be powered by AGN. However, we cannot rule out the possibility of them being powered by deeply embedded starbursts. If the mid-IR emission of these sources is dominated by AGN, this implies that 36% of sources selected to have luminous 70 emission are AGN-dominated. Perhaps the 70 emission, which traces cooler dust, is also powered largely by AGN (see e.g., Imanishi et al. 2007). In this cases, large 70 luminosities be generated because the AGN are so heavily absorbed by dust that a large fraction of the hot dust emission is absorbed and re-emitted at longer wavelengths. Alternatively, if a large fraction of the mid-IR emission originates from star-formation activity, this implies that star-formation activity as traced by mid-IR signatures can be hidden by obscuration and/or low level AGN activity. Follow-up multi-wavelength observations (optical spectroscopy, deep X-ray and radio imaging) are clearly needed to fully determine the nature of these rare sources.
5. Infrared and infrared-to-optical colors of 70 selected sources
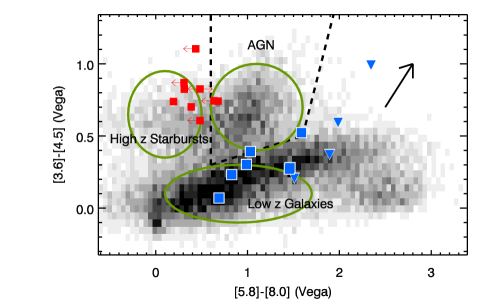
To help provide further insight as to the nature of the PAH-dominated and absorption-dominated sources, we show the IRAC color-color diagram for our IRS sources in Figure 5a. For both the PAH-dominated and absorption-dominated sources, the colors are consistent with the expected positions of starburst-dominated relatively low redshift galaxies (see also Yan et al. 2004; Sajina et al. 2005). Although we have concluded in previous sections that the absorption-dominated sources are probably largely powered by AGN emission, they do not fall into the “AGN wedge” of Stern et al. (2005). This is likely due to very heavy obscuration of the AGN. The IRAC colors of the absorption-dominated sources are consistent with their emission coming predominantly from heavily reddened star-formation processes (see reddening arrow estimated from the RV=3.1 dust model of Draine (2003)). The IRAC colors are redder than the PAH-dominated sources, consistent with them being more dusty and obscured than the PAH-dominated sources.
We also plot the IRAC colors of the starburst-dominated sources selected by Weedman et al. (2006a) to have optical and near-IR SEDs showing a luminosity peak from stellar photospheric emission at . These sources have (by design) red [3.6][4.5] colors but blue [5.8][8.0] colors and confirm that sources in this region tend to be high redshift starburst-dominated sources. This region becomes more heavily populated at lower 24 fluxes, consistent with the population becoming more dominated by starbursts sources at fainter f24 as found by Brand et al. (2006).
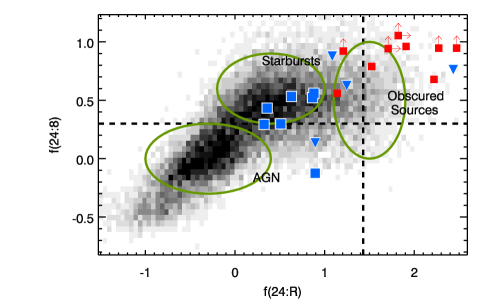
To investigate the effects of obscuration, we show the 24-to-8 vs. 24-to-0.7 color-color diagram for our sources in Figure 5b,(see also Yan et al. (2004) for the location of different populations in this color-color space). The 24-to-0.7 color is a good indicator of obscuration whereas the 24-to-8 color can be used as a crude measure of the spectral slope and hence the dust temperature distribution and whether the source is AGN- or starburst-dominated (Brand et al. 2006 find that AGN-dominated sources tend to have f(24:8)0.3 and starburst-dominated sources tend to have f(24:8)0.3; see also Yan et al. 2004). The PAH-dominated 70 selected sources have lower f(24:R) ratios than the absorption-dominated sources. Because PAH emission features can fall into the 8 IRAC wave-band for 0.6, the 24-to-8 color is not a good indicator for most of these sources. The absorption-dominated 70 sources have higher f(24:R) ratios than the PAH-dominated sources and steep spectral slopes, again consistent with them being more obscured. The starburst sources from Weedman et al. (2006a) have high f(24:R) ratios and f(24:8) ratios consistent with them being higher redshift, obscured starburst-dominated sources.
6. Multi-wavelength SEDs
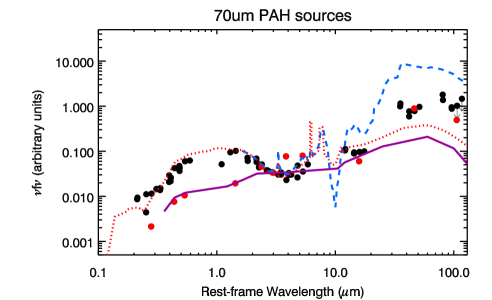
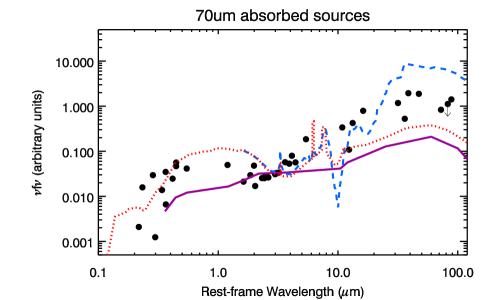
In Figure 6, we show the rest-frame multi-wavelength (, , , , 3.6, 4.5, 5.8, 8, 24, 70, 160) SEDs for the PAH-dominated and absorption-dominated sources. We also show the SEDs of M 82, Arp 220, and Mrk 231. M 82 is the nearest example of a star-bursting galaxy and is often considered the prototype of the starburst phenomena (e.g., Rieke et al. 1980). Arp 220 is a starburst-dominated ULIRG with strong dust extinction (e.g., Soifer et al. 1984; Sturm et al. 1996). Mrk 231 is a local obscured AGN with a luminous circumnuclear starburst (e.g., Solomon et al. 1992; Weedman et al. 2005). The individual SEDs are normalized to the same flux density at 3. All but one of the PAH-dominated sources are well fit by M 82 blue-wards of 15, consistent with them being starburst-dominated sources. 70Bootes10 (shown by the red points) is better fit by Mrk 231, suggesting that there is a large contribution of AGN emission in this source. 70Bootes10 is perhaps one of the most likely of the PAH-dominated sources to host an energetically important AGN, since it has the lowest 6.2 PAH equivalent width of all the PAH-dominated sources. The far-IR flux densities are between that of M 82 and Arp 220, suggesting that the PAH-dominated sources have a large relative cool to hot dust content that is between these two local sources. The absorption-dominated sources have a larger variation in their SED shapes. None of the sources exhibit a strong near-IR “bump” which is characteristic of starburst galaxies. The far-IR slopes are steeper than that of Mrk 231, suggesting that these sources have a larger cool to hot dust ratio than Mrk 231. This may result from our selection criteria which requires the galaxies to be very luminous at 70.
7. Conclusions
We have presented IRS mid-infrared spectra of a small sample of 11 sources from the MIPS survey of the Boötes field using selection criteria based on 70m detections (f30 mJy) and faint optical magnitudes (). All the sources lie in the redshift range , implying very large mid- and far-infrared luminosities. The IRS spectra of the eleven galaxies show either PAH emission features (7/11) or deep silicate absorption (4/11) features. The IRS spectra of the seven PAH-dominated sources are typical of classical starbursts, but with extremely large mid-infrared luminosities. This sample contains sources with very high PAH luminosities, implying star-formation rates of up to 700 M⊙ yr-1. The PAH-dominated sources tend to have lower fν(15m)/fν(6m) flux density ratios than that of lower redshift starburst galaxies with lower infrared luminosities. A larger sample is needed to show whether this is consistent with a contribution to the fν(6m) luminosity from hot dust associated with an AGN in more luminous sources.
The four absorption-dominated sources have very deep silicate absorption features that are larger than the median of that of local ULIRGs and their large fν(15m)/fν(6m) flux density ratios suggest that their mid-infrared spectral slope is steep. This suggests that the energy source is embedded in large volumes of cool dust. The very red [5.8]-[8.0] and relatively red [3.6]-[4.5] colors also suggest a large amount of dust along the line of sight to these sources. The deep silicate absorption, small fν(70m)/fν(24m) flux density ratio (which is less affected by dust obscuration than estimates from lower infrared wavelengths), and multi-wavelength SEDs suggests that they are likely dominated by AGN, although we cannot rule out that they are powered by very obscured starbursts. Follow-up multi-wavelength observations such as optical spectroscopy, and deep X-ray and radio observations may help to confirm their power source.
We thank our colleagues on the NDWFS, MIPS, IRS, AGES, and IRAC teams. KB is supported by the Giacconi fellowship at STScI. Support for this work by the IRS GTO team at Cornell University was provided by NASA through Contract Number 1257184 issued by JPL/Caltech. This research is partially supported by the National Optical Astronomy Observatory which is operated by the Association of Universities for Research in Astronomy, Inc. (AURA) under a cooperative agreement with the National Science Foundation. This work is based on observations made with the Spitzer Space Telescope, which is operated by the Jet Propulsion Laboratory, California Institute of Technology under a contract with NASA. The Spitzer / MIPS and IRAC surveys of the Boötes region were obtained using GTO time provided by the Spitzer Infrared Spectrograph Team (James Houck, P.I.), M. Rieke, and the IRAC Team (G. Fazio, P.I.). IRAC is supported in part through contract 960541 issued by JPL. The IRS was a collaborative venture between Cornell University and Ball Aerospace Corporation funded by NASA through the Jet Propulsion Laboratory and the Ames Research Center.
References
- Armus et al. (2007) Armus, L., Charmandaris, V., Bernard-Salas, J., Spoon, H. W. W., Marshall, J. A., Higdon, S. J. U., Desai, V., Teplitz, H. I., et al. 2007, ApJ, 656, 148
- Brand et al. (2007) Brand, K., Dey, A., Desai, V., Soifer, B. T., Bian, C., Armus, L., Brown, M. J. I., Le Floc’h, E., et al. 2007, ApJ, 663, 204
- Brand et al. (2006) Brand, K., Dey, A., Weedman, D., Desai, V., Le Floc’h, E., Jannuzi, B. T., Soifer, B. T., Brown, M. J. I., et al. 2006, ApJ, 644, 143
- Brandl et al. (2006) Brandl, B. R., Bernard-Salas, J., Spoon, H. W. W., Devost, D., Sloan, G. C., Guilles, S., Wu, Y., Houck, J. R., et al. 2006, ApJ, 653, 1129
- Buchanan et al. (2006) Buchanan, C. L., Gallimore, J. F., O’Dea, C. P., Baum, S. A., Axon, D. J., Robinson, A., Elitzur, M., & Elvis, M. 2006, AJ, 132, 401
- Desai et al. (2007) Desai, V., Armus, L., Spoon, H. W. W., Charmandaris, V., Bernard-Salas, J., Brandl, B. R., Farrah, D., Soifer, B. T., et al. 2007, ApJ accepted
- Draine (2003) Draine, B. T. 2003, ARA&A, 41, 241
- Eisenhardt et al. (2004) Eisenhardt, P. R., Stern, D., Brodwin, M., Fazio, G. G., Rieke, G. H., Rieke, M. J., Werner, M. W., Wright, E. L., et al. ApJS, 154, 48
- Elston et al. (2006) Elston, R. J., Gonzalez, A. H., McKenzie, E., Brodwin, M., Brown, M. J. I., Cardona, G., Dey, A., Dickinson, M., et al. 2006, ApJ, 639, 816
- Farrah et al. (2007) Farrah, D., Bernard-Salas, J., Spoon, H. W. W., Soifer, B. T., Armus, L., Brandl, B., Charmandaris, V., Desai, V., et al. 2007, ArXiv e-prints, 706
- Genzel & Cesarsky (2000) Genzel, R., & Cesarsky, C. J. 2000, ARA&A, 38, 761
- Hao et al. (2006) Hao, L., Weedman, D. W., Spoon, H. W. W., Marshall, J. A., Levenson, N. A., Elitzur, M., & Houck, J. R. 2006, ArXiv Astrophysics e-prints
- Higdon et al. (2006) Higdon, S. J. U., Armus, L., Higdon, J. L., Soifer, B. T., & Spoon, H. W. W. 2006, ApJ, 648, 323
- Higdon et al. (2004) Higdon, S. J. U., Devost, D., Higdon, J. L., Brandl, B. R., Houck, J. R., Hall, P., Barry, D., Charmandaris, V., et al. 2004, PASP, 116, 975
- Houck et al. (2004) Houck, J. R., Roellig, T. L., van Cleve, J., Forrest, W. J., Herter, T., Lawrence, C. R., Matthews, K., Reitsema, H. J., et al. 2004, ApJS, 154, 18
- Houck et al. (2005) Houck, J. R., Soifer, B. T., Weedman, D., Higdon, S. J. U., Higdon, J. L., Herter, T., Brown, M. J. I., Dey, A., et al. 2005, ApJ, 622, L105
- Imanishi et al. (2007) Imanishi, M., Dudley, C. C., Maiolino, R., Maloney, P. R., Nakagawa, T., & Risaliti, G. 2007, ApJS, 171, 72
- Jannuzi & Dey (1999) Jannuzi, B. T., & Dey, A. 1999, in ASP Conf. Ser. 191: Photometric Redshifts and the Detection of High Redshift Galaxies, ed. R. Weymann, L. Storrie-Lombardi, M. Sawicki, & R. Brunner, 111–+
- Kennicutt (1998) Kennicutt, Jr., R. C. 1998, ARA&A, 36, 189
- Le Floc’h et al. (2005) Le Floc’h, E., Papovich, C., Dole, H., Bell, E. F., Lagache, G., Rieke, G. H., Egami, E., Pérez-González, P. G., et al. 2005, ApJ, 632, 169
- Lutz et al. (1998) Lutz, D., Spoon, H. W. W., Rigopoulou, D., Moorwood, A. F. M., & Genzel, R. 1998, ApJ, 505, L103
- Lutz et al. (2005) Lutz, D., Yan, L., Armus, L., Helou, G., Tacconi, L. J., Genzel, R., & Baker, A. J. 2005, ApJ, 632, L13
- Menéndez-Delmestre et al. (2007) Menéndez-Delmestre, K., Blain, A. W., Alexander, D. M., Smail, I., Armus, L., Chapman, S. C., Frayer, D. T., Ivison, R. J., & Teplitz, H. I. 2007, ApJ, 655, L65
- Rieke et al. (1980) Rieke, G. H., Lebofsky, M. J., Thompson, R. I., Low, F. J., & Tokunaga, A. T. 1980, ApJ, 238, 24
- Rieke et al. (2004) Rieke, G. H., Young, E. T., Engelbracht, C. W., Kelly, D. M., Low, F. J., Haller, E. E., Beeman, J. W., Gordon, K. D., et al. 2004, ApJS, 154, 25
- Sajina et al. (2005) Sajina, A., Lacy, M., & Scott, D. 2005, ApJ, 621, 256
- Sajina et al. (2007) Sajina, A., Yan, L., Armus, L., Choi, P., Fadda, D., Helou, G., & Spoon, H. 2007, ArXiv e-prints, 704
- Sanders et al. (1988) Sanders, D. B., Soifer, B. T., Elias, J. H., Madore, B. F., Matthews, K., Neugebauer, G., & Scoville, N. Z. 1988, ApJ, 325, 74
- Saunders et al. (1990) Saunders, W., Rowan-Robinson, M., Lawrence, A., Efstathiou, G., Kaiser, N., Ellis, R. S., & Frenk, C. S. 1990, MNRAS, 242, 318
- Silva et al. (1998) Silva, L., Granato, G. L., Bressan, A., & Danese, L. 1998, ApJ, 509, 103
- Smith et al. (2007) Smith, J. D. T., Draine, B. T., Dale, D. A., Moustakas, J., Kennicutt, Jr., R. C., Helou, G., Armus, L., Roussel, H., et al. 2007, ApJ, 656, 770
- Soifer et al. (1984) Soifer, B. T., Neugebauer, G., Helou, G., Lonsdale, C. J., Hacking, P., Rice, W., Houck, J. R., Low, F. J., & Rowan-Robinson, M. 1984, ApJ, 283, L1
- Soifer et al. (1987) Soifer, B. T., Sanders, D. B., Madore, B. F., Neugebauer, G., Danielson, G. E., Elias, J. H., Lonsdale, C. J., & Rice, W. L. 1987, ApJ, 320, 238
- Solomon et al. (1992) Solomon, P. M., Downes, D., & Radford, S. J. E. 1992, ApJ, 387, L55
- Spoon et al. (2007) Spoon, H. W. W., Marshall, J. A., Houck, J. R., Elitzur, M., Hao, L., Armus, L., Brandl, B. R., & Charmandaris, V. 2007, ApJ, 654, L49
- Spoon et al. (2006) Spoon, H. W. W., Tielens, A. G. G. M., Armus, L., Sloan, G. C., Sargent, B., Cami, J., Charmandaris, V., Houck, J. R., & Soifer, B. T. 2006, ApJ, 638, 759
- Stern et al. (2005) Stern, D., Eisenhardt, P., Gorjian, V., Kochanek, C. S., Caldwell, N., Eisenstein, D., Brodwin, M., Brown, M. J. I., et al. 2005, ApJ, 631, 163
- Sturm et al. (1996) Sturm, E., Lutz, D., Genzel, R., Sternberg, A., Egami, E., Kunze, D., Rigopoulou, D., Bauer, O. H., et al. 1996, A&A, 315, L133
- Tran et al. (2001) Tran, Q. D., Lutz, D., Genzel, R., Rigopoulou, D., Spoon, H. W. W., Sturm, E., Gerin, M., Hines, D. C., et al. 2001, ApJ, 552, 527
- Weedman et al. (2005) Weedman, D. W., Hao, L., Higdon, S. J. U., Devost, D., Wu, Y., Charmandaris, V., Brandl, B., Bass, E., & Houck, J. R. 2005, ApJ, 633, 706
- Weedman et al. (2006a) Weedman, D., Polletta, M., Lonsdale, C. J., Wilkes, B. J., Siana, B., Houck, J. R., Surace, J., Shupe, D., et al. 2006a, ApJ, 653, 101
- Weedman et al. (2006b) Weedman, D. W., Soifer, B. T., Hao, L., Higdon, J. L., Higdon, S. J. U., Houck, J. R., Le Floc’h, E., Brown, M. J. I., et al. 2006b, ApJ, 651, 101
- Yan et al. (2005) Yan, L., Chary, R., Armus, L., Teplitz, H., Helou, G., Frayer, D., Fadda, D., Surace, J., & Choi, P. 2005, ApJ, 628, 604
- Yan et al. (2004) Yan, L., Helou, G., Fadda, D., Marleau, F. R., Lacy, M., Wilson, G., Soifer, B. T., Drozdovsky, I., et al. 2004, ApJS, 154, 60
- Yan et al. (2007) Yan, L., Sajina, A., Fadda, D., Choi, P., Armus, L., Helou, G., Teplitz, H., Frayer, D., & Surace, J. 2007, ArXiv Astrophysics e-prints