A fractal approach to the rheology of concentrated cell suspensions
Abstract
Results on the rheological behavior of novel CHO cell suspensions in a large range of concentrations are reported. The concentration–dependent yield stress and elastic plateau modulus are formalized in the context of fractal aggregates under shear, and quite different exponents are found as compared to the case of red blood cell suspensions. This is explained in terms of intrinsic microscopic parameters such as the cell-cell adhesion energy and cell elasticity but also the cell’s individual dynamic properties, found to correlate well with viscoelastic data at large concentrations ().
The rheology of complex fluids has been studied extensively over the past decades Larson (1999) and has revealed very intriguing behaviors, in particular properties of suspensions, either micronic or colloidal, are still a subject of interest Coussot (2005); Flatt and Bowen (2006); Alexandrou and Georgiou (2007); Brader et al. (2007). Classical behaviors of suspensions reveal shear–thinning effects usually, but other unusual ones like shear–thickening Laun (1984) (i.e. viscosity increase with shear rate) or yield stress have been observed Coussot (2005); Flatt and Bowen (2006). The yield stress is the critical value of the shear stress needed to induce flow for a given fluid. It is closely related to the internal structure of the fluid therefore its ability to form (or break) particle clusters under flow. In this respect many studies have focused on solid sphere suspensions.
On the other hand, there are much less works dedicated to suspensions of deformable particles, such as biological cell suspensions. The main works can be found in the field of blood rheology. Suspensions of Red Blood Cells (RBC) within plasma were first investigated by Chien Chien et al. (1967a, b) and revealed a shear–thinning behavior, but a more detailed inspection of the viscosity–shear rate diagrams showed that at low shear rates, the stress level is close to a constant (Pa), called the yield stress. The well–known Casson’s model Casson (1959), , relating the shear stress to the shear rate ( being a constant viscosity) can be used to determine the yield stress. Chien and co–authors obtained for a large range of hematocrit (H), i.e. the RBC volume concentration Chien et al. (1966). They showed a relationship of the type ( being a constant hematocrit) as also observed in a recent work Picart et al. (1998).
It is still not known yet whether this type of behavior is universal, or rather it could depend on cell type, cell shape or other biological effects such as cell adhesion or cell elasticity. In particular, one proposed explanation of the yield stress in RBCs suspensions is based on the existence of ”rouleaux” which build due to cell interactions and exhibit large shape aspect ratios Chien et al. (1967b) and a fractal dimension . Therefore it is necessary to apply strong enough stresses in order to break such aggregates, in close relation with the yield stress.
In this letter we propose to investigate the rheology of a new cell suspension, consisting of CHO cells (Chinese Hamster Ovary cells) in a large range of concentrations. Such cells are commonly used in biology, easy to culture, and can be genetically modified to induce different adhesive properties. These cells are spherical when suspended in a culture medium, and organized in a specific manner leading to particular aggregation patterns of fractal type. This leads to the determination of scaling laws based on fractal exponents (for the yield stress and elastic modulus ) which are seen to be non universal but dependent on cell type. The flow curves constitute a basis to test classical empirical models (Bingham, Casson, Herschel–Bulkley models) and other ones Snabre and Mills (1996, 1999) based on kinetic theories describing the rupture and formation of particle clusters. The latter ones successfully relate macroscopic effects to microscopic parameters, such as the cell–cell adhesion energy and the cell elasticity. These microscopic parameters remarkedly match those found in the litterature using other techniques. This is important in the context of recent studies related to tumour growth Drasdo and Höhme (2005); Galle et al. (2005); Ambrosi and Preziosi (2007) which consider cell assemblies with interactions as well as cell elastic deformations. Furthermore, this study emphasizes the relationship between the dynamic rheological properties of suspensions Verdier (2003) and the single cell properties.
Experiments – In our model system, CHO cells are grown in culture medium using standard boxes under proper conditions (, ), until they are at confluence, then are detached using trypsin, are mixed together and centrifugated at , a high enough velocity to get a concentrated suspension, but slow enough in order to maintain the cells alive. Cell volume concentration (i.e. similar to the hematocrit ) is determined accurately after centrifugation in hematocrit tubes containing the CHO cells. Then the right amount of remaining supernatant is removed until the desired concentration is obtained (between and ). Different experiments were carried out on a conventional Rheometer (Bohlin Gemini 150). Both steady shear and oscillatory measurements were made at . Due to the large amount of cells needed (we usually require twelve flasks in order to obtain a volume of roughly of cells), we chose to use a plate–plate geometry ( diameter) with a small gap (between and ) for the concentrated suspensions whereas the smaller concentrations (below ) were tested using the cone–plane geometry ( angle). Typically in our fluid, the suspended cells are spherical and monodisperse with a radius .
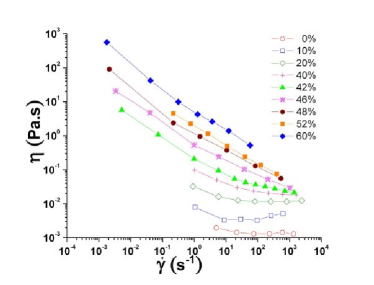
Results – Experimental results for constant steady state shear rate are presented in Fig.1. The viscosity is shown to vary over several decades, within shear rates typically between and . In some cases, we limited ourselves to the higher shear rates because of experimental reasons (i.e. steady state not reached). By a first inspection of the curves, we recognize the signature of a yield stress fluid as depicted by the slope close to in the viscosity–shear rate diagram (or equivalently a constant shear stress at low shear rates), especially at the largest concentrations , which will be particularly of interest here. The existence of this yield stress is attributed to weak interactions which can exist after preparation of the system. Already existing proteins are available on cell membranes and can be recruited to form bonds, leading to particular structure arrangments. This explains the presence of a yield stress related to the formation of such structures. The yield stress is found to depend on volume concentration in a manner to be discussed later.
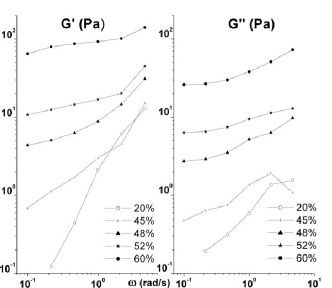
A second series of experiments was carried out in order to study the systems under oscillatory strains at angular frequency . Small deformations ( or less) within the linear regime were performed in order to characterize the elastic modulus and the loss modulus . We find an interesting behavior as shown in Fig.2. Moduli usually prevails over at small concentrations (e.g. ), but as increases, the system becomes elastic with a much larger . This behavior is the signature of a viscoelastic medium, due to the fact that interactions between elastic cells become effective at large concentrations (). The slow increase of the elastic modulus against frequency reveals the presence of a so–called ’elastic plateau’ modulus () determined by the value of at intermediate rates ( typically). The presence of elasticity has been observed previously for RBC suspensions Thurston (1972), above a critical volume fraction around , and is believed to come from the elasticity of the cells as they are packed more closely at large concentrations such as the ones also encountered in tumour spheroids Galle et al. (2005). Finally, we observe that the trends in the plots for large concentrations () are remarkedly similar to previous microrheological results obtained on single cells Fabry et al. (2001); Alcaraz et al. (2003); Hoffman et al. (2006).
As in the case of suspensions, we define a maximum packing fraction (which is usually or even for solid spheres in a face–centered–cubic crystal), depending on cell elasticity, i.e. their compactness Quemada (1998). Due to the presence of soft spherical cells, it is expected that the value of will be in this range. is determined using the reduced viscosity plot as a function of ( at a shear rate of , the solvent viscosity). In our case, this data (not shown) is found to match the well–known equation proposed earlier Krieger and Dougherty (1959), this providing the value .
In order to investigate the effect of the volume concentration , we first need to obtain the flow curve of the suspensions, as well as the relevant parameters, such as the yield stress . From the viscosity curve in Fig.1, we plot the stress vs. shear rate in Fig.3, and fit the data with the Herschel–Bulkley law Coussot (2005) , where is a constant, and is a shear–thinning exponent ranging between and ( is for a Bingham fluid, and the case of the Newtonian fluid is recovered for , ). Parameters have been optimized using a standard Newton–Raphson method.
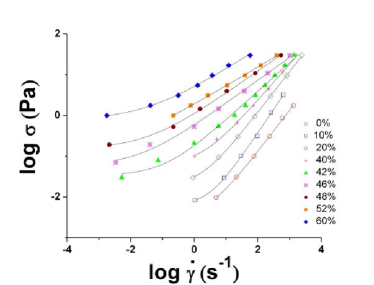
This leads to the determination of the yield stress as a function of volume fraction . Such measurements are usually difficult Chien et al. (1966) because of possible slip, sedimentation and evaporation Fung (1996); Picart et al. (1998). Care has been taken to avoid such problems, therefore only shear rates larger than (lowest value) are considered. The empirical Herschel–Bulkley model (involving a yield stress) is then used when sufficient data points are available. The fits are in satisfactory agreement with the data which gives good confidence in the values of the yield stresses for . Another attempt has been made using Casson’s model and gives similar data. The Bingham model seems to give less accurate values.
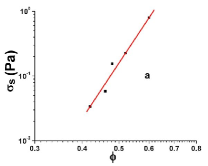
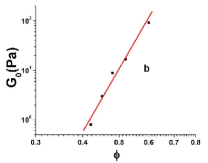
The values of the yield stresses as a function of volume concentration are plotted in Fig.4a, to be compared with the evolution of the shear plateau modulus (value of at a typical angular frequency ) in Fig.4b. These two plots show power law dependences of the form and and remind previous results Snabre and Mills (1996) obtained in the case of the rheology of RBCs suspensions, at least for the yield stress . From Fig.4a–b we find that and . These exponents are quite different from the ones obtained in the case of RBCs suspensions and this will be discussed below.
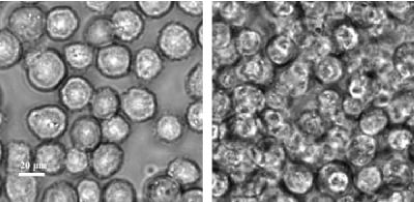
Modelling – As seen above, rheological modelling of such suspensions should therefore predict shear–thinning behavior, as well as yield stress properties at low shear rates and a concentration dependence of and . In addition, cell suspensions correspond to aggregated systems (see Fig.5). Under flow, their structure is based on the persistent remodelling of the cells with respect to each other as they exhibit deformations, rotations, possible rolling and/or separation. During such events, cells may form clusters of size to be compared with the cell size (radius). The formation and destruction of cell clusters is the major ingredient to understand the rheological properties of the cell system, in order to explain our previous data. For example, when sheared under stress , clusters break into smaller ones, leading to shear–thinning effects. On the other hand, the possible encounter of clusters leads to the formation of larger structures, increasing the viscosity. Using a series of clichés like in Fig.5, we measure the size of clusters at rest, found to vary as a power–law of the type de Gennes (1979), where is the number of cells in a cluster and the fractal dimension. For our case, we find that for 2D images. Thus, in three dimensions, we expect a fractal dimension of the order Kolb and Jullien (1984). This number is similar to the ones found for RBCs suspensions, although the scaling exponents for yield stresses are quite different.
In the semi–empirical model proposed by Snabre and Mills Snabre and Mills (1996, 1999), the formation and dissociation of clusters under flow is taken into account. A change in as a function of the applied shear stress is assumed : , where is a dimensionless parameter. is a critical stress related to the interfacial adhesion between cells : , and is the cell adhesion free energy. Using the concept of effective medium with volume fraction , one assumes an effective viscosity , and obtains the constitutive equation con which contains the yield stress given by . The last parameter to be used in the formula, , is the maximum packing concentration found previously.
We use the previous model to explain our experimental data. The exponent found for the yield stress is plugged into the previous scaling law for determination of the parameter . This is smaller than the values of found for RBC suspensions (typically ). This means that the size of clusters is not so sensitive to the applied stress, indeed one can consider that the cell aggregates are easier to form because of the round shape of the cells, in contrast with RBCs which need to bind in a very special way to form ’rouleaux’, thus the stress has more effect on the latter ones. We have obtained the value of the critical stress , and a corresponding value of . This value of is higher than the ones obtained for RBCs Snabre and Mills (1996) but the interfacial energy is in the range of the small values indicated for vesicles Guttenberg et al. (2001). This is in favor of the initial assumption that few adhesion molecules are involved in the region of contact between the cells.
Finally, we postulate a similar relationship de Gennes (1979) for the shear elastic modulus , where is an effective elastic modulus, but we include an additional exponent to be determined. We come up with and . This value of the reference modulus , as explained in the concept of fractal exponents de Gennes (1979), is to be related to typical values for single cells. In particular, it gives a Young’s elastic modulus of (assuming that the cell is incompressible) which is typical for adherent Wild Type CHO cells, of the order as measured by AFM Canetta et al. (2005); Zhao et al. (2006).
To sum up, the system studied here provides unique features important for the rheology of biological suspensions and tissues. These concentrated cell suspensions behave as yield stress fluids (also called visco–plastic materials), for which a fractal approach has been used. Under shear, the fractal structure changes and can be modelled using a yield stress and elasticity modulus related to the fractal dimension . Two other parameters of interest have been introduced in the model: the adhesion energy found in the range of typical values for cell adhesion energies (), and an effective elastic modulus () in agreement with previous microrheology experiments. We also found a similar behavior between the dynamic shear moduli and in this study (at large ), and the ones obtained from microrheological studies on single cells Fabry et al. (2001); Alcaraz et al. (2003); Hoffman et al. (2006) using various techniques. Both show slowly increasing dynamic moduli in terms of frequency, with the same relative positions. This idea probably deserves more attention and should be tested in the future, in particular further works may focus on the characterization of other cellular suspensions including cells with different elastic properties.
Finally, such a study can naturally lead to the understanding of biological tissues, by including stronger adhesion properties between the cells, or by taking into account the addition of Extra-Cellular Matrix components.
Acknowledgments – The authors wish to thank the EC Marie Curie Research Training Network MRTN-CT-2004-503661 on ”Modelling, mathematical methods and computer simulation of tumour growth and therapy” (http://calvino.polito.it/~mcrtn/) for financial support, and C. Misbah for fruitful discussions about the manuscript.
References
- Larson (1999) R. G. Larson, The structure and rheology of complex fluids (Oxford Univesity Press – New-York, 1999).
- Flatt and Bowen (2006) R. J. Flatt and P. Bowen, J. Am. Ceram. Soc. 89, 1244 (2006).
- Alexandrou and Georgiou (2007) A. N. Alexandrou and G. Georgiou, J. Non-Newtonian Fluid Mech. 142, 199 (2007).
- Brader et al. (2007) J. M. Brader, T. Voigtmann, M. E. Cates, and M. Fuchs, Phys. Rev. Lett. 98, 058301 (2007).
- Coussot (2005) P. Coussot, Rheometry of pastes, suspensions and granular materials (Wiley - New York, 2005).
- Laun (1984) H. M. Laun, Angew. Makromol. Chem. 124–125, 335 (1984).
- Chien et al. (1967a) S. Chien, S. Usami, R. J. Dellenback, and M. I. Gregersen, Science 157, 827 (1967a).
- Chien et al. (1967b) S. Chien, S. Usami, R. J. Dellenback, M. I. Gregersen, L. B. Nanninga, and M. Mason-Guest, Science 157, 829 (1967b).
- Casson (1959) N. Casson, A flow equation for pigment–oil suspensions of the printing ink type (Pergamon–London, 1959), chap. 5.
- Chien et al. (1966) S. Chien, S. Usami, H. M. Taylor, J. L. Lundberg, and M. I. Gregersen, J. Appl. Physiology 21, 81 (1966).
- Picart et al. (1998) C. Picart, J. M. Piau, H. Galliard, and P. Carpentier, J. Rheol. 42, 1 (1998).
- Snabre and Mills (1996) P. Snabre and P. Mills, J. Phys. III. France 6, 1811 (1996).
- Snabre and Mills (1999) P. Snabre and P. Mills, Colloids Surf. Physicochem. Eng. Aspects 152, 79 (1999).
- Drasdo and Höhme (2005) D. Drasdo and S. Höhme, Phys. Biol. 2, 133 (2005).
- Galle et al. (2005) J. Galle, M. Loeffler, and D. Drasdo, Biophys. J. 88, 62 (2005).
- Ambrosi and Preziosi (2007) D. Ambrosi and L. Preziosi (2007), unpublished.
- Verdier (2003) C. Verdier, J. Theor. Medicine 5, 67 (2003).
- Thurston (1972) G. B. Thurston, Biophys. J. 12, 1205 (1972).
- Fabry et al. (2001) B. Fabry, G. N. Maksym, J. P. Butler, M. Glogauer, D. Navajas, and J. J. Fredberg, Phys. Rev. Lett. 87, 148102 (2001).
- Alcaraz et al. (2003) J. Alcaraz, L. Buscemi, M. Grabulosa, X. Trepat, B. Fabry, R. Farré, and D. Navajas, Biophys. J. 84, 2071 (2003).
- Hoffman et al. (2006) B. D. Hoffman, G. Massiera, K. M. V. Citters, and J. C. Crocker, Proc. Natl Acad. Sci. USA 103, 10259 (2006).
- Quemada (1998) D. Quemada, Eur. Phys. J. AP 1, 119 (1998).
- Krieger and Dougherty (1959) I. M. Krieger and T. J. Dougherty, Trans. Soc. Rheology 3, 137 (1959).
- Fung (1996) Y. C. Fung, Biomechanics. Mechanical properties of living tissues (Springer – New York, 1996).
- de Gennes (1979) P. G. de Gennes, Scaling concepts in polymer physics (Cornell University Press, 1979).
- Kolb and Jullien (1984) M. Kolb and R. Jullien, J. Physique Lett. 45, 977 (1984).
- (27) The 1D–constitutive equation is given by which is implicit for but provides an explicit relation for in terms of . Letting allows to determine the yield stress .
- Guttenberg et al. (2001) Z. Guttenberg, B. Lorz, E. Sackmann, and A. Boulbitch, Europhys. Lett. 54, 826 (2001).
- Canetta et al. (2005) E. Canetta, A. Duperray, A. Leyrat, and C. Verdier, Biorheology 42, 321 (2005).
- Zhao et al. (2006) M. Zhao, C. Srinivasan, D. J. Burgess, and B. D. Huey, J. Mater. Res. 21, 1906 (2006).