ULTRAHIGH ENERGY NEUTRINOS WITH A MEDITERRANEAN NEUTRINO TELESCOPE
Abstract
A study of the ultra high energy neutrino detection performances of a km3 Neutrino Telescope sitting at the three proposed sites for “ANTARES”, “NEMO” and “NESTOR” in the Mediterranean sea is here performed. The detected charged leptons energy spectra, entangled with their arrival directions, provide an unique tool to both determine the neutrino flux and the neutrino-nucleon cross section.
Dipartimento di Scienze Fisiche, Universitá di Napoli ”Federico II” e INFN Sezione di Napoli, Complesso Universitario di Monte S. Angelo, Via Cintia, Napoli, 80126, Italy
Neutrinos are one of the main components of the cosmic radiation in the ultra-high energy (UHE) regime. Although their fluxes are uncertain and depend on the production mechanism, their detection can provide information on the sources and origin of the UHE cosmic rays.
From the experimental point of view the detection perspectives are
stimulated by the several proposals and R&D projects for Neutrino
Telescopes (NT’s) in the deep water of the Mediterranean sea,
namely ANTARES ?), NESTOR ?) and
NEMO ?), which in the future could lead to the
construction of a km3 telescope as pursued by the KM3NeT
project ?,?). Actually, on the ANTARES site, a
smaller telescope with a surface area of 0.1 km2 is already
under construction ?). A further project is
IceCube, a cubic-kilometer under-ice neutrino detector
?,?,?), currently being deployed in a location near
the geographic South Pole in Antarctica. IceCube applies
and improves the successful technique of AMANDA to a larger
volume.
Although NT’s were originally thought as detectors,
their capability as detectors has become a hot topic
?,?,?,?,?,?,?,?,?),
in view of the fact that flavor neutrino oscillations lead to
nearly equal astrophysical fluxes for the three neutrino flavors.
Despite the different behavior of the produced tau leptons with
respect to muons in terms of energy loss and decay length, both
and detection are sensitive to the matter
distribution near the NT site. Thus, a computation of the event
detection rate of a km3 telescope requires a careful analysis
of the surroundings of the proposed site. The importance of the
elevation profile of the Earth surface around the detector was
already found of some relevance in Ref. ?),
where some of the present authors calculated the aperture of the
Pierre Auger Observatory ?,?) for
Earth-skimming UHE ’s. Indeed, air shower experiments
can be used as NT’s at energieseV, a topic
recently reviewed in ?). In Ref. ?) it is estimated the effective aperture for
and detection of a km3 NT in the
Mediterranean sea placed at any of the three locations proposed by
the ANTARES, NEMO and NESTOR collaborations.
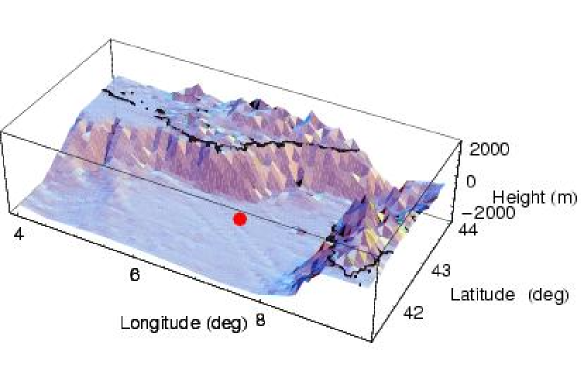
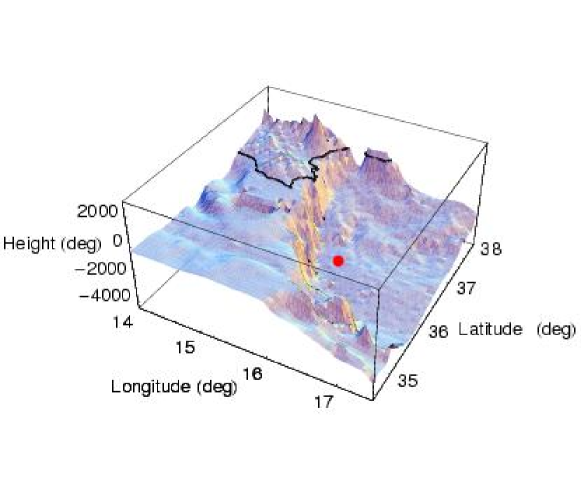
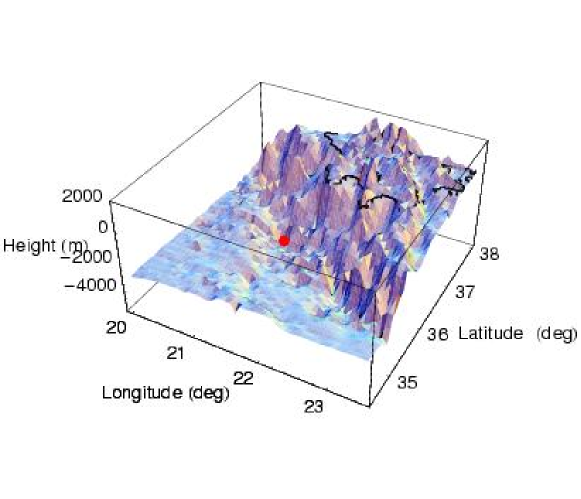
The characteristics of the three site surface profiles
?) are compared by using the DEM of the different
areas.
In the present paper we further develop the approach of Ref. ?) in order to apply the detection of UHE as a tool to simultaneously measure the UHE neutrino flux and the -N cross section in extreme kinematical regions.
Following the formalism developed in ?) we define the km3 NT fiducial volume as that bounded by the six lateral surfaces (the subindex =D, U, S, N, W, and E labels each surface through its orientation: Down, Up, South, North, West, and East), and indicate with the generic direction of a track entering the surface . The scheme of the NT fiducial volume and two examples of incoming tracks are shown in Fig. 4. We introduce all relevant quantities with reference to events, the case of being completely analogous.
Let be the differential flux of UHE . The number per unit time of leptons emerging from the Earth surface and entering the NT through with energy is given by
| (1) |
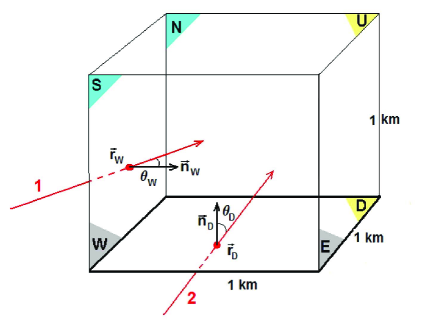
The kernel is the probability that an incoming crossing the Earth, with energy and direction , produces a -lepton which enters the NT fiducial volume through the lateral surface at the position with energy (see Fig. 4 for the angle definition). If we split the possible events between those with track intersecting the rock and the ones only crossing water, the kernel is given by the sum of these two mutually exclusive contributions,
| (2) |
For an isotropic flux we can rewrite Eq. (1), summing over all the surfaces, as
| (3) |
By using this expression one can also define the total aperture , with “” and “” denoting the rock and water kind of events, respectively,
| (4) |
where
| (5) |
Of course, the same quantities can be defined for muons coming from the charged-current interactions of .

In Fig. 5 we compare the detection performances of
a km3 NT placed at one of the three sites in the Mediterranean
sea. The NESTOR site shows the highest values of the
-aperture for both rock and water, due to its
larger depth and the particular matter distribution of the
surrounding area, while the lowest rates are obtained for
ANTARES. The aperture in the three sites can be quite
different at high energy but, in order to get the expected number
of UHE events per year, one has to convolve the aperture with a
neutrino flux which typically drops rapidly with the energy.
Although the percentage value of the matter effects remains
unchanged, in this very low statistics regime they can be hardly
distinguished; still, they can be enhanced by an appropriate
choice of the detector shape.
| Surf. | ANTARES |
NEMO |
NESTOR |
|---|---|---|---|
| D | 0.0059/0 | 0.0059/0 | 0.0058/0 |
| U | 0/0.1677 | 0.0002/0.2133 | 0.0002/0.2543 |
| S | 0.0185/0.1602 | 0.0256/0.1773 | 0.0240/0.2011 |
| N | 0.0241/0.1540 | 0.0229/0.1823 | 0.0321/0.1924 |
| W | 0.0212/0.1584 | 0.0335/0.1691 | 0.0265/0.2002 |
| E | 0.0206/0.1589 | 0.0190/0.1875 | 0.0348/0.1907 |
| Total | 0.090/0.799 | 0.107/0.929 | 0.123/1.039 |
Knowing the aperture of the NT at each site, we can compute the
expected event rate, once a neutrino flux is specified. In
Table 1 these rates are shown assuming a
GZK-WB flux ?,?). The effect due to
the local matter distribution is responsible for the N-S, W-E and
NE-SW asymmetries for the ANTARES, NEMO and
NESTOR sites, respectively, as expected from the matter
profiles shown in Figs. 1, 2 and
3. These matter effects, for the specific UHE flux
considered (GZK-WB), correspond to an enhancement of rock
events which goes from 20 to 50% for the three sites,
respectively, and a screening factor for water events from 3
to 10%. The largest relative difference among lateral surfaces is
in the case of W/E for NEMO, where the huge wall to the
west of the site (see Fig. 2) improves the rate by about
75%, almost a factor 2! Notice also that the water events
from the U surface are basically proportional to the depth.
Due to the dependence of Eq. (3) on the neutrino flux and the different behavior of and as functions of the neutrino-nucleon cross section, , one can imagine to use the detected events, properly binned for energy loss and arrival direction, in order to obtain information on both the neutrino flux and the neutrino-nucleon cross section. In particular, since the real observable is the energy deposited in the detector and not the energy and/or the nature of the charged lepton, either or , crossing the NT, one must sum the two contributions. In fact, the events whose topology allows for determining the nature of the charged lepton are a negligible fraction of the expected total number.
 |
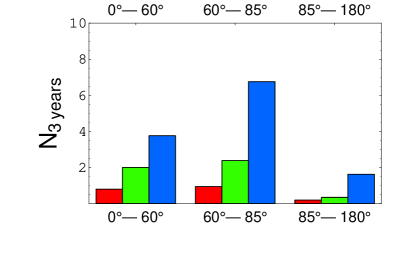 |


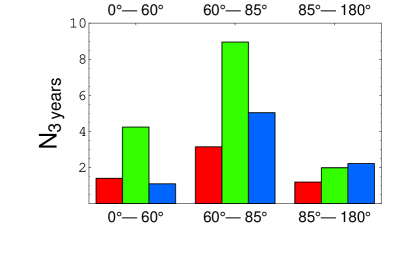
In the two panels of Figure 6 are reported the number of events () collected in three years from a km3 NT. In particular the left panel concerns the events where the energy deposited in the detector is in the range - GeV, whereas the one on the right reports events where the energy lost is larger than GeV. For each panel the events have been split in three bins according to their arrival directions ( represents the vertical downgoing direction). Fixing the panel and the arrival direction range, the three bars of the histogram represents three different neutrino fluxes and chosen. In particular from left to right we have the GZK-WB23),24) flux and standard cross section, the GZK-WB23),24) flux and three times the standard cross section and finally, the more copious GZK-H23),24) flux and standard cross section. Note that the total number of events for GZK-WB with and for GZK-H with standard cross section are the same. The different flux/cross section configurations can be disentangled by observing the different behavior of the height of the bars as function of the energy lost and arrival direction.
In order to study the sensitivity to both neutrino flux and it is necessary to parameterize their standard expression and the possible departure from it. In particular by using a standard Waxman-Bahcall ?) (C=D=1) as a conservative reference for the neutrino flux we allow for a variation of its steepness via the exponent and for the normalization through the multiplicative factor , namely:
| (6) |
In the same way, for the neutrino-nucleon cross section one can parameterize the presence of new physics by assuming a departure from the standard expression ?) in terms of two free parameters, and , whose standard values are and :
| (12) |
where . In particular fixes the energy value where new physics appears and is the change in the energy slope of . In Figures 7, 8 and 9 it is reported the effect of the variation of the single parameter , , on the number density of yearly events ( plus ) as a function of the energy deposited by the charged lepton . The factor has been fixed to its standard value () since it is just a normalization and thus simply correlated to the exposure time needed to achieve the proper event statistics.
The quite relevant effect shown by Figures 7, 8 and 9 supports once more the idea that a km3 NT can provide a real chance to both measure UHE neutrino flux and the neutrino-nucleon cross section in the extreme kinematical region, where some new physics could appear. Of course the real feasibility of such measurements will crucially depend of the size of the neutrino flux which fixes the time required to reach a reasonable statistics. Then, while in this exercise we adopted an extreme conservative point of view working with Waxman-Bahcall like fluxes, one can wish for a more optimistic real situation.
References
- [1] Aslanides E et al., 1999 “A Deep Sea Telescope for High Energy Neutrinos, Proposal,” astro-ph/ 9907432.
- [2] Bottai S, 1999 Contribution to 26th ICRC, Salt Lake City, AIP Conf. Proc. 516 vol 2 456.
- [3] Riccobene G, 2002 Proc. of the Workshop on Methodical Aspects of Underwater/Ice Neutrino Telescopes, 61
- [4] Katz U F, “Neutrino telescopy in the Mediterranean sea,” 2006 Prog. Part. Nucl. Phys. 57 273.
- [5] Katz U F, “KM3NeT: Towards a km**3 Mediterranean neutrino telescope,” 2006 [astro-ph/0606068].
- [6] J. A. Aguilar et al. [ANTARES Collaboration], “First results of the instrumentation line for the deep-sea ANTARES neutrino telescope,” Astropart. Phys. 26 (2006) 314 [astro-ph/0606229].
- [7] Ahrens J et al., 2000 The IceCube NSF Proposal.
- [8] Ahrens J et al., 2001 IceCube Conceptual Design Document.
- [9] Ahrens J et al., “Sensitivity of the IceCube detector to astrophysical sources of high energy muon neutrinos,” 2004 Astropart. Phys. 20 507.
- [10] R. Gandhi, C. Quigg, M. H. Reno and I. Sarcevic, “Ultrahigh-Energy Neutrino Interactions,” Astropart. Phys. 5 (1996) 81 [hep-ph/9512364].
- [11] Dutta S I, Reno M H and Sarcevic I, 2000 “Tau-neutrinos underground: Signals of nu/mu — nu/tau oscillations with extragalactic neutrinos,” Phys. Rev. D 62 123001.
- [12] González-García M C, Halzen F and Maltoni M, “Physics reach of high-energy and high-statistics Icecube atmospheric neutrino data,” 2005 Phys. Rev. D 71 093010.
- [13] Anchordoqui L and Halzen F, “Icehep High Energy Physics At The South Pole,” 2005 [hep-ph/0510389].
- [14] Yoshida S, Ishibashi R and Miyamoto H, “Propagation of extremely-high energy leptons in the earth: Implications to their detection by the IceCube neutrino telescope,” 2004 Phys. Rev. D 69 103004.
- [15] Beacom J F et al., “Measuring flavor ratios of high-energy astrophysical neutrinos,” Phys. Rev. D 68, 093005 (2003) [Erratum-ibid. D 72, 019901 (2005)].
- [16] Athar H, Parente G and Zas E, “Prospects for observations of high-energy cosmic tau-neutrinos,” Phys. Rev. D 62, 093010 (2000).
- [17] Bugaev E, Montaruli T, Shlepin Y and Sokalski I, “Propagation of tau neutrinos and tau leptons through the earth and their detection in underwater / ice neutrino telescopes,” Astropart. Phys. 21, 491 (2004).
- [18] Ishihara A (IceCube Collaboration), 2006 IceCube projects and its EHE physics capability, Proceedings of CRIS06, Catania (Italy), to appear in Nucl. Phys. Proc. Suppl.
- [19] Miele G, Pastor S and Pisanti O, “The aperture for UHE tau neutrinos of the Auger fluorescence detector using a digital elevation map,” 2006 Phys. Lett. B 634 137.
- [20] Pierre Auger Collaboration, 1996 The Pierre Auger Project Design Report, FERMILAB-PUB-96-024.
- [21] Abraham J et al. (Pierre Auger Collaboration), “Properties and performance of the prototype instrument for the Pierre Auger Observatory,” 2004 Nucl. Instrum. Meth. A 523 50.
- [22] Zas E, “Neutrino detection with inclined air showers,” 2005 New J. Phys. 7 130.
- [23] A. Cuoco, G. Mangano, G. Miele, S. Pastor, L. Perrone, O. Pisanti and P. D. Serpico, JCAP 0702, 007 (2007) [arXiv:astro-ph/0609241].
- [24] U.S. Department of Commerce, National Oceanic and Atmospheric Administration, National Geophysical Data Center, 2001 2-minute Gridded Global Relief Data (ETOPO2), http://www.ngdc.noaa.gov/mgg/fliers/01mgg04.html
- [25] Waxman E and Bahcall J N, “High energy neutrinos from astrophysical sources: An upper bound,” 1999 Phys. Rev. D 59 023002.
- [26] Gandhi R et al., “Neutrino interactions at ultrahigh energies,” Phys. Rev. D 58, 093009 (1998).