The Keck Aperture Masking Experiment: Multi-wavelength observations of 6 Mira Variables.
Abstract
The angular diameters of six oxygen rich Mira-type long-period variables have been measured at various near-infrared (NIR) wavelengths using the aperture masking technique in an extensive observing program from 1997 Jan to 2004 Sep. These data sets span many pulsation cycles of the observed objects and represent the largest study of multi-wavelength, multi-epoch interferometric angular diameter measurements on Mira stars to date. The calibrated visibility data of Cet, R Leo, R Cas, W Hya, Cyg and R Hya are fitted using a uniform disk brightness distribution model to facilitate comparison between epochs, wavelengths and with existing data and theoretical models. The variation of angular diameter as a function of wavelength and time are studied, and cyclic diameter variations are detected for all objects in our sample. These variations are believed to stem from time-dependent changes of density and temperature (and hence varying molecular opacities) in different layers of these stars. The similarities and differences in behaviour between these objects are analyzed and discussed in the context of existing theoretical models. Furthermore, we present time-dependent 3.08 m angular diameter measurements, probing for the first time these zones of probable dust formation, which show unforeseen sizes and are consistently out of phase with other NIR layers shown in this study. NIR light-curves were recovered, and show the distinctive phase lag in the maxima of 0.2 (compared to the visual maximum), similar to the lag found by, e.g. Smith et al. (2002) and Nadzhip et al. (2001). The S-type Mira Cyg exhibits significantly different behaviour compared to the M-type Miras in this study, both in its NIR light-curves and its diameter pulsation signature. Our data show that the NIR diameters predicted by current models are too small and need to incorporate additional and/or enhanced opacity mechanisms. Also, new tailored models are needed to explain the behaviour of the S-type Mira Cyg.
1 Introduction
Mira variables are pulsating M-type giants with very extended stellar atmosphere and mass-loss rates of up to M (e.g. Jura & Kleinmann 1990).
Multi-wavelength studies allow us to probe the atmospheric structure, including H2O and dust shells.
Optical and near-infrared (NIR) interferometry has been able to constrain fundamental parameters
such as intensity distributions, effective temperatures and diameters, and the dependence of these on wavelength and pulsation phase
(e.g., Haniff et al. 1995; van Belle et al. 1996; Perrin et al. 1999; Young et al. 2000;Hofmann et al. 2002; Thompson et al. 2002; Woodruff et al. 2004).
Interferometric studies of Mira stars conducted over multiple epochs
and spanning a range of wavelengths have helped to address fundamental questions such
as the pulsation mode of these stars (e.g., Woodruff et al. 2004;Fedele et al. 2005), the
molecular and dust abundances in the atmosphere (e.g. Ireland et al. 2004a, b; Ireland & Scholz 2006),
the characteristics of the circumstellar environment (e.g. Danchi et al. 1994) and photospheric/circumstellar asymmetries (e.g. Ragland et al. 2006).
Interferometry, together with a host of other observational techniques, has gradually been making advances into our understanding of the basic physics of these stars. For example, there is now consensus that Miras pulsate in the fundamental mode, based on photometry, e.g., MACHO observations (see Wood et al. 1999), and spectroscopy (see Scholz & Wood 2000) in addition to interferometry. However, the structure and composition of the stellar atmosphere still shows surprising results when investigated in detail. Ragland et al. (2006) have, e.g., detected band asymmetric brightness distributions in about 29% of their sample of nearby asymptotic giant branch stars, substantiating another level of complexity in the structure of this class of objects.
In this paper we present the most comprehensive interferometric study of Miras to date,
encompassing 6 nearby objects, observed at up to 19 different phases in 4 filters.
With this homogeneous data-set, we are able to examine phase-dependent
variations in Miras’ atmospheric structure and are in a position to investigate long term effects that span several pulsation cycles.
By observing in the NIR (especially within the , and bandpasses), we can sample molecular strata near the continuum-forming layers that
are often close to the position of the Rosseland layer (, cf. Scholz 2003 and references therein).
Theoretical models describe the molecular layering in the atmosphere and its variation with time (e.g. Bessell et al. 1996; Hofmann et al. 1998; Ireland et al. 2004a, b), and make predictions of observables such as light-curves, diameters and intensity distributions. With our extensive database we can challenge existing models and motivate the development of a more complete physical picture of Mira variables. Ultimately, the aim of interferometric observations like these is to calibrate the theoretical models so that fundamental parameters of Miras can be derived from simple observables, enabling studies of stellar populations beyond the solar neighbourhood.
2 Observations and Data Reduction
2.1 Aperture-masking Observations
Our sample of 6 Miras contains only nearby objects, all of which have revised Hipparcos distances (see Table 2.1).
The objects were chosen for their large angular diameters and NIR brightness.
Observations were performed with the 10 m Keck I telescope at a range of
NIR wavelengths (see Table 2) using the Near Infrared Camera (NIRC).
The telescope pupil was converted into a sparse interferometric array by placing
aperture masks in the beam in front of the infrared secondary mirror, allowing
the recovery of the Fourier amplitudes and closure phases for baselines up
to 9.8 m.
For a detailed discussion of mask design, observing
methodology, scientific rationale and implementation, we refer to Tuthill et al. (2000b).
For this work we used non-redundant masks with 15 or 21 holes configured to deliver near-optimal sampling of the Fourier plane (Golay 1971). Data-sets consisting of 100 140 msec exposures were taken, alternating between the target of interest and nearby calibrator stars. The latter were chosen to have well characterized, smaller apparent sizes (see Table 2.1). The data were recorded at 19 different epochs spanning more than 7 years, delivering good coverage through the pulsation cycles of the objects observed. Tables 4 to 9 list these observations.
| Name | Period | Spectral | Distance | Distance |
|---|---|---|---|---|
| [days] | Type Range | [pc] | reference | |
| Cet | 332 | M5-9e | 1 | |
| R Leo | 312 | M6-9.5e | 1 | |
| R Cas | 430 | M6-10e | 2 | |
| W Hya | 385 | M7.5-9ep | 1 | |
| Cyg | 408 | S6-S9(MSe) | 1 | |
| R Hya | 380 | M6-9eS(Tc) | 1 |
References. — Object Period from the American Association of Variable Star Observers (AAVSO) visual light curves (A.A. Henden et al. 2006, private communication), M Spectral Type Range from Sloan & Price (1998) and Cyg Spectral Type from Keenan & Boeshaar (1980), Distances from (1) Knapp et al. (2003) or (2) Pourbaix et al. (2002)
| Filter | Keck/NIRC | Centre Wavelength | Bandwidth |
|---|---|---|---|
| Filter Name | [m] | [m] | |
| z 1.08 | HeI | 1.083 | 0.014 |
| J 1.24 | OII | 1.236 | 0.011 |
| H 1.65 | FeII | 1.647 | 0.018 |
| K 2.26 | Kcont | 2.260 | 0.050 |
| H221 | 2.261 | 0.0239 | |
| L 3.08 | PAHcs | 3.082 | 0.101 |
| L 3.31 | PAH | 3.310 | 0.063 |
| Calibrator | Spectral | Adopted UD | Reference |
|---|---|---|---|
| Type | Angular Diameter [mas] | ||
| Cet | M1.5III | 1 | |
| Ari | K2III | 1 | |
| Cas | K0III | 2 | |
| Cet | K0III | 4 | |
| Hya | K3II-III | 3 | |
| Leo | M2III | 5 | |
| Lyn | K7III | 1 | |
| 2 Cen | M4.5III | 6 | |
| Sge | M0III | 1 | |
| Sgr | K3III | 7 | |
| 4 Cas | M1III | 6 | |
| Cyg | K0III | 2 | |
| Oph | M0.5III | 8 | |
| Vega | A0V | 9 | |
| Cyg | K4.5I | 10 | |
| Hya | G8III | 11 | |
| Hya | K2III | 4 |
References. — (1) Dyck et al. (1998); (2) Mozurkewich et al. (1991); (3) Mozurkewich et al. (2003); (4) from CHARM catalog (Richichi & Percheron, 2002); (5) Ridgway et al. (1979); (6) Dumm & Schild (1998); (7) Monnier et al. (2004); (8) Perrin et al. (1998); (9) Hanbury Brown et al. (1974); (10) Dyck et al. (1996); (11) from CHARM2 catalog (Richichi et al., 2005)
| Date | JD | UDJ 1.24 | UDH 1.65 | UDK 2.26 | UDL 3.08 | Calibrators | |
|---|---|---|---|---|---|---|---|
| -2450000 | [mas] | [mas] | [mas] | [mas] | |||
| 1997Dec16 | 800 | 0.94 | 22.2 | 27.5 | 31.0 | 58.8 | Cet |
| 1998Sep29 | 1056 | 1.71 | 29.1 | 33.3 | 37.0 | 57.7 | Cet |
| 1999Jan05 | 1184 | 2.10 | 25.6 | 27.6 | 31.8 | 61.4 | Cet |
| 61.5 | |||||||
| 61.5 | |||||||
| 61.5 | |||||||
| 1999Jul29 | 1390 | 2.72 | 29.4 | 32.9 | 36.9 | 53.2 | Cet |
| 2000Jan25 | 1570 | 3.26 | 30.1 | 33.1 | 58.3 | Cet | |
| 2000Jun23 | 1720 | 3.71 | 29.9 | 38.1 | 56.9 | Ari | |
| 58.2 | |||||||
| 2001Jul29 | 2121 | 4.92 | 30.1 | 33.8 | 58.7 | Cas , Cet | |
| 2002Jul23 | 2479 | 5.98 | 24.8 | 26.6 | 34.9 | 61.5 | Cet |
| 2004Sep14 | 3262 | 8.30 | 27.1 | 29.3 | 32.3 | 59.0 | Cet , Cet |
| 31.8 | 57.5 | ||||||
| 57.4 | |||||||
| 58.2 | |||||||
| 57.8 | |||||||
| 57.9 |
| Date | JD | UDJ 1.24 | UDH 1.65 | UDK 2.26 | UDL 3.08 | Calibrators | |
|---|---|---|---|---|---|---|---|
| -2450000 | [mas] | [mas] | [mas] | [mas] | |||
| 1997Jan29 | 478 | 0.05 | 31.0 | 29.6 | 30.3 | 52.1 | Hya , Leo |
| 32.6 | 32.9 | 52.8 | |||||
| 55.6 | |||||||
| 54.6 | |||||||
| 53.8 | |||||||
| 54.5 | |||||||
| 1997Dec16 | 800 | 1.14 | 30.0 | 31.4 | 47.8 | Hya | |
| 29.9 | |||||||
| 1998Apr14 | 918 | 1.54 | 32.9 | 32.3 | 49.2 | Lyn | |
| 1998Jun04 | 970 | 1.71 | 33.1 | 29.7 | 32.6 | 50.7 | Lyn |
| 1999Jan05 | 1213 | 2.40 | 33.9 | Leo | |||
| 1999Feb04 | 1213 | 2.49 | 31.2 | 33.2 | 35.4 | 50.9 | Hya |
| 1999Apr25 | 1295 | 2.75 | 29.6 | 29.1 | 34.6 | 53.3 | Lyn, Leo |
| 34.1 | |||||||
| 2000Jan25 | 1570 | 3.64 | 34.6 | 33.1 | 52.6 | Lyn | |
| 52.1 | |||||||
| 2000Jun23 | 1720 | 4.12 | 29.3 | 31.2 | 55.4 | Leo | |
| 2001Jun11 | 2073 | 5.24 | 31.5 | 33.5 | 30.7 | 56.5 | Leo , Lyn, 2 Cen |
| 2003May12 | 2772 | 7.48 | 36.2 | 37.1 | Leo | ||
| 2004May28 | 3154 | 8.71 | 30.1 | 32.1 | 56.4 | Leo | |
| 2005May26 | 3516 | 9.88 | 28.9 | 31.5 | Leo |
| Date | JD | UDJ 1.24 | UDH 1.65 | UDK 2.26 | UDL 3.08 | Calibrators | |
|---|---|---|---|---|---|---|---|
| -2450000 | [mas] | [mas] | [mas] | [mas] | |||
| 1997Dec08 | 802 | 0.67 | 30.0 | Cas | |||
| 1998Jun04 | 970 | 1.06 | 25.0 | 23.2 | 24.2 | 44.8 | Sge, Cas |
| 1998Sep29 | 1056 | 1.27 | 24.5 | 27.0 | 41.1 | Cas | |
| 1999Jan05 | 1184 | 1.57 | 24.4 | 23.9 | 28.2 | 44.1 | Cas |
| 1999Jul29 | 1390 | 2.04 | 24.1 | 22.4 | 28.5 | 48.3 | Cas |
| 2000Jan25 | 1570 | 2.46 | 27.7 | 29.7 | Cas | ||
| 2000Jun23 | 1720 | 2.81 | 24.9 | 26.1 | 28.9 | 46.2 | Cas |
| 2001Jun11 | 2073 | 3.63 | 26.5 | 27.4 | Cas | ||
| 27.6 | |||||||
| 27.7 | |||||||
| 2001Jul29 | 2121 | 3.74 | 25.5 | 26.1 | Cas | ||
| 2002Jul23 | 2479 | 4.58 | 29.5 | 29.6 | 42.0 | Cas | |
| 27.4 | |||||||
| 2003May12 | 2772 | 5.26 | 23.3 | 22.1 | Sgr | ||
| 24.4 | 29.0 | ||||||
| 2004May28 | 3154 | 6.14 | 23.2 | 24.6 | 48.9 | 4 Cas | |
| 2004Sep2 | 3262 | 6.39 | 27.6 | 26.8 | 25.2 | 42.2 | Cet , Cas , Cyg |
| 26.6 | 26.5 | 24.5 | 40.5 | ||||
| 27.9 |
| Date | JD | UDJ 1.24 | UDH 1.65 | UDK 2.26 | UDL 3.08 | Calibrators | |
|---|---|---|---|---|---|---|---|
| -2450000 | [mas] | [mas] | [mas] | [mas] | |||
| 1997Jan29 | 478 | 0.53 | 41.9 | 38.9 | 42.4 | 62.3 | Oph |
| 42.0 | 38.3 | 42.5 | 61.7 | ||||
| 41.9 | 60.3 | ||||||
| 39.4 | 60.6 | ||||||
| 39.7 | |||||||
| 41.4 | |||||||
| 1998Apr14 | 918 | 1.76 | 32.8 | 34.2 | 37.4 | 62.3 | Lyn, 2 Cen |
| 34.6 | 39.8 | ||||||
| 36.7 | |||||||
| 1998Jun04 | 970 | 1.90 | 32.0 | 33.6 | 36.41.1 | 62.7 | 2 Cen |
| 1999Jan05 | 1184 | 1.50 | 43.0 | 2 Cen | |||
| 41.8 | |||||||
| 42.4 | |||||||
| 42.6 | |||||||
| 1999Feb05 | 1213 | 2.58 | 39.3 | 41.6 | 42.0 | 63.2 | 2 Cen |
| 43.8 | |||||||
| 1999Apr25 | 1295 | 2.79 | 35.2 | 38.1 | 41.0 | 2 Cen | |
| 36.7 | 36.6 | ||||||
| 36.3 | |||||||
| 36.8 | |||||||
| 1999Jul29 | 1390 | 3.04 | 34.8 | 36.7 | 2 Cen | ||
| 2000Jan25 | 1570 | 3.53 | 47.1 | 43.2 | 64.5 | 2 Cen | |
| 45.9 | |||||||
| 2000Jun23 | 1720 | 3.94 | 35.0 | 68.5 | 2 Cen | ||
| 2001Jun11 | 2073 | 4.88 | 34.5 | 36.0 | 41.7 | 65.3 | Lyn, 2 Cen |
| 39.4 | |||||||
| 2003May12 | 2772 | 6.66 | 40.6 | 44.2 | 2 Cen | ||
| 2004May28 | 3154 | 7.56 | 39.1 | 41.5 | 65.7 | 2 Cen | |
| 41.4 | |||||||
| 2005May26 | 3516 | 8.55 | 38.4 | 43.8 | 2 Cen |
| Date | JD | UDJ 1.24 | UDH 1.65 | UDK 2.26 | UDL 3.08 | Calibrators | |
|---|---|---|---|---|---|---|---|
| -2450000 | [mas] | [mas] | [mas] | [mas] | |||
| 1998Jun04 | 970 0 | 0.59 | 21.3 | 19.5 | 23.0 | 45.6 | Sge |
| 1998Sep29 | 1056 | 0.87 | 21.2 | 26.1 | 46.0 | Sge | |
| 1999Jul29 | 1390 | 1.62 | 21.6 | 22.4 | 28.2 | 42.4 | Sge, Vega |
| 43.7 | |||||||
| 2000Jun23 | 1720 | 2.48 | 23.1 | 25.1 | 39.5 | Sge, Cyg | |
| 24.9 | 41.0 | ||||||
| 2001Jun11 | 2073 | 3.36 | 25.4 | 26.4 | 30.4 | 45.5 | Sge |
| 2002Jul23 | 2479 | 4.36 | 28.5 | 27.5 | 29.6 | 44.3 | Sge |
| 2003May12 | 2772 | 5.07 | 28.1 | 42.1 | 46.5 | Cyg | |
| 2004May28 | 3154 | 6.01 | 24.7 | 33.8 | 53.1 | Vega | |
| 2004Sep23 | 3262 | 6.31 | 24.8 | 26.7 | 33.0 | 50.5 | Sge |
| Date | JD | UDJ 1.24 | UDH 1.65 | UDK 2.26 | UDL 3.08 | Calibrators | |
|---|---|---|---|---|---|---|---|
| -2450000 | [mas] | [mas] | [mas] | [mas] | |||
| 1997Jan29 | 478 | 0.70 | 26.2 | 26.0 | 40.0 | Oph | |
| 1999Jan05 | 1184 | 2.56 | 24.3 | Hya | |||
| 27.7 | |||||||
| 27.4 | |||||||
| 24.0 | |||||||
| 1999Feb05 | 1213 | 2.64 | 30.0 | Hya | |||
| 1999Apr25 | 1295 | 2.86 | 24.1 | 28.0 | 2 Cen | ||
| 2000Jan25 | 1570 | 3.58 | 31.0 | 2 Cen | |||
| 2003May28 | 2772 | 6.74 | 27.2 | 2 Cen |
2.2 Extraction of Visibilities
The procedures for extracting the visibility amplitudes, as well as
engineering and performance details, are documented in
Monnier (1999) and Tuthill et al. (2000b), while recent scientific applications
of the data pipeline can be found in Monnier et al. (2002) and Tuthill et al. (2002).
In principle, the pupil geometry of the telescope mimics the operation of a separate-element
interferometer array, and the data collection and analysis are similar to standard methods for interferometry
experiments such as speckle imaging.
The short-exposure images are dark-subtracted, flat-fielded and cleaned of pattern noise.
Power spectra are then computed frame by frame as the squared modulus of the Fourier transform.
Stellar fringes appear as discrete peaks in such power spectra, with the origin occupied by a peak
whose height is proportional to the squared flux in the frame.
Squared visibilities are found by dividing the power at the spatial frequency of the fringes by
that at the origin and then normalizing with the corresponding signal from the calibrator spectrum.
The uncertainty associated with the squared visibilities is derived from the scatter in each ensemble of
100 exposures.
2.3 Seeing Correction
For all baselines and for all target and calibrator stars considered in this paper, the dominant noise sources were seeing and windshake (wind-induced telescope wobble). When the atmospheric conditions vary between observing the source and its calibrator, the overall ratio changes between the fringe power and the total flux on the detector. As clarified by Monnier et al. (2004), for aperture-masking data this change is nearly constant as a function of baseline for baselines longer than the coherence length ( 0.5 m at K 2.26 band). This means the visibility function will approach a non-unity value at short baselines. We took the visibility at the origin to be a free parameter in our studies, an assumption that does not affect our fitting procedures as long as there is no significant flux coming from over-resolved structures ( 0”.5). Seeing and windshake also lowered the mean visibility V and increased its variance on each baseline. However, the quantity was independent of the stellar brightness and the degree to which it was resolved by the baseline in question, only depending on seeing and windshake. We partially corrected for the effects of seeing and windshake using the method described by Ireland (2006), which entails empirically fitting a function of the form to individual star observations and correcting visibilities for each target and calibrator star prior to dividing the target with calibrator visibilities. We used a conservative value for of 0.8 (which may have under-corrected for the effects of seeing and windshake) and smoothed the function in the plane in order to minimise errors in applying this correction (for further details see Ireland 2006). We evaluated the effectiveness of this correction by comparing the calibrated visibilities of unresolved stars with and without seeing correction, which turned out to improve the calibration process. The apparent angular diameters were closer to the true values after the seeing/windshake correction on of the stars examined (see Figure 1). Only on 3 object observations with very bad windshake did the algorithm cause a marginal worsening of the miscalibration (5 mas).

Figure 2 shows typical data obtained from the masking experiment. The targets were seldom fully resolved, making image reconstruction only possible for those objects with the largest angular diameters (e.g. W Hya). These results will be presented in a subsequent paper. The two dimensional visibilities showed no significant deviation from circular symmetry (except for W Hya), possibly due to the lack of high spatial frequencies sampled by our 10 m baselines. Since W Hya’s deviation from circular symmetry is smaller than the UD angular diameter error, we made the assumption that all the stars are spherical and the data were azimuthally averaged.
To keep the representation of the data homogeneous, our quantitative analysis is based on fitting simple uniform disk (UD) models to the azimuthally averaged Fourier data. We concentrate on the four filters which provide most of the temporal coverage in our observations, namely L 3.08, K 2.26, H 1.65 and J 1.24, considering the other filters only in Section 4.1. Here, e.g., L 3.08 indicates that the filter covers a sub-interval of the L bandpass of the conventional UBV filter system and is centered at 3.08 m (Table 2). Note that the K 2.26 bandpass encompasses two very similar filters, both centered at 2.26 m with slightly different bandwidths.


Calibrator stars nearby in the sky and measured interleaved with the target observation are used to estimate the system transfer function, a standard practise in interferometry described in detail by Millan-Gabet et al. (2005),
The visibility amplitude was calibrated by dividing the target visibilities by the calibrator star visibilities, after first correcting for the estimated sizes of the calibrators (Table 2.1).
2.4 Uniform Disk diameters
Although the true stellar intensity profile is not a UD, fitting the observed visibilities with this simple profile still provides a useful estimate of the apparent size of the target. Our longest baseline was just under 10 m, and so we are resolving low-resolution structure in the target star’s intensity profile. This makes it difficult to differentiate between a UD, a fully-darkened disk, a Gaussian or a more complex intensity distribution. We chose UD diameters to allow comparison of findings with existing literature and to avoid the difficulties encountered when deriving more sophisticated diameters (cf. Hofmann et al. 1998;Scholz 2003). If the “true” intensity distribution is known, or a predicted model distribution is to be compared with the data, different radius definitions can be easily converted from and to a UD radius.
In various stars, the J 1.24-band curves show some deviation from the UD model at around rad-1, which could indicate the presence of dust causing scattering in the outer layers, leading to a smaller ”true” photospheric diameter (see Figure 2) than derived with a simple UD model fit. In addition, due to their larger angular diameters (especially in the L 3.08 filter), W Hya and possibly Cet were also resolved enough to detect further deviations of the intensity distribution from the simple UD shape to be compared with model predictions. They are also possible targets for imaging after recovering the closure-phase information in addition to the Fourier amplitudes. These comparisons with more complex models and interpretations will be addressed in a future paper.
2.5 Estimation of Seeing Miscalibration
Given that the seeing correction described in Section 2.3 leaves some residual error and
assuming that the dominant error term is the uncertainty introduced by variations in the seeing between measurements of targets and calibrators,
we undertook a separate study which assessed the robustness and repeatability of the calibration process to seeing-induced miscalibration.
If the seeing remains constant, then calibrating (i.e., dividing) the visibility function from successive datasets taken on the same object
should yield the visibility function of a point source (i.e V).
In the case of changing atmospheric conditions, considerable differences in the transfer function can appear between consecutive datasets.
The error induced by such fluctuations can be measured from observations of a single object
(either target or calibrator) taken through the same filter at different times during one night.
Once again, we chose to fit a UD model to the data, a natural candidate to fit the error introduced by the change in seeing throughout one observing night.
This allows us to estimate atmospheric uncertainties by applying the same fitting procedure as was used for the rest of our data,
reducing the risk of biases introduced by the fitting method.
Asymmetric errors were calculated by calibrating the target with a UD of the derived diameter. These errors pertain to the respective filters, and if no object was observed twice in one night in the same band, the maximum global error is assumed.
The data in Figure 2 demonstrate another well known problem: that of calibration near the so-called seeing spike. Note how the azimuthally averaged visibility points at short baselines can deviate considerably from the otherwise uniform shape of the visibility curve. As the calibration of these large fluctuations at low spatial frequencies is highly challenging, we fitted our models only to the spatial frequencies in Fourier space corresponding to baselines of 2m or more.
2.6 NIR photometry
In the course of the data reduction, we extracted the total received flux for both science objects and calibrators. With this we were able to retrieve contemporaneous photometry data in the the same bands as our angular diameter measurements. These measurements complement the photometry by Whitelock et al. (2000), which does not cover our full range of observations, and provide a powerful tool to monitor NIR light-curves. The small differences between the Whitelock et al. (2000) photometry and our measurements can be attributed to our use of filters of differing bandpass and center wavelength(see Table 2).
3 Results
3.1 Light-curves
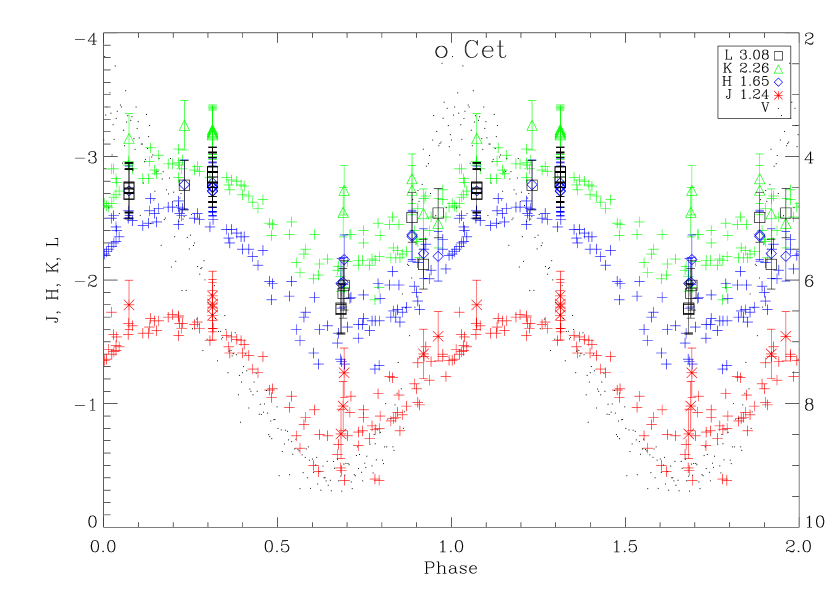
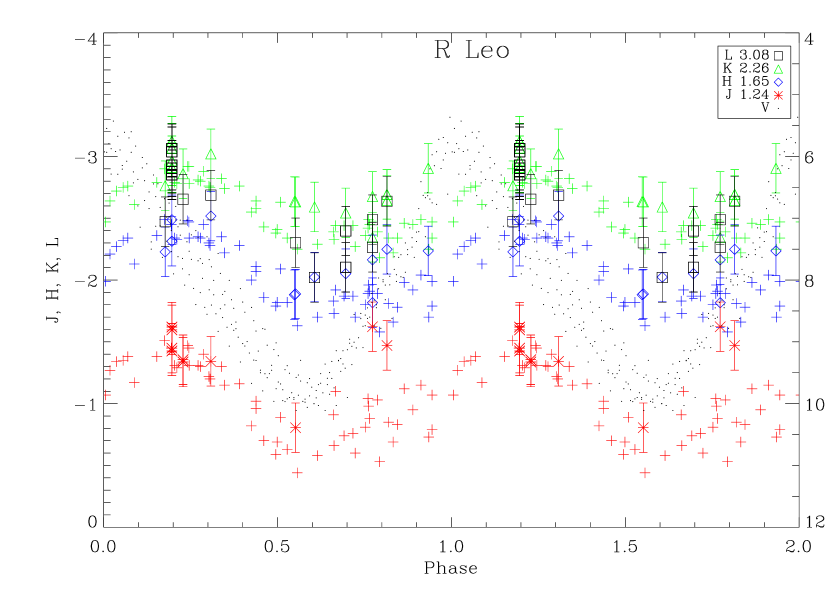
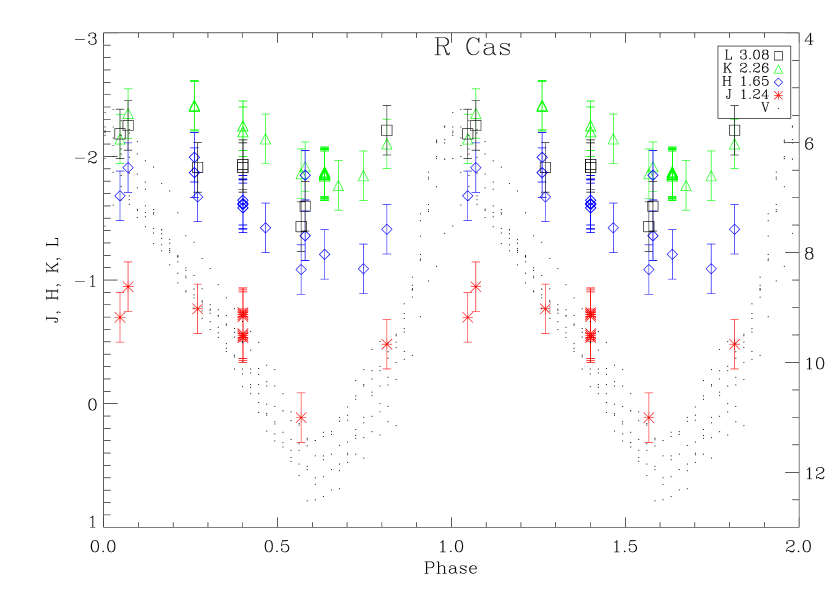
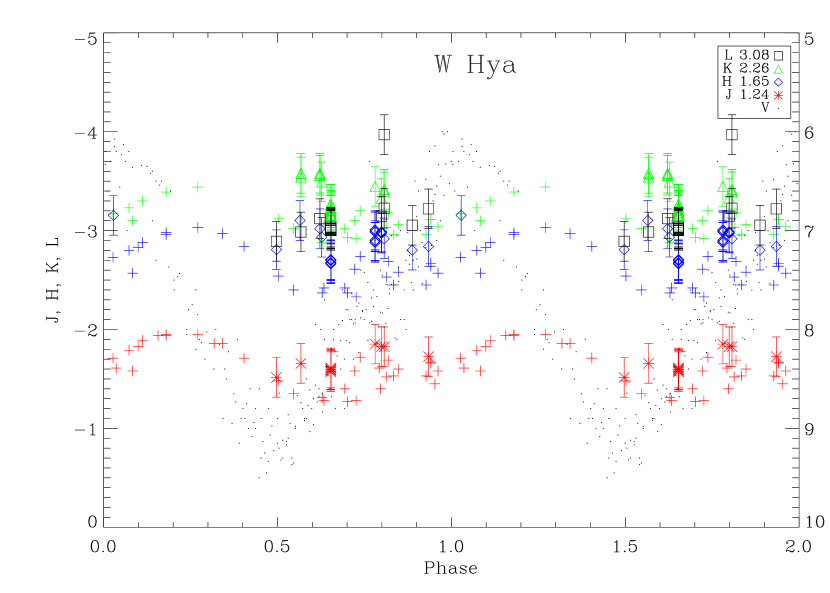
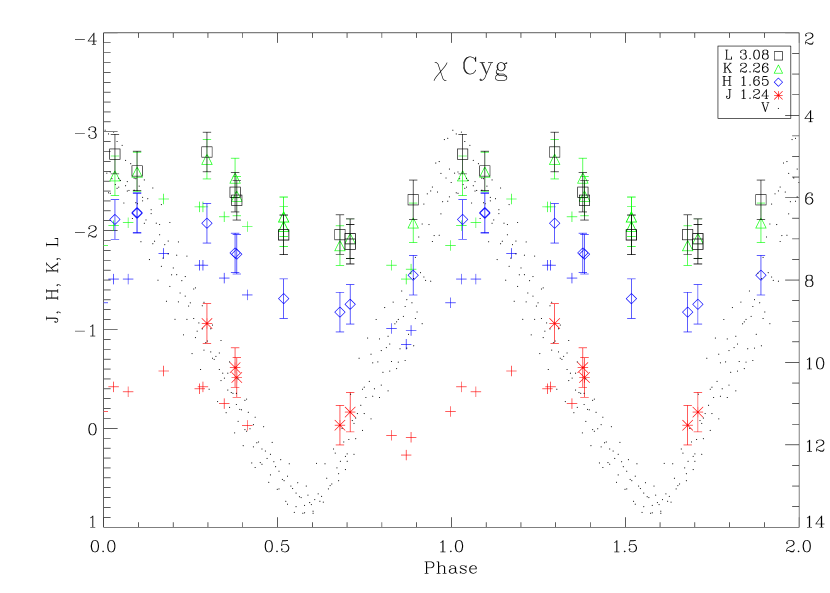
Figure 3 shows our NIR photometry plotted as a function of pulsation phase, together with the photometry
of Whitelock et al. (2000) and AAVSO visual photometry (A.A. Henden et al. 2006, private communication).
As an approximation based on the appearance of the light curves, we fitted our NIR photometry data with simple sinusoidal functions (not shown in the figures),
with the exception of R Hya, where the light curve was too incomplete.
Although these fits are only approximations, they provide a useful tool to examine the dates of maxima and minima as a function of wavelength.
The NIR magnitude vs. phase curves are certainly not strictly sinusoidal,
but depending on the star and the bandpass they can be approximated by a sine function.
Our photometry shows a small lag of up to 0.07 cycles in the maxima of light curves from the J 1.24 to the H 1.65 and from the H 1.65 to the K 2.26 filters,
as well as less pronounced or non-existing lags near visual minimum,
confirming the findings of Smith et al. (2002), as can be seen in Figure 3.
The reported phase shift of with which the NIR maxima lag behind
visual maxima typical for M-type Miras (Nadzhip et al. 2001, Smith et al. 2002) is also clearly seen in our data.
Also in accordance with the findings of Smith et al. (2002), we find that the maxima in longer wavelengths (i.e. in the band)
occur before the maxima but after the visual maxima for all of our objects except for W Hya, where the light curve is too peculiar
to be fitted with a sine function.
Both Visible and NIR lightcurves given in Figure 3 span the observation period of each object and clearly illustrate the substantial differences between the cycle amplitudes and pulsation periods.
3.2 Multi-wavelength, multi-epoch UD angular diameters
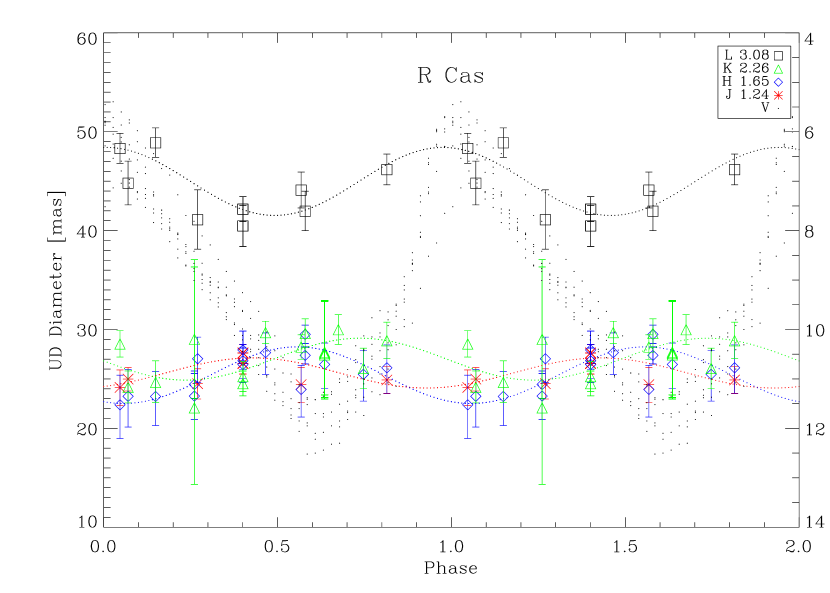
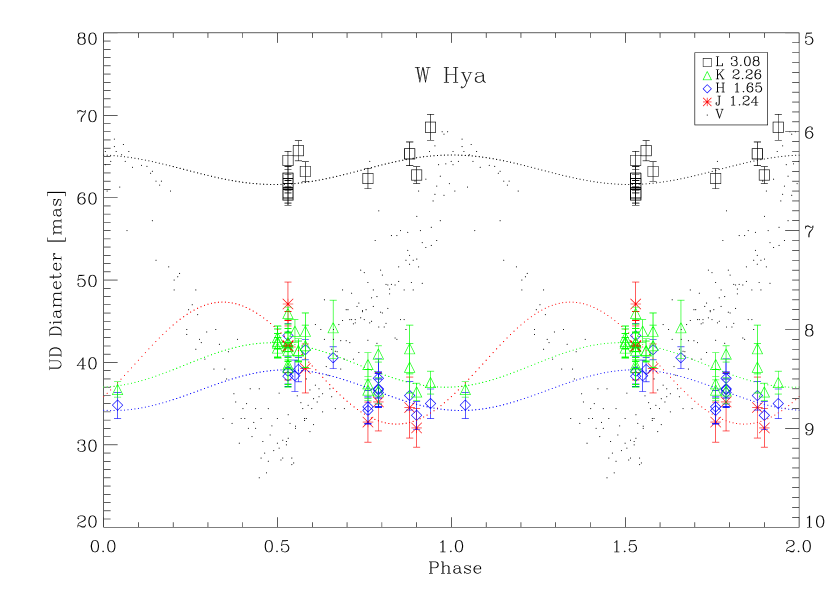
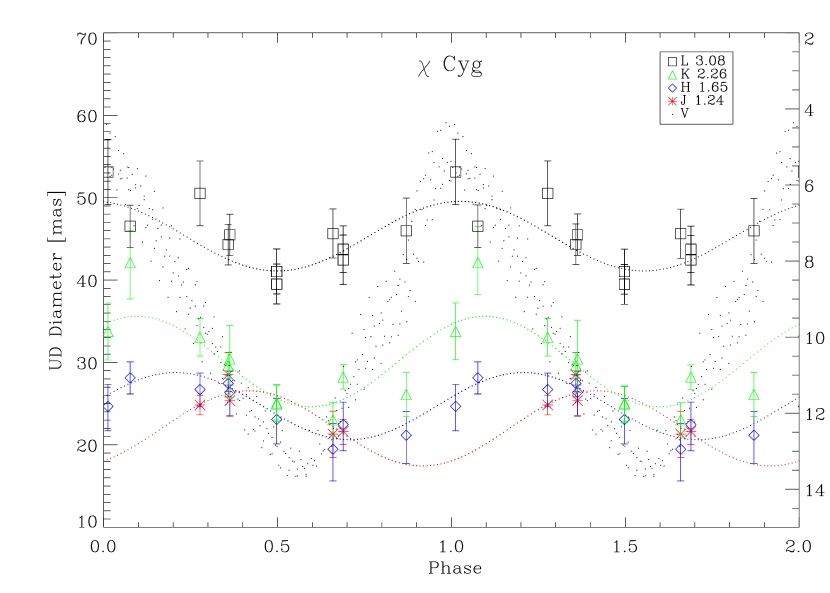
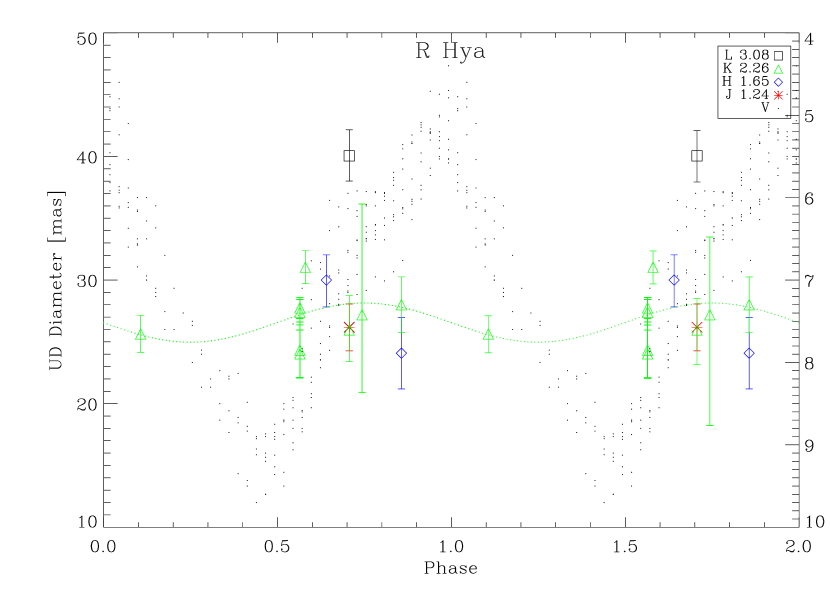
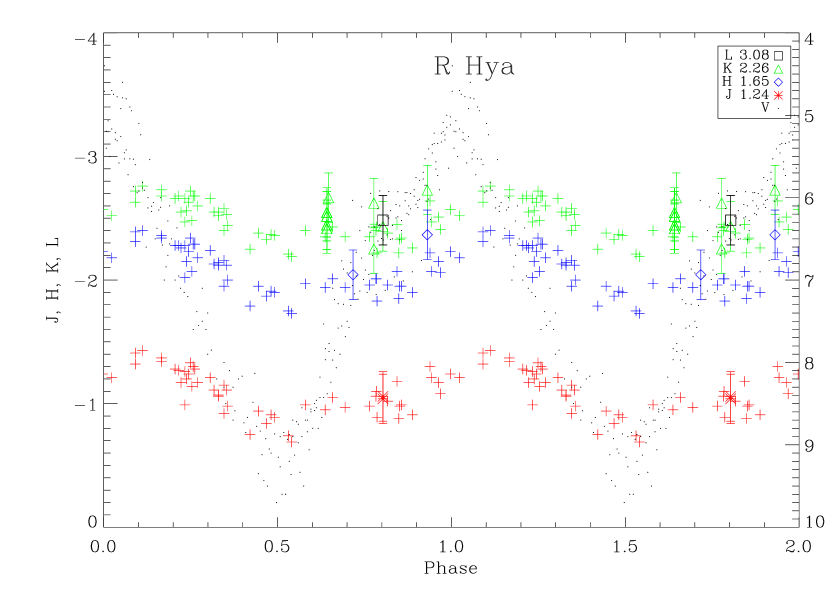
Figures 4 to 6 show the UD angular diameters of the sample of Miras at various
visual phases (see Tables 4 to 9), folded with phase, together with visual photometry data from the AAVSO (A.A. Henden et al. 2006, private communication).
Near-infrared pulsations of Mira stars have been observed interferometrically before, e.g. by Tuthill et al. (1995); Perrin et al. (1999);
Young et al. (2000); Thompson et al. (2002); Woodruff et al. (2004); Fedele et al. (2005);Ragland et al. (2006), though never with the wavelength, phase and cycle coverage of this study.
We have detected diameter variations for all Miras in this study.
As discussed for the light-curves in Section 3.1, the physical diameter vs. phase curves are certainly not strictly sinusoidal.
Nonetheless, a sinusoidal shape of the curve can be observed, and although not perfect, the sine curves fitted to the data have been included to guide the eye.
With the extensive coverage of phases and cycles in four filter bandpasses,
it becomes possible to probe the stellar atmosphere both for geometric pulsation of the continuum forming layers (the so-called photosphere),
and for contamination of the continuum by molecular blanketing.
This allows us to further constrain existing theoretical models and to make more sophisticated demands on future models.
R Hya will be exempt from further discussion as the data sampling is too sparse (see Figure 6, lower panel).
4 Discussion
4.1 Effects of Molecular Absorption on Multi-wavelength Diameter Observations
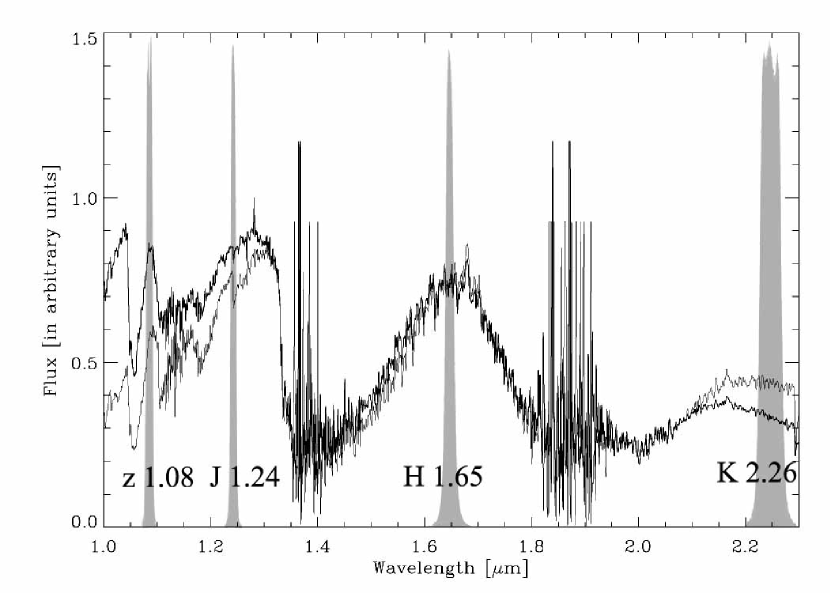
Figure 7 shows the NIR spectrum of a Mira (R Cha) at two different pulsation phases, with the position and shape of the z 1.08, J 1.24, H 1.65 and K 2.26 filters,
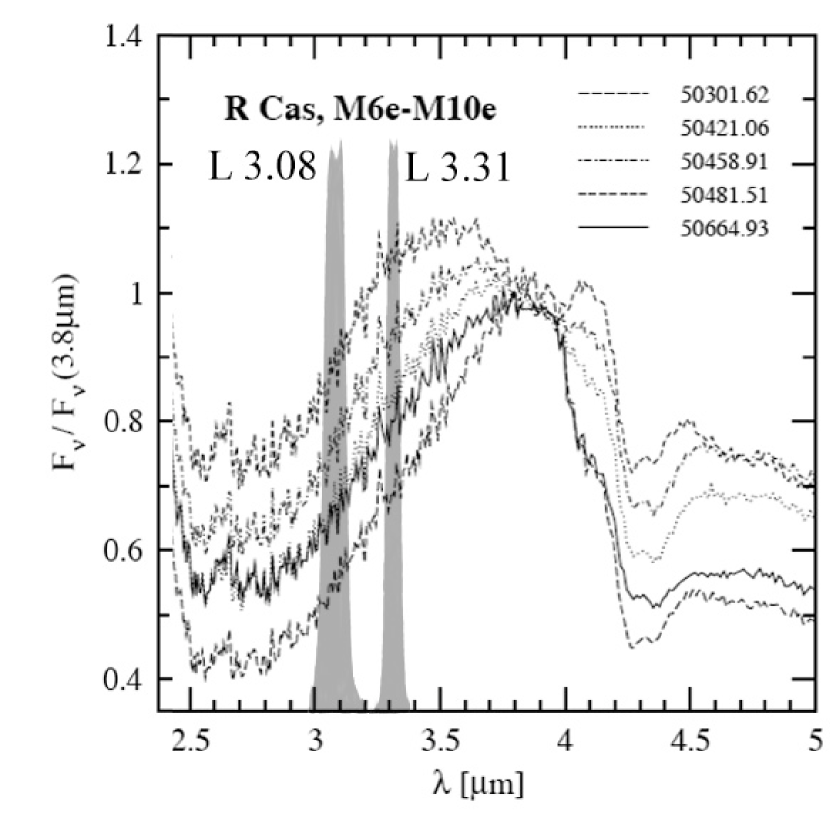
and Figure 8 shows the ISO spectrum of R Cas, with the position and shape of the L 3.08 and L 3.31 filters.
The narrow band filters J 1.24 and H 1.65 should show little molecular contamination by absorption bands, i.e. they are close to sampling the
continuum-forming layers (see, e.g., Tej et al. 2003), whereas the contamination effect should be more prominent in the
K 2.26 and in particular in the -band filters (see, e.g., Jacob & Scholz 2002; Mennesson et al. 2002; Ireland et al. 2004a, b).
Within the L band, our filters (L 3.08 and L 3.31) sample portions with different molecular absorption lines,
originating mainly from H2O (but also from OH and SiO, Mennesson et al. 2002) in Mira atmospheres.
The L 3.08 bandpass lies deeper in the absorption feature than the L 3.31 bandpass.
The photons seen through the L 3.08 filter should therefore originate from cooler strata that lie higher in the stellar atmosphere than the L 3.31 photons.
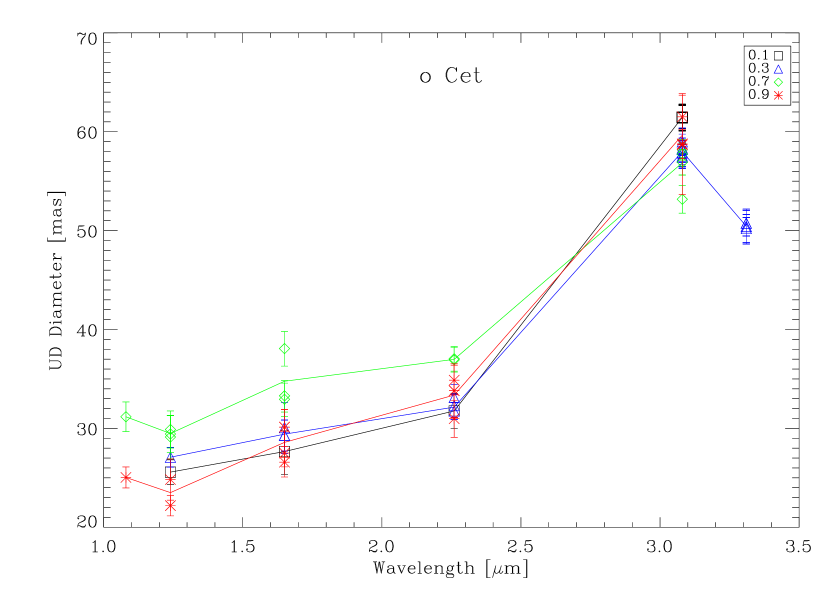
Figure 9 shows the diameter vs. wavelength relationship for Cet at four different phases. It clearly shows the effect of varying absorption features on the perceived diameter. As our filters coincidentally sample more opaque (contaminated) layers with increasing wavelength, there is a perceived diameter increase as a function of wavelength, with the exception of the J 1.24 and L 3.31 filters, which lie further out of the molecular absorption bands sampled by the z 1.08 and L 3.08 filters, respectively. This increase of diameter with wavelength is obvious throughout the pulsation cycle for Cet, all other Miras showing excursions from the J 1.24 H 1.65 K 2.26 diameter trend at some phases. In particular R Leo seems to show a much more complex layering (see Section 10 with Figure 4). All stars in our sample show a large (%) increase in UD diameter between the K 2.26 filter and the L 3.08 filter, first noted in the case of R Aqr by Tuthill et al. (2000a). This increase indicates that the L 3.08 filter samples a molecular layer at a considerable distance from the photosphere. The distance between the layers varies with phase and will be further discussed for each object individually, as it differs greatly from star to star.
4.2 Phase dependence of Multi-wavelength Near-Infrared Diameters
The distinction between true photospheric pulsation, i.e. the upward and downward motion of the continuum forming layers,
and the effects of molecular blanketing is not trivial to unravel, even with high angular resolution data.
The varying molecular opacity is dictated by density changes as a shock front travels through the stellar atmosphere and temperature
changes due to variations in the radiation field, causing molecules to dissociate and re-form (cf. Scholz 2003 and references therein).
These more or less opaque strata which vary with the pulsation phase (and between cycles) can make it difficult to derive the near-UD
diameter of the underlying geometrically pulsating continuum layer, veiling the geometric amplitude and the phase of pulsation.
As the brightness distributions of Miras are more complex than simple UDs,
changes in molecular opacities of different layers may be capable of mimicking changes in our derived diameters,
complicating the interpretation of our data.
The behaviour of the S-type Mira Cyg differs from the other Miras in our sample in various respects and will be discussed separately.
Of the three filters within the bands, the atmospheric opacity reaches its highest values in the contaminated
(albeit less contaminated than the standard bandpass) filter K 2.26
throughout most of the pulsation cycle, as evidenced in Figures 4-6 by the large angular diameters.
This increased molecular opacity has been predicted by various models (e.g. Jacob & Scholz 2002; Ireland et al. 2004a, b; Ireland & Scholz 2006) and has been observed by, e.g., Millan-Gabet et al. (2005).
A diagnostic observable from our data which is more robust against sources of systematic errors (e.g. change in seeing, wind induced wobble of the telescope, calibrator characteristics)
is the relative diameter variation.
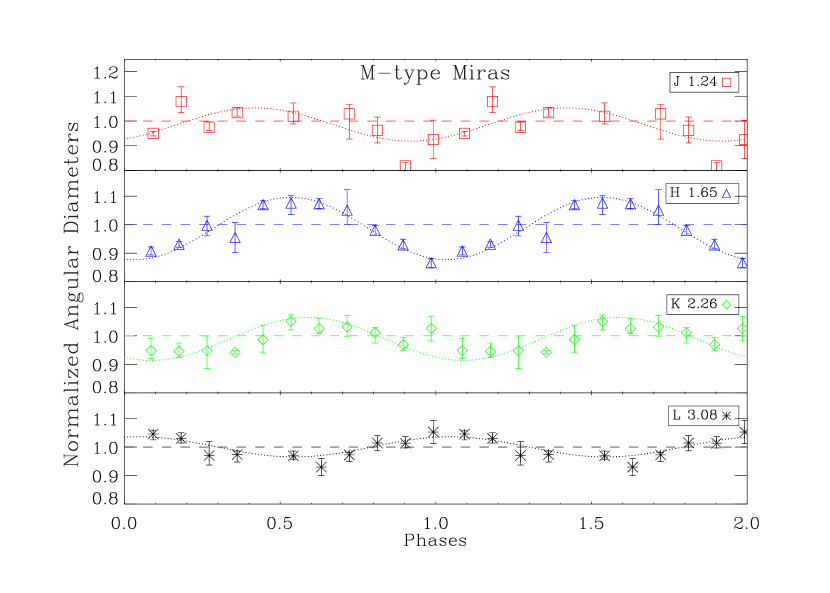
Figure 10 shows the relative UD diameter variation as a function of phase for the 5 M-type Miras in this study, averaged into phase bins.
The relative UD diameters were obtained by dividing each object’s measured angular diameters by its mean,
and the errors are representative of the scatter within each phase bin.
The data illustrate the homogeneity within this sample of Miras, and allow us to investigate systematic
differences between the observed bandpasses.
In order to extract phase offsets and relative pulsation amplitudes in each filter, we fitted sinusoid cycloids to the combined data,
without implying that the objects vary in such a simple fashion.
The ensemble shows a systematic phase-shift of the relative UD diameter variation with wavelength, not unlike the trend reported for the light-curves in section 3.1. The J 1.24, H 1.65, and K 2.26 UD diameters reach their minimum at approximately phases 0.9, 1.0, and 1.1 respectively. The L 3.08 bandpass diameters behaves differently, and will be examined in more detail at the end of this section. This disagrees with theoretical model predictions by Ireland et al. (2004a, b), where the diameter minimum should occur at roughly phases 0.7-0.8 for all bandpasses, but is comparable to the findings of Thompson et al. (2002), who followed the M-type Mira S Lac through its pulsation cycle in various sub-filters of the band. Using the sample as a single “artificial” Mira also allows us to verify the relative diameter pulsation amplitude for S Lac of Thompson et al. (2002), who report a 12%-21% peak-to-peak sinusoid amplitude in the -band, with our value of 14% peak-to-peak pulsation in the K 2.26-band. The peak-to-peak sinusoidal pulsation amplitudes for the J 1.24, H 1.65 and L 3.08 bandpasses are 14%, 22% and 6% respectively, also disagrees with theoretical models which predict much higher amplitudes (cf. Ireland et al. 2004a, b).
According to current models (e.g. Ireland et al. 2004a, b), more contaminated layers (such as the ones sampled by the K 2.26 and L 3.08 bandpasses)
should experience slightly greater diameter pulsation amplitudes.
This trend cannot be seen in our observations: the layer experiencing the greatest diameter pulsation is the less contaminated H 1.65 layer.
Explanations for this could be:
(i) The relatively narrow width of our K 2.26 filter compared to the standard filter used in the models,
combined with the position of our central wavelength in a possible minimum of molecular contamination as reported by Thompson et al. (2002).
(ii) A periodic change of optical depth of a layer, offset in phase to the photospheric pulsation, could result in large variations of the observed pulsation amplitude.
(iii) The assumed spherical symmetry could be significantly violated in the outer, more contaminated, layers (cf. Ragland et al. 2006 and references therein), effectively causing departures from model predictions
(cf., e.g., Hofmann et al. 2000;Ireland et al. 2004c).
(iv) The theoretical models need revision to accommodate for these observations.
Higher molecular opacity can be expected at near-minimum phases, when the outer layers are cooler and more molecules are formed (see, e.g., Ireland et al. 2004a, b).
For our sample stars (with the exception of Cyg), the maximum apparent UD angular diameter values are typically found near minimum visual phase,
supporting existing model interpretations.
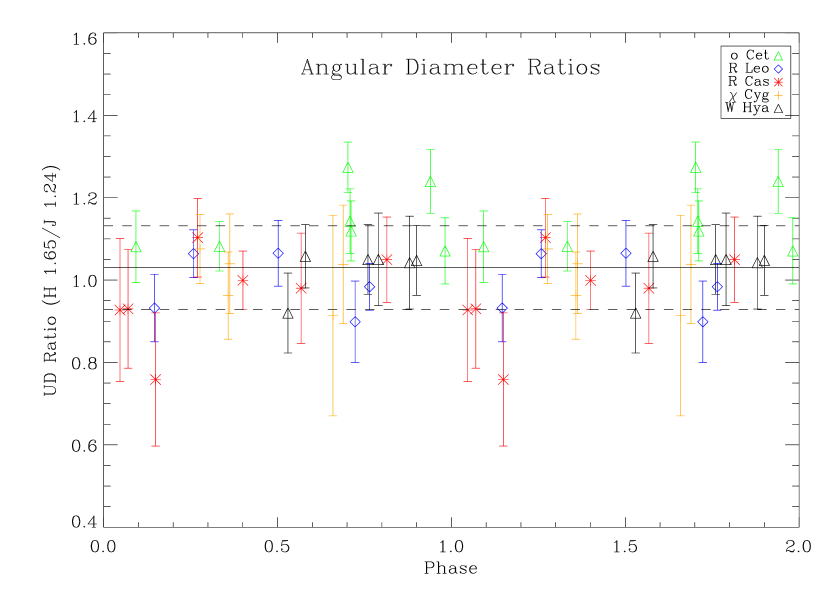
A diagnostic observable from our data which is more robust against sources of systematic errors (e.g. change in seeing, wind induced wobble of the telescope, calibrator characteristics) are the relative diameter ratios. Figure 11 shows the UD diameter ratio between the different filters for all our sample stars plotted vs. phase. There is no obvious dependence on pulsation phase of the H 1.65/J 1.24 quotient, though there is noteworthy scatter for our sample of 5 Miras (R Hya was never observed simultaneously in both filters) that might mask a minor phase effect . The mean value of this diameter ratio is
| (1) |
which agrees, to within errors, with the value of reported by Millan-Gabet et al. (2005). The lack of a phase dependent signature indicates a closeness in temperature and opacity variations, as can also be derived from the closeness in phase and pulsation amplitude seen in Figure 10. The diameter ratio close to unity shows the geometric closeness of the two layers.
Note that of all stars, Cet is the only one that has a ratio that includes some phase dependent effects and is slightly smaller than unity.
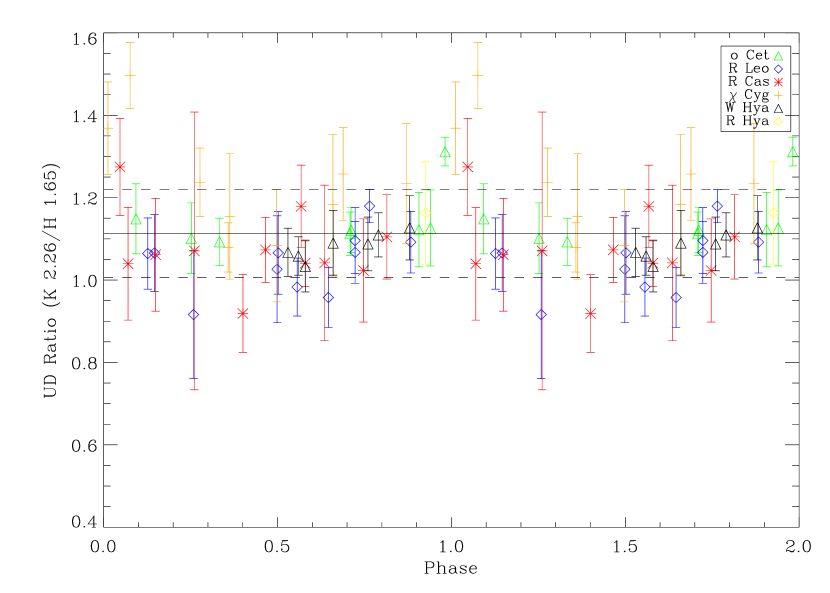
The ratio between the K 2.26 and H 1.65 filters has a more pronounced pulsation phase signature (see Figure 11, center panel), which reflects more complex and disjoint temperature and opacity changes between these two layers. The ratio reaches its minimum (i.e. H 1.65 UD K 2.26 UD) before minimum light and its maximum at maximum light. In order to compare our data with the observations of Millan-Gabet et al. (2005), we also calculated the mean diameter ratio to be
| (2) |
a mean ratio marginally larger that the H 1.65/J 1.24 mean ratio.
Again, our data agree, to within errors, with the value of reported by Millan-Gabet et al. (2005).
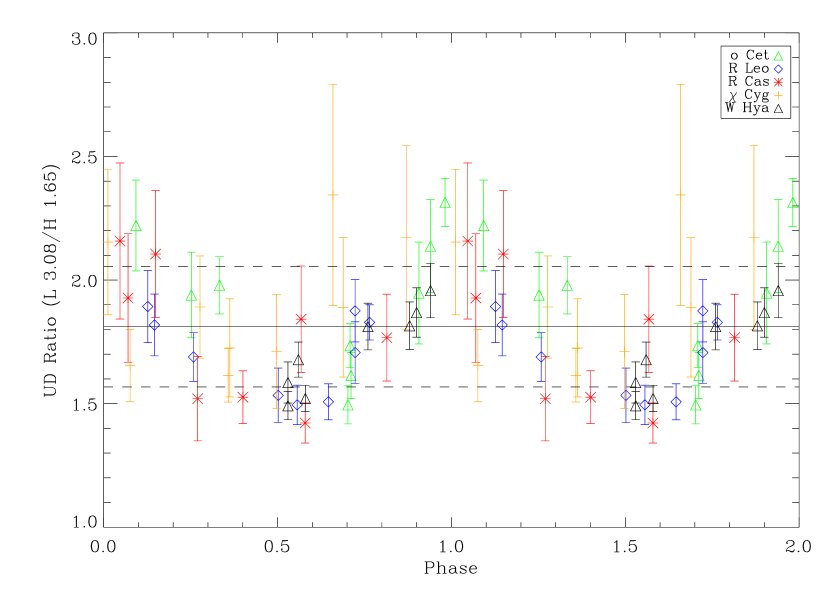
As mentioned earlier, the L 3.08 angular diameter behaves differently. It reaches minimum values at minimum light and the best fit to the diameter pulsation is shifted by 0.5 cycle compared with the H 1.65 pulsation, albeit at a much smaller relative pulsation amplitude. As the lower panel of Figure 11 shows, this phase shift and the UD diameter ratio between the two layers seems to be similar for all Miras in our sample (including Cyg). For consistency sake, we calculated the mean diameter ratio to be
| (3) |
This unusual UD diameter variation has never been observed before and raises questions about the mechanism of the observed pulsation in the L 3.08 layer. The L 3.08 light-curve follows a similar trend to the light-curves, possibly indicating a temperature devolution similar to the lower layers, and as the inner layers of the star are shrinking and heating up, the outer layers are either expanding or becoming increasingly opaque. Whether opacity effects or dynamic motion of these outer layers (or both) are responsible for this surprising behaviour is the subject for model interpretations and will be the subject of a subsequent study.
4.3 Individual Stars
Of the 6 Miras observed, 4 have observational phase coverage suitable for further comparisons with pulsation models ( Cet, R Leo, R Cas and Cyg). The Miras studied differ substantially in behaviour regarding pulsation amplitudes, diameter-wavelength relationships and diameter-phase relationships
In this section we discuss the results of this study for each individual star, emphasising the main differences and similarities found in this subset.
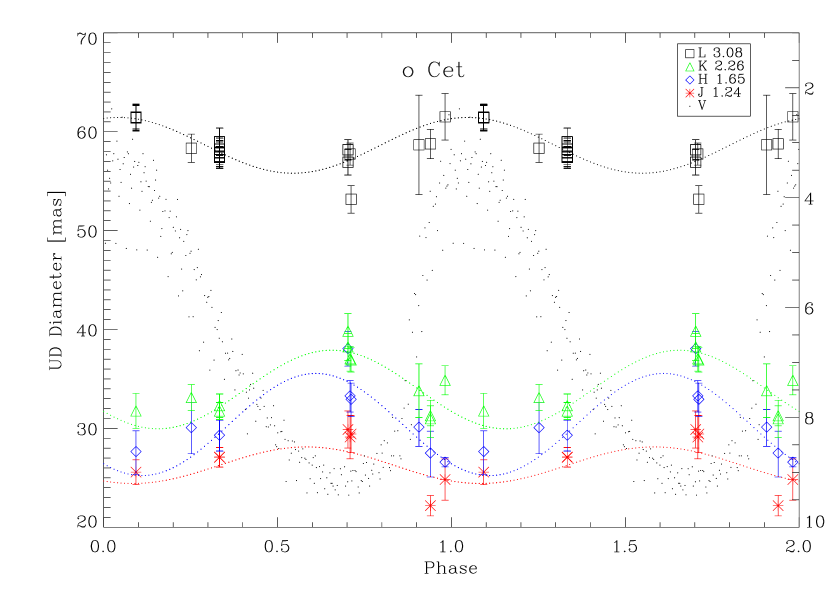
Cet
The prototype of Mira stars is one of the most observed variable stars,
due to its brightness, amplitude (V, A.A. Henden et al. 2006, private communication) and closeness ( pc, Knapp et al. 2003).
Its size in different bandwidths (e.g. Haniff et al. 1995;Mennesson et al. 2002;Woodruff et al. 2004), optical spectra (Joy 1954),
lightcurves in different colors (e.g. Whitelock et al. 2000; Nadzhip et al. 2001; AAVSO),
asymmetries (e.g. Karovska et al. 1991, Tuthill et al. 1999), and companion star (e.g. Karovska et al. 1997;Wood & Karovska 2006;Ireland et al. 2007) have been subject to intense research.
Figure 4 shows the UD diameter variation in the J 1.24, H 1.65 and K 2.26 bandpasses
as nearly synchronous (within the 0.1 phase shift shown in Figure 10), sinusoidal pulsations, with an apparent phase shift to the diameter pulsation in the L 3.08 bandpass.
The UD diameter vs. phase curves agree well with the fitted sine functions, with reduced for
J 1.24, H 1.65, K 2.26 and L 3.08 having the values 1.45, 1.17, 1.02 and 0.80 respectively.
The shift of cycles between the sine curves fitted to the diameter vs. phase in the H 1.65 and the L 3.08 bandpasses
has never been observed nor predicted, and can also be observed in R Leo, R Cas and W Hya.
A similar shift, though not as pronounced, can be seen in Cyg
The UD diameters vary between and mas () in the J 1.24 bandpass,
and between and mas () in the L 3.08 bandbass.
The K 2.26 UD angular diameter values lie in the range of mas near V-maximum and mas at phase 0.7.
These values agree with the interferometric UD diameters within the K-band of Ridgway et al. (1992) (phase 0.8)
and Woodruff et al. (2004) (phases 0.1-0.4, see Table 10).
Our UD angular diameters are generally larger than those measured by Mennesson et al. (2002) (phases 0.9-0.0).
This is most likely due to to the larger spatial frequencies (i.e. longer baselines) at which their measurements where made,
combined with the known departure of Cet’s brightness distribution from UD (cf. Woodruff et al. 2004).
Our K 2.26 UD diameters are also larger than the molecular layer diameters obtained by
Perrin et al. (2004) (24.95 to mas) at similar phases by fitting ad hoc
scenarios (a photosphere surrounded by an emissive and absorbing layer) to and interferometric data.
This is to be expected, as their visibilities also show obvious departures from simple models, and fitting the same data to a brightness distribution
consisting of a central object with a bright molecular shell would yield smaller diameters than a UD fit.
Note that these very simple scenarios are not always unique and a new ad hoc parameter set has to be determined for each observation,
making a comparison awkward.
Cet shows little cycle-to-cycle variation throughout our data, although this could be attributed to the observing of a stable
era of its pulsation, and might have been different if observed, e.g., 10 years earlier.
| Star | Reference | Angular | Centre Wavelength | Bandwidth | Visual |
|---|---|---|---|---|---|
| Diameter [mas] | [m] | [m] | Phase | ||
| Cet | Ridgway et al. (1992) | 36.1 | 2.2 | 0.4 | 0.8 |
| Mennesson et al. (2002) | 28.79 | 2.2 | 0.44 | 0.9 | |
| 25.73 | 2.03 | 0.0 | |||
| 25.13 | 2.15 | 0.0 | |||
| 25.19 | 2.22 | 0.0 | |||
| 29.22 | 2.39 | 0.0 | |||
| 24.400.11 | 2.16 | 0.32 | 0.0 | ||
| Woodruff et al. (2004) | 29.240.30 | 2.2 | 0.4 | 0.1 | |
| 29.530.30 | 2.2 | 0.4 | 0.2 | ||
| 30.490.30 | 2.2 | 0.4 | 0.3 | ||
| 33.270.33 | 2.2 | 0.4 | 0.4 | ||
| R Leo | di Giacomo et al. (1991) **obtained by lunar occultation | 33.0 | 2.16 | 0.03 | 0.2 |
| Perrin et al. (1999) | 28.18 | 2.16 | 0.32 | 0.2 | |
| 30.68 | 2.16 | 0.32 | 0.3 | ||
| Tej et al. (1999) **obtained by lunar occultation | 34 | 2.36 | 0.46 | 0.4 | |
| Monnier et al. (2004) | 30.3 | 2.26&2.16 | 0.05&0.32 | 0.6-0.7 | |
| Millan-Gabet et al. (2005) | 29.91 | 2.16 | 0.32 | 0.4 | |
| Fedele et al. (2005) | 28.1 | 2.2 | 0.4 | 0.1 | |
| 26.20.01 | 2.2 | 0.4 | 0.0 | ||
| R Cas | van Belle et al. (2002) | 22.03 | 2.2 | 0.4 | 0.8 |
| W Hya | Monnier et al. (2004) | 42.5 | 2.26&2.16 | 0.05&0.32 | 0.5 |
| Millan-Gabet et al. (2005) | 39.9 | 2.16 | 0.32 | 0.6 | |
| Cyg | Mennesson et al. (2002) | 23.24 | 2.16 | 0.32 | 0.38 |
| R Hya | Millan-Gabet et al. (2005) | 23.9 | 2.16 | 0.32 | 0.8 |
| 25.8 | 2.16 | 0.32 | 0.8 |
The L 3.08 K 2.26 H 1.65 J 1.24 layering of monochrome diameters is strictly monotonous, unlike, e.g., R Leo, where the sequence of UD diameters seems to invert during the pulsation cycle. The fact that Cet appears largest in the JHK filters approximately at visual phase 0.6, roughly coinciding with the minimum of the NIR and visual light curves (see Section 3.1) is in accordance with various model interpretations (e.g. Jacob & Scholz 2002;Ireland et al. 2004a, b;Ireland & Scholz 2006). The unusual behaviour of the L 3.08 layer, as described in Section 4.2, will be further discussed in Section 5 and in a follow on paper.
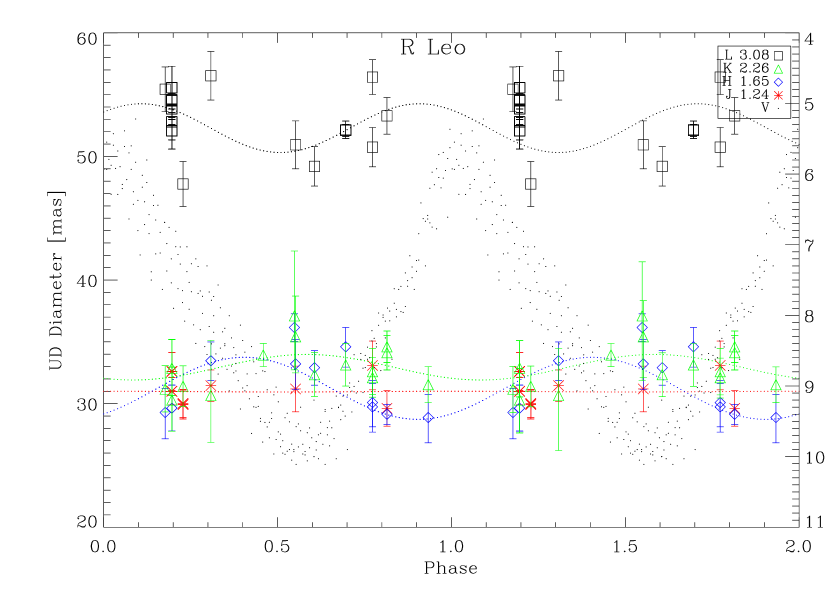
R Leo
Although R Leo has a similar period (310 days), V magnitude range (, Kholopov et al. 1998) and spectral type as Cet,we found significant differences in this study.
The pulsation amplitudes of layers in different bandpasses and their phases with respect to one another seem to show a more complex trend than Cet’s atmosphere.
The pulsation is less pronounced than Cet’s in the NIR, with UD diameters varying between and mas () in the J 1.24 bandpass,
which shows the largest relative pulsation amplitude.
The cycle-to-cycle variation in the diameter pulsation is significant in the K 2.26 bandpass (compared to, e.g., Cet).
Again, this effect could be due to mere coincidence, and only long term ( years) observation campaigns can ascertain this variability.
This makes it difficult to compare our UD diameter measurements with values found in the literature (see Table 10).
There is nonetheless an overall agreement with cited UD radii except for the long baseline UD angular diameters of Fedele et al. (2005).
This can be due to the same effect as described in Section Cet concerning the long baseline measurements of Mennesson et al. (2002).
With our H 1.65 measurements we are able to disambiguate the two possible solutions (due to ambiguous model fitting)
for the -band diameter found by Millan-Gabet et al. (2005).
Due to the seeming lack of cycle-to-cycle dependence in this bandpass, we can reject their smaller angular diameter of 23.8 mas at phase 0.4 and
substantiate their larger diameter of 32.4 mas
The variation between and mas () in the L 3.08 bandpass shows a steady increase in diameter
between 97Dec16 and 01Jun11 and no significant diameter change up to 3 pulsation cycles later.
This gradual increase in angular diameter over 4 cycles may be
understandable in terms of the non-cyclic time evolution of positions of outer
mass zones of pulsation models over several successive cycles (cf. Figures 1 of
Ireland et al. 2004a, b), which affect the position and physics of water shells.
This interpretation is supported by the steady brightening of the visual photometry maxima during the same 4 cycles in which the UD diameter
increases, indicating variability in timescales longer than the pulsation phase.
The pulsation signature of the L 3.08 bandpass shows nonetheless the general phase lag compared to the H 1.65 band, albeit with
a larger uncertainty in the least squares sinusoidal fit (reduced ).
R Cas
Of the two Miras with the longest periods in our sample, R Cas (430 days) also exhibits the latest spectral type. In fact, at minimum visual pulsation phase it defines the spectral type M10 (see Lockwood & Wing 1971).
It seems to follow the model-predicted phase-diameter trend of larger diameters around minimum light
in the H 1.65 filter, albeit with some cycle-to-cycle uncertainty. The scatter is considerably greater in the J 1.24 and K 2.26 filters,
but the same trend is still present.
Note that the relative phase shift of diameter maxima from shorter to longer wavelengths in is very distinctive,
even when the uncertainties introduced by cycle-to-cycle variations in the diameter pulsations are taken into account.
The position of the L 3.08 layer also follows the pattern of the other M-type Miras, in that it seems to pulsate with
a 0.5 phase shift to the H 1.65 layer.
van Belle et al. (2002) measured a UD angular diameter of 22.03 mas at phase 0.81, which
does not agree with our diameter of 28.9 at the same pulsation phase but agrees with the diameter measured at roughly the
same phase in a different cycle (26.1 at phase 0.74), another indicator of noticeable cycle-to-cycle variation.
W Hya
At a distance of 783 pc (Knapp et al. 2003), W Hya is the closet and best resolved Mira in our sample.
We observe a relatively time independent K 2.26 angular diameter of mas in the phase range .
Because of W Hya’s low declination and proximity to the ecliptic, and because the period is close to 1 year,
the phase coverage only spans half the pulsation cycle (see Table 7).
In this short time interval, covering only 0.44 phases, the J 1.24 diameter shrinks from 47.1 mas to mas, a 32% decrease, whereas the
H 1.65 diameter decreases by 22% and the K 2.26 diameter shows a decrease of 20%.
The previously measured UD angular diameters in the -band by Monnier et al. (2004) and Millan-Gabet et al. (2005) (see Table 10) are consistent
with our measurements. The -band diameter of Millan-Gabet et al. (2005) (31.3 mas) is slightly smaller than our derived H 1.65 UD angular diameters,
which is most likely due to the same effects of long baseline interferometry as described for Cet and R Leo.
Although all Mira intensity distributions show deviations from a UD profile, we can clearly detect those only in W Hya.
This could be due to the presence of dust emission and/or the partially resolved brightness distribution of
extended molecular layers in the upper atmosphere.
The largest L 3.08 angular diameter is found around maximum visual light, where the J 1.24 and H 1.65 diameters are smallest.
Cyg
The Mira in our sample with the second longest pulsation period, Cyg (408 days) is the only S-type Mira
,albeit with M-type characteristics (cf. Keenan & Boeshaar 1980).
It deviates noticeably from the M-type Miras in many ways.
The visual light-curve of Cyg is well known for its particularly large magnitude range, and
its near-IR colours are also all unusually red, as observed by Whitelock et al. (2000).
The L 3.08 mean magnitude, in particular, is comparable to or brighter than that of K 2.26,
whereas for all other Miras in our study the L 3.08 magnitudes lie in the rage between the H 1.65 and the K 2.26 light-curves.
The relative diameter pulsation amplitude is larger in all filters than that of the other Miras in this paper, and the derived UD angular diameters show small cycle-to-cycle variation. There are no model predictions for S-type Miras to date, and we can only speculate whether or not this behaviour is related to the fundamental stellar parameters or to the fact that differing C to O ratio lead to significant changes in H2O formation characteristics (cf. Ohnaka 2004) and more stable opacity structures.
While the L 3.08 UD diameter pulsation follows the same trend as Cet, R Leo, R Cas and W Hya, in that it reaches maximum amplitude around maximum visual light, the diameters show a somewhat different behaviour. Note that the shapes of the visibility curves deviate increasingly from a UD profile with increasing wavelength. The K 2.26 and H 1.65 UD angular diameters reach their maximum values just after maximum light, at phase 0.1-0.2, coinciding with the maximum of the correspondent light curves. This may indicate a heavy contamination of these filters by molecular layers in the star’s atmosphere. On the other hand, the J 1.24 band data infers a smaller UD diameter with its maximum around minimum light, as observed in the other Miras in our sample, suggesting a deeper view into Cyg’s atmosphere.
Young et al. (2000) only detected a slight variation in the -band angular diameters, albeit over a very small phase coverage. If we fit a sine curve to our derived J 1.24 angular diameters, then we find that Young et al. (2000) measurements lie roughly symmetrically around the diameter pulsation minimum, a factor that could explain the lack of diameter variation in their studies. We converted the -band Gaussian FWHM from Young et al. (2000) to UD angular diameters using the UD to Gaussian ratio calculated by Burns et al. (1998), and find that the diameters approximately match our simple sine curve predictions. Mennesson et al. (2002) report a (centered at 2.16 m, 0.32m wide) UD angular diameter of 23.24 mas for Cyg on 2000 May, at variable phase 0.38. On June of the same year (phase 0.48) we obtained a K 2.26 diameter of 25.0, in reasonable agreement. In the next two subsequent years (both at phase 0.36) we observed UD diameters of approximately 30 mas, an increase in diameter of 20% over one cycle, which might be linked to transient opacity structures.
5 Summary
We have measured the diameters and NIR light-curves of 6 Miras stars at up to 19 separate phases in 4 filters, the first study of this magnitude. We present the first narrowband 3.08 m light-curves of Miras. The NIR light-curves can be approximated by a sine function and confirm the phase shift of by which the NIR maxima lag behind the visual maxima previously reported by Nadzhip et al. (2001) and Smith et al. (2002). In addition we find a NIR photometric flux relation: J 1.24 H 1.65 K 2.26, in agreement with the observations of Whitelock et al. (2000) and Smith et al. (2002). The L 3.08 fluxes in our sample are slightly less or equal to the K 2.26 fluxes, except for Cyg, where the L 3.08 magnitudes are of the comparable to the ones in the K 2.26 bandpass.
We found no correlation between NIR photometry and UD diameter cycle-to-cycle variations,
yet found some correlation between the L 3.08 UD diameters and the visual light-curves (see section R Leo).
All observed stars show variations of their UD angular diameters as a function of pulsation phase.
We find the UD diameter relation J 1.24 H 1.65 K 2.26 to be an average value only,
with deviations throughout the pulsation cycle, revealing the complexity of phase dependant opacity contamination from molecules in different layers.
Of the Miras in our sample, only Cet shows this strict layering throughout its cycle, in agreement with theoretical models
designed to represent Cet (see Jacob & Scholz 2002).
The pulsation amplitude also does not follow the model-predicted dependency on molecular opacity (Ireland et al. 2004a, b).
The layers exhibiting the largest relative variation in UD diameter (6%-18%) were those seen through the H 1.65 and J 1.24 filters,
which should display less molecular contamination and thus less diameter variation.
The K 2.26 layer has UD diameters pulsation amplitudes between 4% and 7%.
The molecular layer probed by the L 3.08 bandpass is significantly further from the photosphere than the layers.
It varies in UD angular diameter by as little a 4% and as much as 8%, with a 0.5 phase offset to the H 1.65 pulsation,
and is between 1.5 and 2.5 times larger than the H 1.65 UD angular diameter, depending on the pulsation phase.
This behaviour has not been observed before, and detailed models are needed to understand it.
Another quantity predicted by models are the diameters in different wavelengths at different phases.
When comparing the two stars whose parameters are thought to resemble the model input parameters the most,
R Leo and Cet (both with revised Hipparcos parallaxes, see Knapp et al. 2003), with model predictions (Ireland et al. 2004a, b),
we find that our UD diameters are significantly too large in the K 2.26 bandpass.
This could be explained by too high model effective temperatures, but a more careful, model based interpretation is needed
to understand this effect.
Given the small baselines ( 10 m) used in this experiment, it is remarkable how consistent the data is for the M-type Miras.
It is even more surprising how different the S-type Mira Cyg appears to be when it’s mutli-wavelength pulsation signature is analyzed.
The H 1.65 and K 2.26 UD angular diameters are smallest around minimum light, contrary to all models and previous observations of M-type Miras.
Further work with these data, including model comparisons with individual stars, imaging and asymmetry studies, will be presented in subsequent publications.
References
- Aringer et al. (2002) Aringer, B., Kerschbaum, F., & Jörgensen, U. G. 2002, A&A, 395, 915
- Bessell et al. (1996) Bessell, M. S., Scholz, M., & Wood, P. R. 1996, A&A, 307, 481
- Burns et al. (1998) Burns, D., Baldwin, J. E., Boysen, R. C., Haniff, C. A., Lawson, P. R., Mackay, C. D., Rogers, J., Scott, T. R., St.-Jacques, D., Warner, P. J., Wilson, D. M. A., & Young, J. S. 1998, MNRAS, 297, 462
- Danchi et al. (1994) Danchi, W. C., Bester, M., Degiacomi, C. G., Greenhill, L. J., & Townes, C. H. 1994, AJ, 107, 1469
- di Giacomo et al. (1991) di Giacomo, A., Lisi, F., Calamai, G., & Richichi, A. 1991, A&A, 249, 397
- Dumm & Schild (1998) Dumm, T. & Schild, H. 1998, New Astronomy, 3, 137
- Dyck et al. (1996) Dyck, H. M., Benson, J. A., van Belle, G. T., & Ridgway, S. T. 1996, AJ, 111, 1705
- Dyck et al. (1998) Dyck, H. M., van Belle, G. T., & Thompson, R. R. 1998, AJ, 116, 981
- Fedele et al. (2005) Fedele, D., Wittkowski, M., Paresce, F., Scholz, M., Wood, P. R., & Ciroi, S. 2005, A&A, 431, 1019
- Golay (1971) Golay, M. J. E. 1971, J. Opt. Soc. Am., 61, 272
- Hanbury Brown et al. (1974) Hanbury Brown, R., Davis, J., & Allen, L. R. 1974, MNRAS, 167, 121
- Haniff et al. (1995) Haniff, C. A., Scholz, M., & Tuthill, P. G. 1995, MNRAS, 276, 640
- Hofmann et al. (2000) Hofmann, K.-H., Beckmann, U., Blöcker, T., Coudé du Foresto, V., Lacasse, M. G., Millan-Gabet, R., Morel, S., Pras, B., Ruilier, C., Schertl, D., Scholz, M., Shenavrin, V., Traub, W. A., Weigelt, G., Wittkowski, M., & Yudin, B. 2000, in Interferometry in Optical Astronomy, eds. P. J. Lena and A. Quirrenbach, SPIE Proc., 4006, 688
- Hofmann et al. (2002) Hofmann, K.-H., Beckmann, U., Blöcker, T., Coudé du Foresto, V., Lacasse, M., Mennesson, B., Millan-Gabet, R., Morel, S., Perrin, G., Pras, B., Ruilier, C., Schertl, D., Schöller, M., Scholz, M., Shenavrin, V., Traub, W., Weigelt, G., Wittkowski, M., & Yudin, B. 2002, New Astronomy, 7, 9
- Hofmann et al. (1998) Hofmann, K.-H., Scholz, M., & Wood, P. R. 1998, A&A, 339, 846
- Ireland (2006) Ireland, M. J. 2006, in Advances in Stellar Interferometry. Edited by Monnier, John D.; Schöller, Markus; Danchi, William C.. Proceedings of the SPIE, Volume 6268, pp. (2006).
- Ireland et al. (2007) Ireland, M. J., Monnier, J. D., Tuthill, P. G., Cohen, R. W., De Buizer, J. M., Packham, C., Ciardi, D., Hayward, T., & Lloyd, J. P. 2007, ArXiv Astrophysics e-prints
- Ireland & Scholz (2006) Ireland, M. J. & Scholz, M. 2006, MNRAS, 367, 1585
- Ireland et al. (2004a) Ireland, M. J., Scholz, M., Tuthill, P. G., & Wood, P. R. 2004a, MNRAS, 355, 444
- Ireland et al. (2004b) Ireland, M. J., Scholz, M., & Wood, P. R. 2004b, MNRAS, 352, 318
- Ireland et al. (2004c) Ireland, M. J., Tuthill, P. G., Bedding, T. R., Robertson, J. G., & Jacob, A. P. 2004c, MNRAS, 350, 365
- Jacob & Scholz (2002) Jacob, A. P. & Scholz, M. 2002, MNRAS, 336, 1377
- Joy (1954) Joy, A. H. 1954, ApJS, 1, 39
- Jura & Kleinmann (1990) Jura, M. & Kleinmann, S. G. 1990, ApJS, 73, 769
- Karovska et al. (1997) Karovska, M., Hack, W., Raymond, J., & Guinan, E. 1997, ApJ, 482, L175
- Karovska et al. (1991) Karovska, M., Nisenson, P., Papaliolios, C., & Boyle, R. P. 1991, ApJ, 374, L51
- Keenan & Boeshaar (1980) Keenan, P. C. & Boeshaar, P. C. 1980, ApJS, 43, 379
- Kholopov et al. (1998) Kholopov, P. N., Samus, N. N., Frolov, M. S., Goranskij, V. P., Gorynya, N. A., Karitskaya, E. A., Kazarovets, E. V., Kireeva, N. N., Kukarkina, N. P., Kurochkin, N. E., Medvedeva, G. I., Pastukhova, E. N., Perova, N. B., Rastorguev, A. S., & Shugarov, S. Y. 1998, in Combined General Catalogue of Variable Stars, 4.1 Ed (II/214A). (1998)
- Knapp et al. (2003) Knapp, G. R., Pourbaix, D., Platais, I., & Jorissen, A. 2003, A&A, 403, 993
- Lançon & Wood (2000) Lançon, A. & Wood, P. R. 2000, A&AS, 146, 217
- Lockwood & Wing (1971) Lockwood, G. W. & Wing, R. F. 1971, ApJ, 169, 63
- Mennesson et al. (2002) Mennesson, B., Perrin, G., Chagnon, G., du Coudé Foresto, V., Ridgway, S., Merand, A., Salome, P., Borde, P., Cotton, W., Morel, S., Kervella, P., Traub, W., & Lacasse, M. 2002, ApJ, 579, 446
- Millan-Gabet et al. (2005) Millan-Gabet, R., Pedretti, E., Monnier, J. D., Schloerb, F. P., Traub, W. A., Carleton, N. P., Lacasse, M. G., & Segransan, D. 2005, ApJ, 620, 961
- Monnier (1999) Monnier, J. D. 1999, ph.D. thesis, University of California, Berkeley
- Monnier et al. (2004) Monnier, J. D., Millan-Gabet, R., Tuthill, P. G., Traub, W. A., Carleton, N. P., Coudé du Foresto, V., Danchi, W. C., Lacasse, M. G., Morel, S., Perrin, G., Porro, I. L., Schloerb, F. P., & Townes, C. H. 2004, ApJ, 605, 436
- Monnier et al. (2002) Monnier, J. D., Tuthill, P. G., & Danchi, W. C. 2002, ApJ, 567, L137
- Mozurkewich et al. (2003) Mozurkewich, D., Armstrong, J. T., Hindsley, R. B., Quirrenbach, A., Hummel, C. A., Hutter, D. J., Johnston, K. J., Hajian, A. R., Elias, II, N. M., Buscher, D. F., & Simon, R. S. 2003, AJ, 126, 2502
- Mozurkewich et al. (1991) Mozurkewich, D., Johnston, K. J., Simon, R. S., Bowers, P. F., Gaume, R., Hutter, D. J., Colavita, M. M., Shao, M., & Pan, X. P. 1991, AJ, 101, 2207
- Nadzhip et al. (2001) Nadzhip, A. E., Tatarnikov, A. M., Shenavrin, V. I., Weigelt, G., & Yudin, B. F. 2001, Astronomy Letters, 27, 324
- Ohnaka (2004) Ohnaka, K. 2004, A&A, 424, 1011
- Perrin et al. (1998) Perrin, G., Coudé du Foresto, V., Ridgway, S. T., Mariotti, J.-M., Traub, W. A., Carleton, N. P., & Lacasse, M. G. 1998, A&A, 331, 619
- Perrin et al. (1999) Perrin, G., Coudé du Foresto, V., Ridgway, S. T., Mennesson, B., Ruilier, C., Mariotti, J.-M., Traub, W. A., & Lacasse, M. G. 1999, A&A, 345, 221
- Perrin et al. (2004) Perrin, G., Ridgway, S. T., Mennesson, B., Cotton, W. D., Woillez, J., Verhoelst, T., Schuller, P., Coudé du Foresto, V., Traub, W. A., Millan-Gabet, R., & Lacasse, M. G. 2004, A&A, 426, 279
- Pourbaix et al. (2002) Pourbaix, D., Platais, I., Detournay, S., Jorissen, A., Knapp, G., & Makarov, V. V. 2002, VizieR Online Data Catalog, 339, 91167
- Ragland et al. (2006) Ragland, S., Traub, W. A., Berger, J.-P., Danchi, W. C., Monnier, J. D., Willson, L. A., Carleton, N. P., Lacasse, M. G., Millan-Gabet, R., Pedretti, E., Schloerb, F. P., Cotton, W. D., Townes, C. H., Brewer, M., Haguenauer, P., Kern, P., Labeye, P., Malbet, F., Malin, D., Pearlman, M., Perraut, K., Souccar, K., & Wallace, G. 2006, ApJ, 652, 650
- Richichi & Percheron (2002) Richichi, A. & Percheron, I. 2002, A&A, 386, 492
- Richichi et al. (2005) Richichi, A., Percheron, I., & Khristoforova, M. 2005, A&A, 431, 773
- Ridgway et al. (1992) Ridgway, S. T., Benson, J. A., Dyck, H. M., Townsley, L. K., & Hermann, R. A. 1992, AJ, 104, 2224
- Ridgway et al. (1979) Ridgway, S. T., Wells, D. C., Joyce, R. R., & Allen, R. G. 1979, AJ, 84, 247
- Scholz (2003) Scholz, M. 2003, in Interferometry for Optical Astronomy II, ed. Wesley A. Traub, SPIE Proc., 4838, 163
- Scholz & Wood (2000) Scholz, M. & Wood, P. R. 2000, A&A, 362, 1065
- Sloan & Price (1998) Sloan, G. C. & Price, S. D. 1998, ApJS, 119, 141
- Smith et al. (2002) Smith, B. J., Leisawitz, D., Castelaz, M. W., & Luttermoser, D. 2002, AJ, 123, 948
- Tej et al. (1999) Tej, A., Chandrasekhar, T., Ashok, N. M., Ragland, S., Richichi, A., & Stecklum, B. 1999, AJ, 117, 1857
- Tej et al. (2003) Tej, A., Lançon, A., Scholz, M., & Wood, P. R. 2003, A&A, 412, 481
- Thompson et al. (2002) Thompson, R. R., Creech-Eakman, M. J., & van Belle, G. T. 2002, ApJ, 577, 447
- Tuthill et al. (2000a) Tuthill, P. G., Danchi, W. C., Hale, D. S., Monnier, J. D., & Townes, C. H. 2000a, ApJ, 534, 907
- Tuthill et al. (1995) Tuthill, P. G., Haniff, C. A., & Baldwin, J. E. 1995, MNRAS, 277, 1541
- Tuthill et al. (1999) —. 1999, MNRAS, 306, 353
- Tuthill et al. (2002) Tuthill, P. G., Monnier, J. D., Danchi, W. C., Hale, D. D. S., & Townes, C. H. 2002, ApJ, 577, 826
- Tuthill et al. (2000b) Tuthill, P. G., Monnier, J. D., Danchi, W. C., Wishnow, E. H., & Haniff, C. A. 2000b, PASP, 112, 555
- van Belle et al. (1996) van Belle, G. T., Dyck, H. M., Benson, J. A., & Lacasse, M. G. 1996, AJ, 112, 2147
- van Belle et al. (2002) van Belle, G. T., Thompson, R. R., & Creech-Eakman, M. J. 2002, AJ, 124, 1706
- Whitelock et al. (2000) Whitelock, P., Marang, F., & Feast, M. 2000, MNRAS, 319, 728
- Wood & Karovska (2006) Wood, B. E. & Karovska, M. 2006, ApJ, 649, 410
- Wood et al. (1999) Wood, P. R., Alcock, C., Allsman, R. A., Alves, D., Axelrod, T. S., Becker, A. C., Bennett, D. P., Cook, K. H., Drake, A. J., Freeman, K. C., Griest, K., King, L. J., Lehner, M. J., Marshall, S. L., Minniti, D., Peterson, B. A., Pratt, M. R., Quinn, P. J., Stubbs, C. W., Sutherland, W., Tomaney, A., Vandehei, T., & Welch, D. L. 1999, in IAU Symp. 191: Asymptotic Giant Branch Stars, eds. T. Le Bertre, A. Lebre and C. Waelkens, 151
- Woodruff et al. (2004) Woodruff, H. C., Eberhardt, M., Driebe, T., Hofmann, K., Ohnaka, K., Richichi, A., Schertl, D., Schöller, M., Scholz, M., Weigelt, G., Wittkowski, M., & Wood, P. 2004, A&A, 421, 703
- Young et al. (2000) Young, J. S., Baldwin, J. E., Boysen, R. C., Haniff, C. A., Pearson, D., Rogers, J., St-Jacques, D., Warner, P. J., & Wilson, D. M. A. 2000, MNRAS, 318, 381