Singlet ground state probed by crystal field inelastic neutron spectroscopy on the antiferroquadrupolar system TmGa3
Abstract
TmGa3 (AuCu3 structure) undergoes two phase transitions, an antiferroquadrupolar transition at 4.29 K and long-range antiferromagnetic ordering at 4.26 K. Due to the close vicinity of the two phase transitions, TmGa3 offers an interesting system to study the interplay of charge and magnetic degrees of freedom. In order to understand this interplay we have performed inelastic neutron scattering experiments on TmGa3 in the paramagnetic regime ( 5 K) to redetermine the crystal electric field level scheme. By fitting our spectra at various temperatures we obtain a new crystal field level scheme with Lea, Leask and Wolf parameters of = -0.44(2) and = -0.222(2) K. The total crystal field splitting at 5K amounts to 2.3 meV, about an order of magnitude less than found previously, but in good agreement with the splitting extrapolated from the related ErGa3 system.
Our analysis yields a singlet as the crystal field ground state followed closely by a (nonmagnetic) singlet at 0.009 meV. The next excited states are a triplet at 0.5 meV, which is almost degenerate to a doublet. This level scheme is adverse to previous findings. Subsequent analysis of the magnetisation along several crystallographic directions and the temperature dependant susceptibility as well as of the magnetic contribution to the specific heat are consistent with our new crystal field parameters. Implications for the antiferroquadrupolar and the antiferromagnetic transition are discussed.
pacs:
…I Introduction
In 4f electron systems the determination of the crystal electric field (CEF) level scheme is an important first step to understanding the rich variety of physical phenomena that rare earth compounds exhibit. In 4f systems the coupling between the spin and orbital angular momentum is stronger than the crystal field due to the fact that the 4f orbital lies deep within the ion core and the other occupied orbitals screen out the potential of the surrounding ions. To a very good approximation the magnetic properties of the free ion can therefore be characterized by the total angular momentum J. CEF interactions, in general, lead to a splitting of the 2+1 manifold into CEF states. Their degeneracy and energy splitting is determined by the symmetry of the electric charge distribution and the magnitude of the interaction.
Recently, there has been a renewed interest in systems which undergo antiferroquadrupolar (AFQ) phase transitions originating from the interaction of low lying quadrupole active CEF levels. CeB6 was the first compound to be unambiguously defined as having an AFQ character by INS experiments.Effantin et al. (1985) The phase diagram of CeB6 shows a huge enhancement of the AFQ phase with increase of magnetic field aligned along [001]. More recently, a modulated AFQ structure was identified in the intermetallic compound PrPb3 by INS experiments.Onimaru et al. (2005) A non magnetic ground state was found in the heavy fermion superconductor PrOs4Sb12 which also undergoes a field induced type AFQ ordering.Bauer et al. (2006); Kaneko et al. (2007) The heavy fermion system PrFe4P12 shows a large increase of the lattice thermal conductivity at the quadrupolar transition. Pourret et al. (2006) In UPd3 a Qzx quadrupolar order parameter was determined to describe the AFQ phaseWalker et al. (2006).
Quite a number of systems with AFQ transitions were found among Tm based compounds. TmZn (Ref.Lüthi et al., 1979), TmCu (Ref.Morin and Schmitt, 1980) and TmGa3 (Ref.Czopnik et al., 1985) exhibit an AFQ order in the paramagnetic phase, followed closely by an antiferromagnetic (AFM) transition. TmCd (Ref.Lüthi et al., 1979), on the other hand, shows only a transition of AFQ nature, with no experimentally verified AFM transition down to 30 mK. TmTe, a magnetic semiconductor which contains divalent Tm2+ ions, has been studied by INS, in which a field induced magnetic superstructure was seen due to AFQ ordering at 1.8 K.Link et al. (1979) TmGa3 was intensively investigated due to its complex low temperature phase diagram. The phase diagram of TmGa3 was first investigated by Czopnik et al. by specific heat, thermal expansion and susceptibility measurements.Czopnik et al. (1985) They found two close lying transitions at 4.26 K and 4.29 K. By a comparison with TmZn and TmCd, the first transition at 4.29 K was attributed to a structural transition driven by quadrupolar pair interactions, followed by an antiferromagnetic transition at 4.26 K. This interesting interplay of charge and magnetic degrees of freedom refocused our attention on TmGa3. TmGa3 crystallizes with the AuCu3 type cubic structure, space group Pmm. The trivalent state, Tm3+, with electronic configuration 4f12 gives a total angular momentum J = 6. A first INS study carried out by Morin et al. Morin et al. (1987a) concluded the crystal field parameters in the Lea, Leask and Wolf (LLW) scheme (Ref.Lea et al., 1962) to be x = -0.32 and W = 1.03 K. These give a triplet as the CEF ground state separated by 2.5 meV from a state as the first excited state. A triplet CEF ground state was reported to be consistent with the temperature dependance of the magnetic susceptibility. A 169Tm Mössbauer spectroscopy study was used to determine the quadrupolar term in the CEF Hamiltonian.Gubbens et al. (1986) By fixing W = 1.0 K, = -0.38 and using an iterative procedure the quadrupolar CEF term B = -0.30 K was obtained.
We decided to extend these preceding experiments and to search for possible splittings of the ground state, as well as follow the temperature dependance of the low crystal field levels near the AFQ transition to see whether there are any signatures of the AFQ transition in the CEF spectra. However, the results of our inelastic crystal field spectroscopy experiments reveal a much different CEF level scheme and overall splitting of the =6 manifold in TmGa3 that imply a reinterpretation of the low temperature behavior of TmGa3.
II Theoretical Background
A prerequisite in the analysis of the magnetic properties of TmGa3 is the determination of the CEF ground state of the Tm3+ ions and the energy separation to the excited levels. For a cubic system the Hamiltonian of the 2+1 manifold of the total angular momentum due to a crystal field interaction of cubic symmetry is conveniently written in the operator equivalent form Lea et al. (1962)
| (1) |
where are the Stevens operators tabulated e.g. in Ref. Abragam and Bleaney, 1970. The coefficients and are parameters that measure the respective components in the multipole expansion of the CEF potential. With the relations
| (2) |
and
| (3) |
and can be further decomposed into a product of the coefficients and , sometimes called geometrical factorsLea et al. (1962), the mean fourth and sixth powers of the radial part of the wave functions of the 4 electrons, and and the factors which are listed e.g. in Ref. [Abragam and Bleaney, 1970].
In order to conveniently tabulate the normalized eigenvectors and eigenvalues for a given manifold, Lea, Leask and Wolf suggested a transformation of and into the parameters and by using the following relationsLea et al. (1962)
| (4) | |||
| (5) |
where (4) and (6) are numbers given in Ref. Lea et al., 1962. Via this transformation the whole range covered by and is mapped onto the the variable limited to the interval -1 +1 and the energy scale factor . With this transformation eq.(1) now becomes
| (6) |
with
| (7) | |||
| (8) |
Empirically it was found that for a given system of compounds with the same crystal structure the factors and vary only a little across the rare earths series. Walter (1982); Walter and Holland-Moritz (1981) Consequently, by using tabulated values for and (Refs.Freeman and Watson, 1962; T. O. Brun and Felcher, 1971) and for = and = one can estimate unknown parameters and from known CEF splitting found for another rare earth ion in the series of isotypic compounds.
Morin et al., from the analysis of their INS spectra (see above), found LLW parameters =-0.32 0.02 and =1.03 0.03 K for TmGa3, corresponding to = -34 4 K and = -17 2 K with a triplet as the CEF ground state and an overall splitting to the uppermost singlet of 17.5 meV.Morin et al. (1987a)
A detailed analysis of the crystal field splitting of the Er3+ manifold in the system ErGa3 (isotypic to TmGa3) was carried out by Murasik et al. by inelastic neutron spectroscopy and by the magnetic contributions to the heat capacity and the magnetizationMurasik et al. (2000). These experiments resulted in LLW parameters for Er3+ of = +0.195 and = +0.022 meV or equivalently, using eqs. (3) and (5), gives (Er3+) = +12.3 K and (Er3+) = +3.85 K. Using the numerical values of and for Er3+ and Tm3+ and also the values for and of Er3+ and Tm3+ respectivelyFreeman and Watson (1962); T. O. Brun and Felcher (1971), we find a large discrepancy in the magnitude and sign, for the coefficients and for Er3+ in ErGa3 to those of Tm3+ in TmGa3, as derived from the result of Morin et al..
TmGa3 undergoes quadrupolar and antiferromagnetic ordering below 4.3 K and 4.2 K, respectively (see above). Due to magnetoelastic coupling, associated to these transitions is a distortion of the lattice which leads to a symmetry lowering from cubic symmetry.Czopnik et al. (1985); Gubbens et al. (1986) This distortion induces a further splitting of the CEF states that can be described by an additional term added to the Hamiltonian in eq. (6)
| (9) |
Quadrupolar-quadrupolar interaction between a pair of rare earth ions labeled i and j is usually described by the Hamiltonian Abragam and Bleaney (1970); Birgeneau et al. (1966, 1969)
| (10) |
where the operators are defined in the usual way by
| (11) |
| (12) |
and
| (13) |
The coefficient A is given by
| (14) |
with being the mean square radius of the 4 ions on each site and the coefficient listed e.g. in Ref. Abragam and Bleaney, 1970. is the distance between the ions and is an effective dielectric constant for the pair of ions. Birgeneau et al. (1966) Knowing and , the coefficient can, in principle, be calculated. However, is very sensitive to shielding effects due to the intervening ions and the conduction electrons in the case of metals. In general, must therefore be treated as an unknown parameter to be obtained from experiment.
First order quadrupolar effects for Tm3+ may occur for the non-Kramers doublet with the two states having a quadrupole moment of opposite sign but the same magnitude and for the triplet states and . The two singlets and show only second and higher order quadrupolar effects.
III Experimental
All samples were grown from a Ga flux in quartz ampoules with a procedure described elsewhereCanfield and Fisk (1992) and characterized by X-ray diffraction to ensure phase purity. They were found to have the correct AuCu3 structure with no impurity reflections above the noise level. The composition of single crystals was checked by electron microprobe analysis and found to have the correct atomic ratios.
Inelastic neutron CEF spectroscopy was performed on the neutron time-of-flight spectrometers IN4, IN6 and the triple axis spectrometer IN12 at the Institut Laue-Langevin (Grenoble). IN4 operates in the thermal neutron energy range 10-100 meV. A suitable energy is selected from the thermal spectrum with a crystal monochromator. The cold neutron time-of-flight spectrometer IN6 provides quasielastic and inelastic spectra for incident wavelengths in the range of 4 to 6 Å. A graphite monochromator delivers the four wavelengths 4.1, 4.6, 5.1, and 5.9 Å. The second order reflection from the graphite monochromator is removed by a beryllium-filter cooled to liquid nitrogen temperature. The elastic energy resolution at 4.1 Å is 170 eV and at 5.9 Å, 50 eV. Inelastic neutron scattering measurements on a polycrystal line sample of Tm0.1Lu0.9Ga3 were carried out on the cold neutron triple-axis spectrometer IN12. The analysis of the INS was carried out using the program Rotter (2004) to calculate at a given temperature the intensities and energies of the allowed CEF transitions for a set of LLW parameters and .
In addition, we have performed specific heat measurements on single crystals and polycrystalline samples of TmGa3 and polycrystalline samples of Lu1-xTmxGa3 (=0.05, 0.01) and on the isostructural nonmagnetic compound LuGa3 in a PPMS (Quantum Design) relaxation-type calorimeter. The sample pieces were fixed with a minute amount of Apiezon N grease on a sapphire platform which also carried the heater and a calibrated temperature sensor. The addenda heat capacities of the calorimeter and the grease were determined in separate runs and subtracted. Magnetic susceptibility measurements were performed using a MPMS magnetometer (Quantum Design) in the temperature 1.9K 350K and 0T 7T.
Electron paramagnetic resonance (EPR) spectroscopy on Er3+ in polycrystalline samples with composition Lu1-xErxGa3 (=0.005, 0.01, 0.03) was performed using a Bruker X-band EPR spectrometer (9.3 GHz). The derivative of the resonance absorption dPabs/dH is obtained using field modulation (=100 kHz) with standard lock-in detection technique. Coarse powdered samples were filled in quartz ampoules and fixed in paraffin for measurements below room temperature, which was provided by a continuous-flow He cryostat (Oxford instruments).
IV Results and Discussion
IV.1 EPR on Lu1-xErxGa3
In order to test whether the finding of a doublet CEF ground state for the = 15/2 manifold of Er3+ in ErGa3 can be confirmed, we carried out an EPR study on Lu1-xErxGa3 (=0.005, 0.01, 0.03) in the temperature range 4 K 25 K. A Kramers doublet is expected to exhibit an isotropic EPR line at a resonance field corresponding to a factor of 6.8. The resonance field of the doublet can be well distinguished from that of the doublet which has a factor of 6.0. EPR resonances of the three quadruplets resulting from the CEF splitting of the = 15/2 manifold are angular dependent and in a polycrystalline sample will generally result in very broad smeared resonance lines. Excited CEF states at an energy open additional relaxation channels via Hirst and Orbach processes which give an exponential increase of the linewidth, ) in addition to the normal Korringa relaxation, .Hirst (1969); Orbach (1961)
Murasik et al.’s CEF scheme provides a quadruplet as the first excited state at an energy of 2.7 meV.Murasik et al. (2000) Measurements of the temperature dependence of the EPR linewidth above liquid He temperature should be able to reveal relaxation via this state and provide an additional support for the validity of the proposed CEF level scheme of ErGa3.
As a characteristic spectrum, Fig. 1 displays the EPR resonance of Lu0.995Er0.005Ga3 at a frequency of 9.3 GHz. At low temperatures we observe an asymmetric resonance line at resonance fields of 978(1) Oe with typical linewidths of 100 Oe. With increasing temperature the resonance rapidly broadens and it is not detectable any more above 25 K. As is typical for EPR of localized moments in metals and intermetallic compounds, the resonance is asymmetric due to the mixtures of an absorption and dispersion signal due to the skin effect. Characteristic shoulders, especially resolved for small Er concentrations in the low field wing of the central line are due to hyperfine satellites from the isotope 167Er ( = 7/2). Their resonance fields shift with respect to the resonance field of the central line, , observed for all other isotopes with =0 according to:Low (1960)
| (15) |
where is the hyperfine constant for 167Er.
A superposition of the central line and the hyperfine satellites, all with the same linewidth, and an absorption/dispersion ratio (characterizing the linewidth asymmetry) of typically 1 was found to fit the spectra very well (cf. Fig. 1).
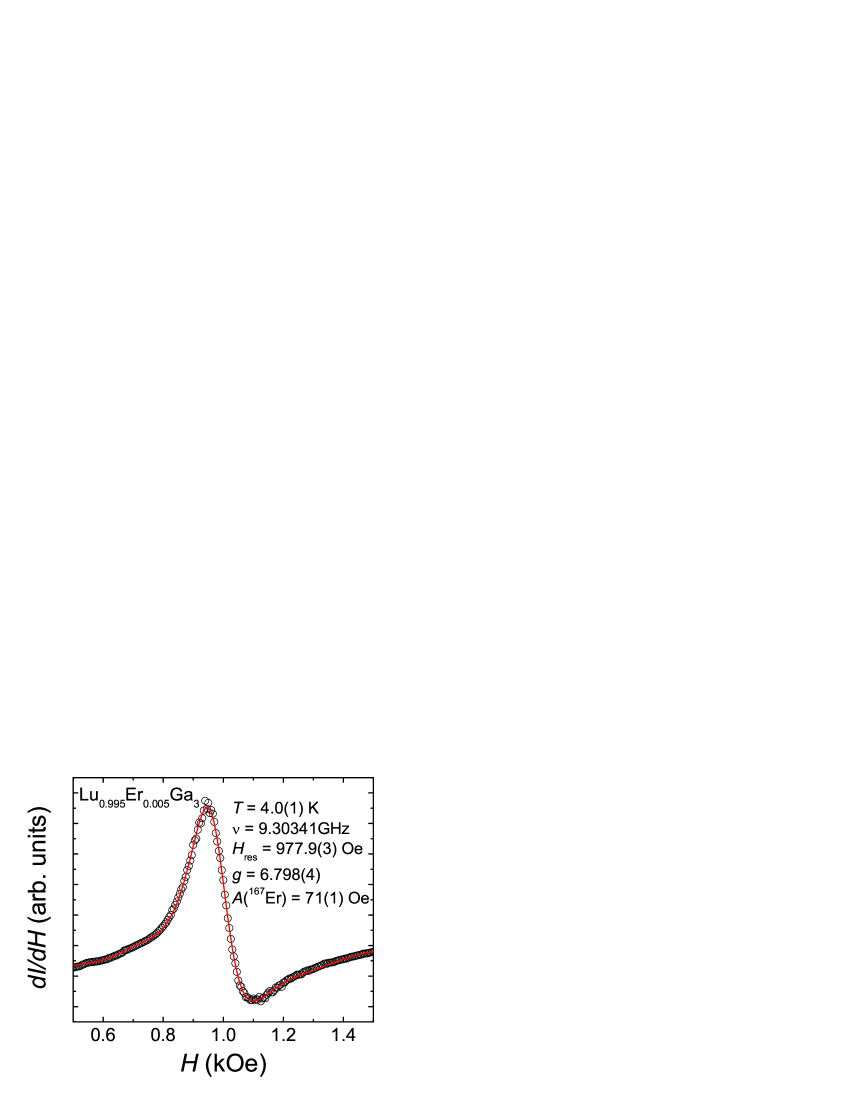
The resonance fields of the central lines is independent of the temperature within error bars and corresponds to a factor of
| (16) |
The factor and hyperfine constant are somewhat larger than the respective quantities observed for the Er EPR of a CEF doublet in insulators (6.75 - 6.76 and 73 - 74 G).Tao et al. (1971) These shifts can be understood as due to the exchange interaction of the localized Er moment with the conduction electrons. Tao et al. (1971); Barnes (1981)
The temperature dependence of the linewidth obtained from the fits are displayed in Fig. 2. At low temperatures we observe a linear increase of the linewidth with temperature (Korringa relaxation). Towards higher temperatures the linewidth grows faster than linearly and above 20 K the linewidth is of the order of the resonance fields and the EPR is not detectable any more.
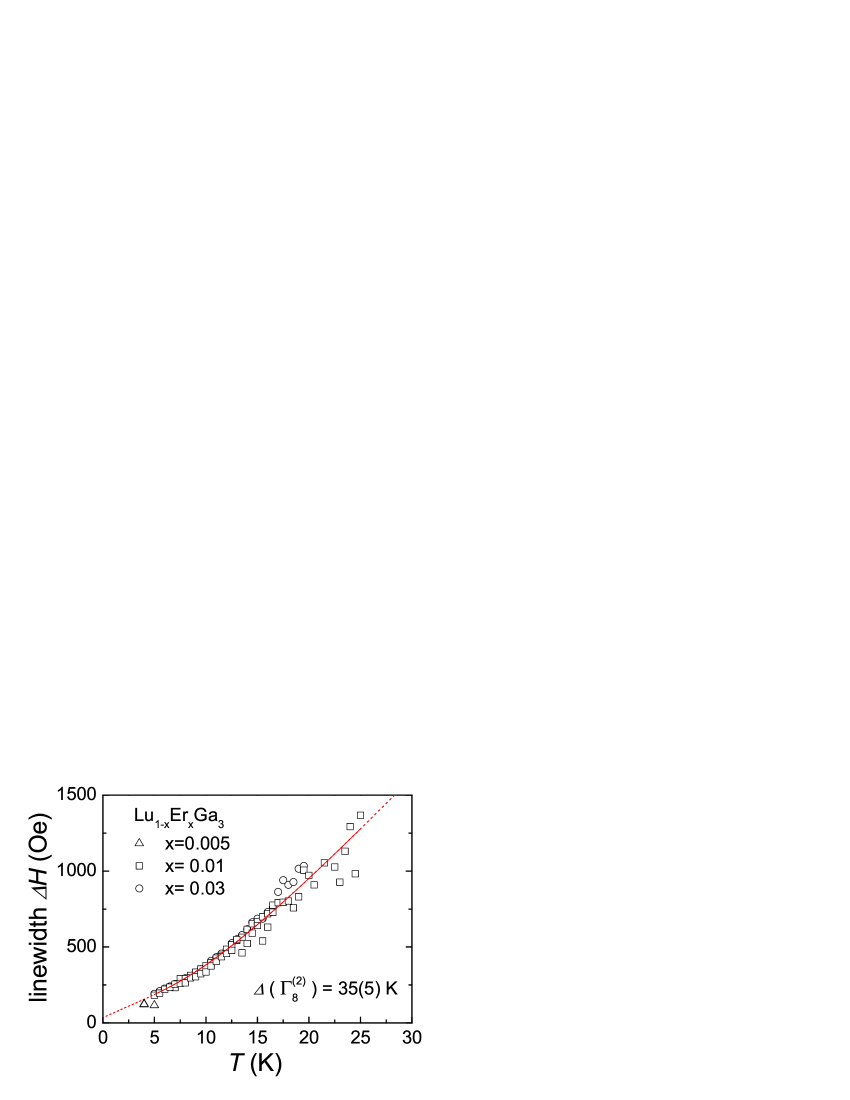
The non-linear temperature dependence of the EPR linewidth of non- ground state rare earth moments in metals can be conveniently described by the function
| (17) |
where represents the residual linewidth, the Korringa relaxation of the localized moments to the conduction electrons and the supralinear third term summarizes the contribution from relaxation processes via excited CEF states located at an energy above the CEF ground state (Orbach and Hirst processes).Dodds et al. (1978); Hirst (1969) Fitting our data with eq. (17) we arrive at a Korringa term
| (18) |
The exponential broadening of the linewidth at higher temperatures can be ascribed to relaxation via an excited CEF state at an energy
| (19) |
The g factor of the Er3+ EPR in Lu1-xErxGa3 clearly confirms the doublet as the CEF groundstate and the analysis of the temperature dependence of the linewidth sets the first excited state to 3.1 meV, in very good agreement with the energy of the first excited quadruplet concluded by Murasik et al.. These findings strongly support the analysis by Murasik et al. for the CEF level scheme of Er3+ in ErGa3. They also show that by dilution into the isotypic diamagnetic matrix, LuGa3, the single-ion CEF parameters remain close to those found in the concentrated compound in the paramagnetic state.
EPR spectra taken at low temperatures on polycrystalline samples of Lu0.95Tm0.05Ga3 showed no indication of a resonance from Tm3+.
IV.2 Inelastic Neutron Spectroscopy
In their early INS investigation Morin et al. observed broad inelastic modes centered at 2.6 meV, 11meV and 17 meV from which they concluded a total splitting of the CEF levels of 200K.Morin et al. (1987a) Guided by these results we studied polycrystalline samples of TmGa3, Lu0.95Tm0.05Ga3 and ErGa3 on ILL’s time-of-flight spectrometer IN4 with neutrons of incident energies corresponding to wavelengths of 3.3 Å, 2.2 Å and 1.1 Å at temperatures of 20 K and below. Our data for TmGa3 show modes at the same energies as found by Morin et al. but the mode at 11meV is somewhat better resolved and it becomes obvious that this mode consists of two modes at 8.5meV and 10.7meV. At the same energies, modes of comparable (normalized) intensity are also observed in the IN4 spectra of ErGa3 and of Lu0.95Tm0.05Ga3. In ErGa3 Murasik et al. have seen inelastic scattering intensity emerging from CEF transitions essentially up to 5meV.Murasik et al. (2000) This energy limitation for the CEF transitions in ErGa3 and the fact that in the diamagnetically diluted sample Lu0.95Tm0.05Ga3 similar modes are observed, leads us to the conclusion that all modes appearing in TmGa3, ErGa3 and Lu0.95Tm0.05Ga3 above 6meV cannot be attributed to CEF transitions. The subsequent inspection of the q-dependence of these modes clearly identified them as phonon modes. Extending the energy range further, two more phonon modes at 21.5meV and 35meV were found.
The detailed investigation of the temperature dependence of the low energy regime, 7.5meV, showed that the mode centered at 2.6meV consists at least of two submodes and revealed also a mode at very low energy 0.4meV appearing as a shoulder on the energy-loss side of the elastic peak. Comparison with the energy-gain part of the spectra indicated this mode to originate from a CEF excitation from states close to the ground state. Summarizing these results, we concluded that, in contrast to the preceding analysis by Morin et al. the total CEF splitting of the =6 manifold of Tm3+ in TmGa3 does not exceed an energy range of 3.5meV. This presumption was in agreement with the energy range estimated from the and parameters obtained from the analysis of the ErGa3 INS data (see above). Using the IN4 data a least square fitting procedure was carried out on the 5 and 10 K spectra (above the phase transitions). Although the 0.3meV excitation is not clearly resolved, the relative intensities of the peaks at 0.3meV and 2.5meV enabled us to obtain a first estimate of the LLW parameters which were in accord with this conclusion.
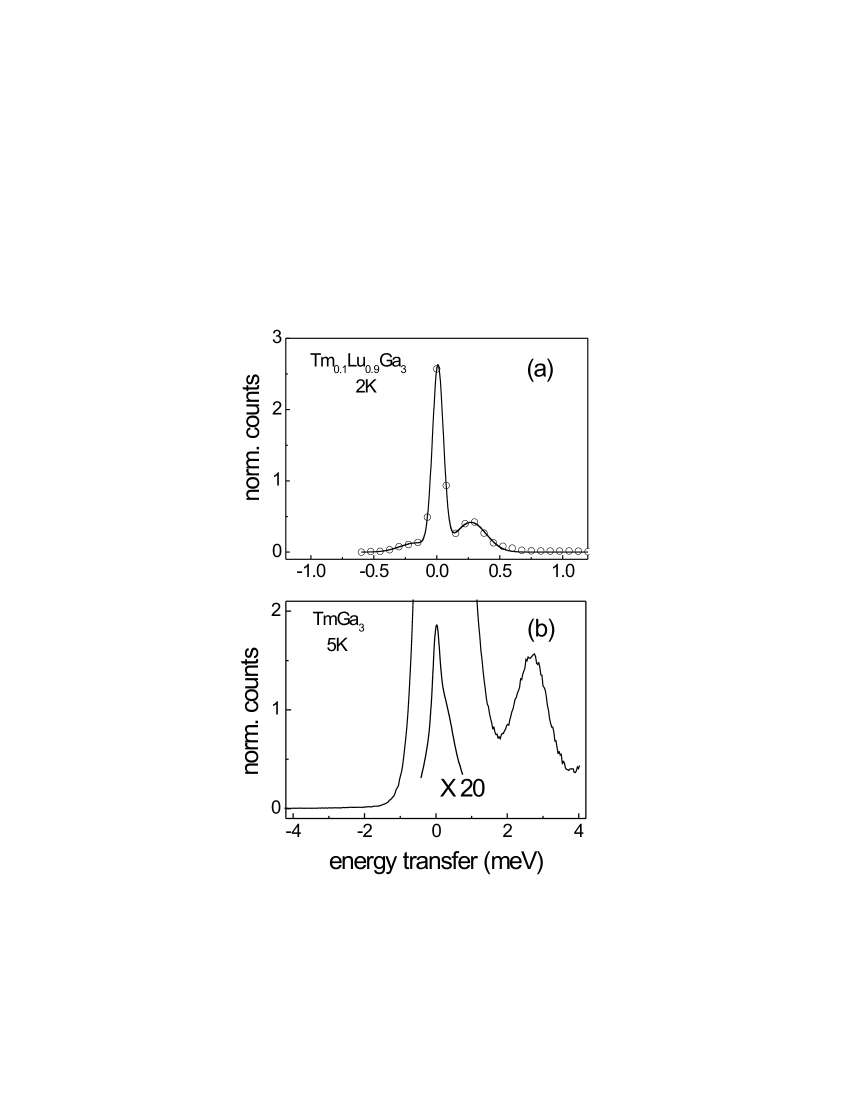
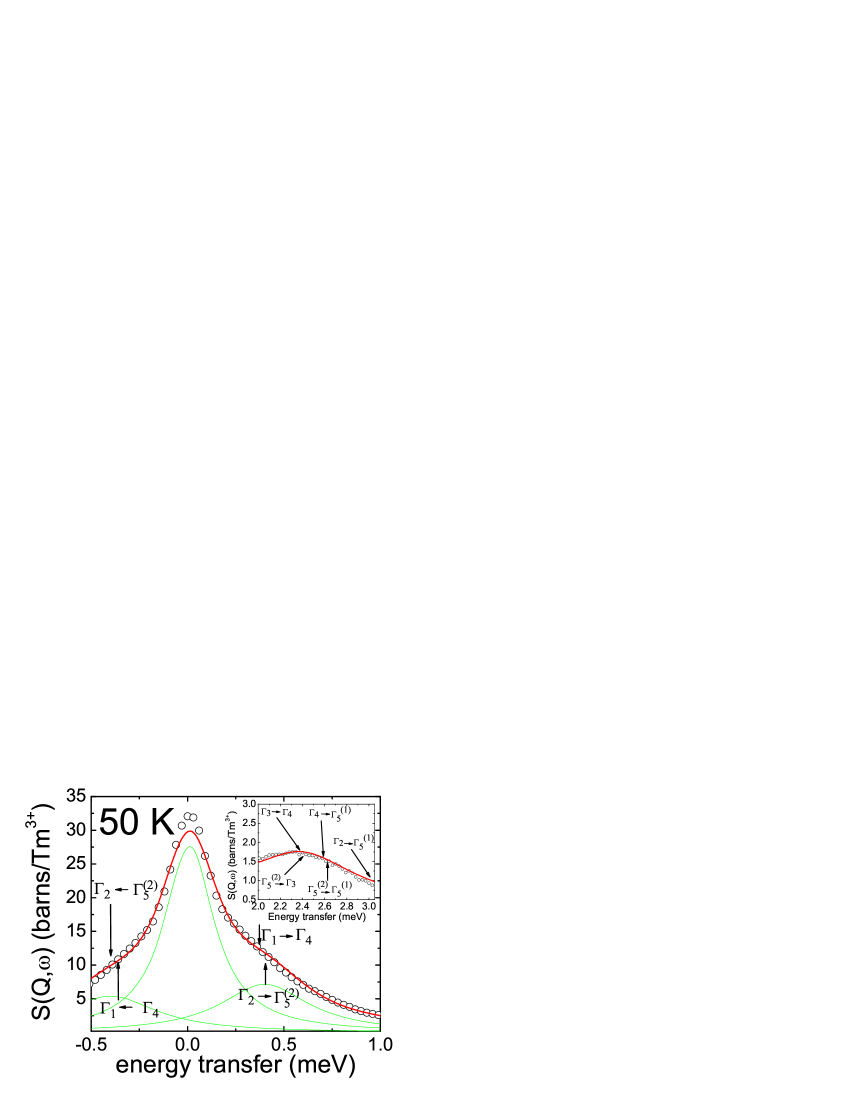
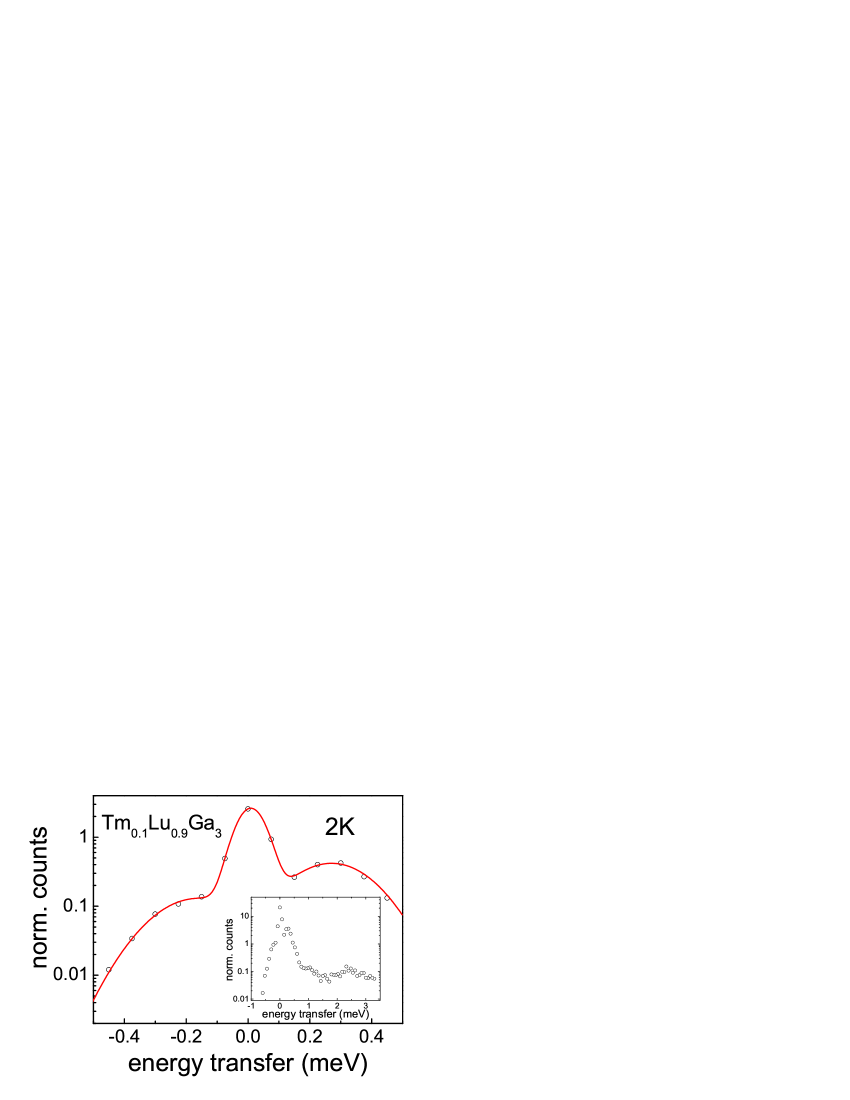
In order to better resolve the energy regime below 4 meV, we performed measurements using lower incident energies on the cold source TOF spectrometer IN6. To further improve the resolution in the regime below 1 meV, spectra of the diluted system Lu0.9Tm0.1Ga3 were taken in the cold neutron regime on ILL’s triple-axis spectrometer IN12. Fig.3 displays a typical INS spectrum of TmGa3 measured on IN6 at 5K in the paramagnetic regime and of Lu0.9Tm0.1Ga3 obtained with the triple-axis spectrometer IN12 at 2K. The spectrum of TmGa3 clearly shows a broad structured mode centered at 2.6meV with a FWHM of 0.8meV, larger than the experimental resolution. This broadening indicates that this mode consists of several overlapping lines, as will be discussed in detail below. A strong mode overlapping with the elastic line on the energy-loss side is now well resolved. It becomes more clearly visible as a mode separated from the elastic line in the IN12 spectra of Lu0.9Tm0.1Ga3 at 2K.
To fit the INS spectra we used the program Rotter (2004) which provides the INS total scattering cross section (in barn/ion) for a transition from level to at a set temperature with the partition function and with LLW parameters and giving the CEF energies according to eq. (20).
| (20) |
An additional program was set up to fit the spectra using a wide range of and using a Lorentzian lineshape broadening of the modes. To fit the spectral range close to origin we also included an elastic peak.
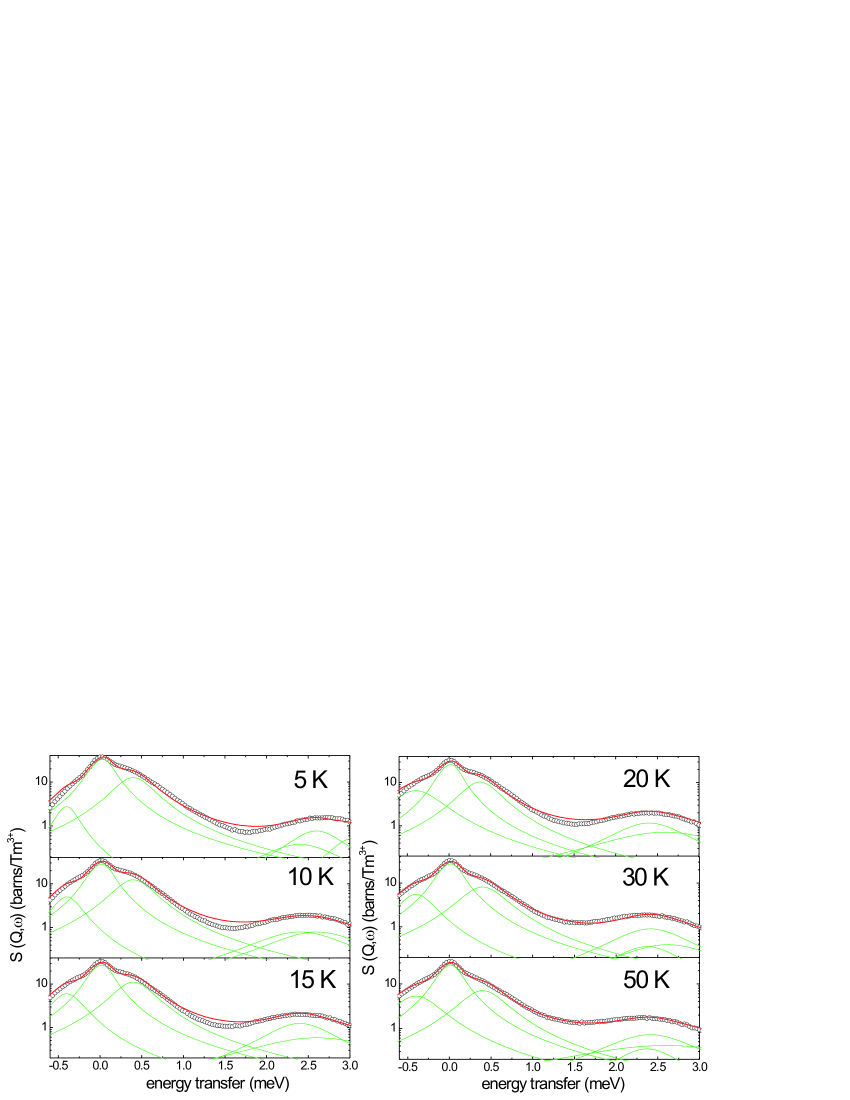
Using the data collected on IN6 for six temperatures 5, 10, 15, 20, 30 and 50 K and using the estimate for and as obtained from the IN4 spectra as starting values, we fitted the spectra using the intensities and energies listed in Table 1. Good fits over the whole temperature range up to 50K were obtained for all temperatures with
| (21) |
The fits for all temperatures taken on IN6 are shown in fig 4. Due to there being many transitions very close to each other (see table 1) the modes at 2.37 and 2.41 meV were merged into one mode. As well as the peaks at 2.59 and 2.61 meV and also the levels at 0.34 and at 0.40 meV. The transition at 3.03 meV is increasingly intense at lower temperatures (see table 1) and was included into the fit at 5 and 10 K. Figure 4 gives the comparison of experiment and calculated spectra.
| (barn/ion) | |||||||
|---|---|---|---|---|---|---|---|
| E (meV) | 5K | 10K | 15K | 20K | 30K | 50K | |
| 0.4 | 7.14 | 5.07 | 4.30 | 3.86 | 3.37 | 2.94 | |
| 0.34 | 6.75 | 5.37 | 4.73 | 4.33 | 3.85 | 3.41 | |
| -0.4 | 2.85 | 3.20 | 3.17 | 3.07 | 2.89 | 2.68 | |
| -0.34 | 3.08 | 3.63 | 3.64 | 3.56 | 3.38 | 3.15 | |
| 2.41 | 1.35 | 1.52 | 1.50 | 1.46 | 1.37 | 1.27 | |
| 2.63 | 0.79 | 0.88 | 0.87 | 0.85 | 0.80 | 0.74 | |
| 2.37 | 0.44 | 0.52 | 0.52 | 0.51 | 0.48 | 0.45 | |
| 2.59 | 0.91 | 1.07 | 1.08 | 1.05 | 1.00 | 0.93 | |
| 3.03 | 1.34 | 0.95 | 0.8 | 0.72 | 0.63 | 0.55 | |
Further analysis of the transitions shows that at 30 and 50 K the agreement with the fit profiles and the measurement is always better than at lower temperatures. Especially at lower temperatures it became increasingly difficult to fit the energy range between the transition at 0.4 meV and 2.5 meV. One can see that at 20K the agreement with the data and the fit is good for the transition energies and the energy regions around them, but for the part of the spectrum between 1 meV and 1.5 meV there is a gap between the fit and the data, this persists from 20 to 5 K. The reason for this discrepancy may be due to a quasielastic contribution which one would expect to decrease with increasing temperature. A quasielastic line was not included in the fits. Additionally, at these low energies, there could also be some broadening due to magnetic dispersion.
The 50 K spectrum in comparison with the fit is displayed in more detail in fig. 5. The calculated energy positions of the modes according to Table 1 are also indicated. The final CEF level scheme with the parameters given in eq.(22) is shown in fig 6 with a comparison to the CEF level scheme proposed by Morin et al.. Morin et al. (1987a) The most intense transitions () (cf. Table 1) are shown for energy gain and loss.

In order to reduce magnetic and quadrupolar and exchange interaction between the Tm moments we studied the diluted Tm sample, Tm0.1Lu0.9Ga3 . Heat capacity measurements on these sample showed no magnetic or quadrupolar ordering down to 1.8 K (see below).
The spectrum at 2 K around the elastic peak measured on IN12 on the diluted sample is shown in fig 7. The insert displays the full spectrum at 2 K. The transitions at 0.3 meV can be clearly resolved being well separated from the elastic peak. The mode at 2.6meV is also seen but it is as broad as for the concentrated TmGa3 sample. Additionally, there is a small feature at 1 meV which is not seen in the other data on IN4 on the Tm concentrated compound TmGa3 and IN6. Data taken at 10 K also showed similar features as those at 2 K, including the peak at 1 meV. We tentatively ascribe this extra feature to a splitting of the third excited state. Such a splitting is probably caused by some slight local deviations from cubic symmetry due to the random substitution of the Lu sites by Tm atoms in the diluted system Tm0.1Lu0.9Ga3. Such a splitting could also be the reason why the mode at 2.6meV is as broad as in the concentrated sample. By inspecting the relative intensities and also the energy positions, we find slight deviations in and from the pure TmGa3 to the diluted case, which can be expected because of the slightly different lattice metrics of LuGa3 with respect to that of TmGa3. Such a slight reduction of the parameter for single ion CEF splitting of Tm in LuGa3 and TmGa3 is also confirmed by the analysis of the specific heat data (see below).
The best fit of the CEF spectra of Tm0.1Lu0.9Ga3 is obtained with the parameter set
| (22) |
IV.3 Specific Heat and Magnetisation Measurements
Our INS results indicate a CEF scheme for TmGa3 which is significantly different from that proposed by Morin et al.. A characteristic feature of our CEF scheme is a separation of the CEF levels into two groups about 2 meV apart. The low energy group contains 4 CEF states ( , (2) and ) with an overall splitting of less than 5K. The splitting of the CEF levels in the group around 2 meV ( and ) is even smaller and amounts to 2K. The small overall excitation energies of the CEF level scheme of 25 K allow us to observe their contributions, , to the total heat capacity at low temperatures and to clearly distinguish these magnetic contribution from phonon contributions which, at low temperatures, decrease rapidly according to . In order to determine the magnetic contribution to the heat capacity, we measured the heat capacity of samples with the composition Lu1-xTmxGa3 (=0.05 and 0.1) in the temperature range 1.8 - 40 K and of TmGa3 in the range 2 - 100 K and compared their heat capacities with the heat capacity of LuGa3, the latter representing the phonon contribution. Samples with Tm diluted into the diamagnetic host LuGa3 allow to isolate - within limitations of cluster formation with concomitant intercluster Tm - Tm interaction - the single ion CEF behavior and to follow, by increasing the Tm content, the effects of exchange and quadrupolar interaction.
Fig 8 shows the resulting difference heat capacities scaled by 1/0.05, 1/0.1 and 1 for Lu0.95Tm0.05Ga3, Lu0.9Tm0.1Ga3 and for TmGa3, respectively. In order to compensate for small mismatches of the high temperature data between Lu0.95Tm0.05Ga3 and LuGa3, the heat capacity of LuGa3 was adjusted by the factor 0.995 such that at high temperatures the resulting difference magnetic heat capacities fall off . Also shown in Fig 8 are the magnetic heat capacities calculated from our CEF level scheme and for that given by Morin et al..Morin et al. (1987a) In contrast to the expected scenario according to the CEF scheme proposed by Morin et al. our data reveal essential magnetic contributions only up to about 30 K. They split into two characteristic anomalies: A broad Schottky-type contribution, with the maximum at 10K, followed by a sharp increase towards lowest measuring temperatures. These features are very well reproduced by the calculations using the CEF level scheme derived from our INS measurements. By doubling the Tm concentration i.e. going from Lu0.95Tm0.05Ga3 to Lu0.9Tm0.1Ga3, the dip around 5 K between both anomalies is somewhat smeared out and the low temperature increase becomes slightly more pronounced. TmGa3 shows a very sharp -like anomaly at the AFQ and AFM ordering temperature near 4.27(1)K and a broad Schottky-like anomaly centered at 10K, very similar to those observed for the diluted systems but somewhat more smeared, with a long tail clearly visible up to temperatures 35K. It appears that the magnetic entropy gained in the diluted systems below 5K for TmGa3 merged into the very sharp anomaly near the long-range ordering point.
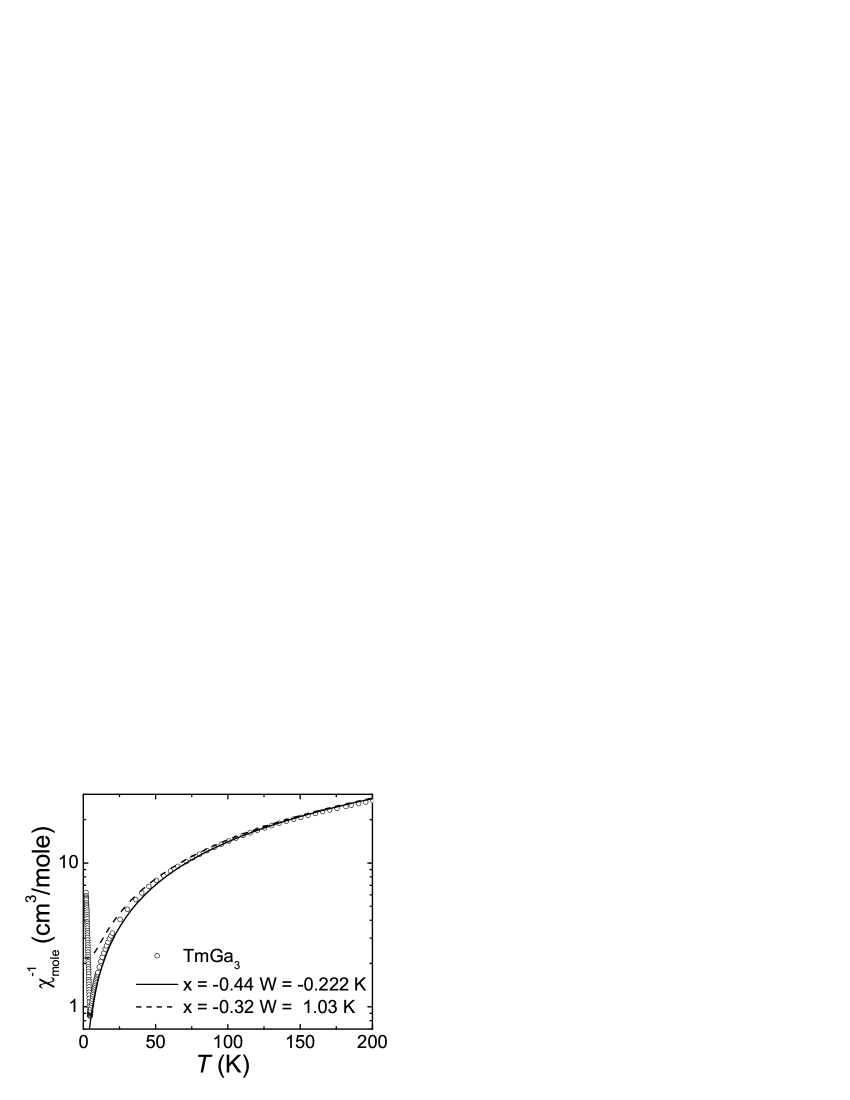
Simulating the temperature dependant susceptibility and the magnetisation provides another way of testing the CEF parameters. Fig. 9 shows a plot of the inverse susceptibility in the range of 2 K to 200 K. The susceptibilties obtained from the CEF parameters as obtained by our inelastic neutron spectroscopy agree well with the experimental data above the transition temperatures. Differences of the simulated susceptibilities using the CEF parameters and given by Morin et al.Morin et al. (1987b) to the experimental data appear below 50 K. The good agreement of the fit lends further support to our CEF scheme.
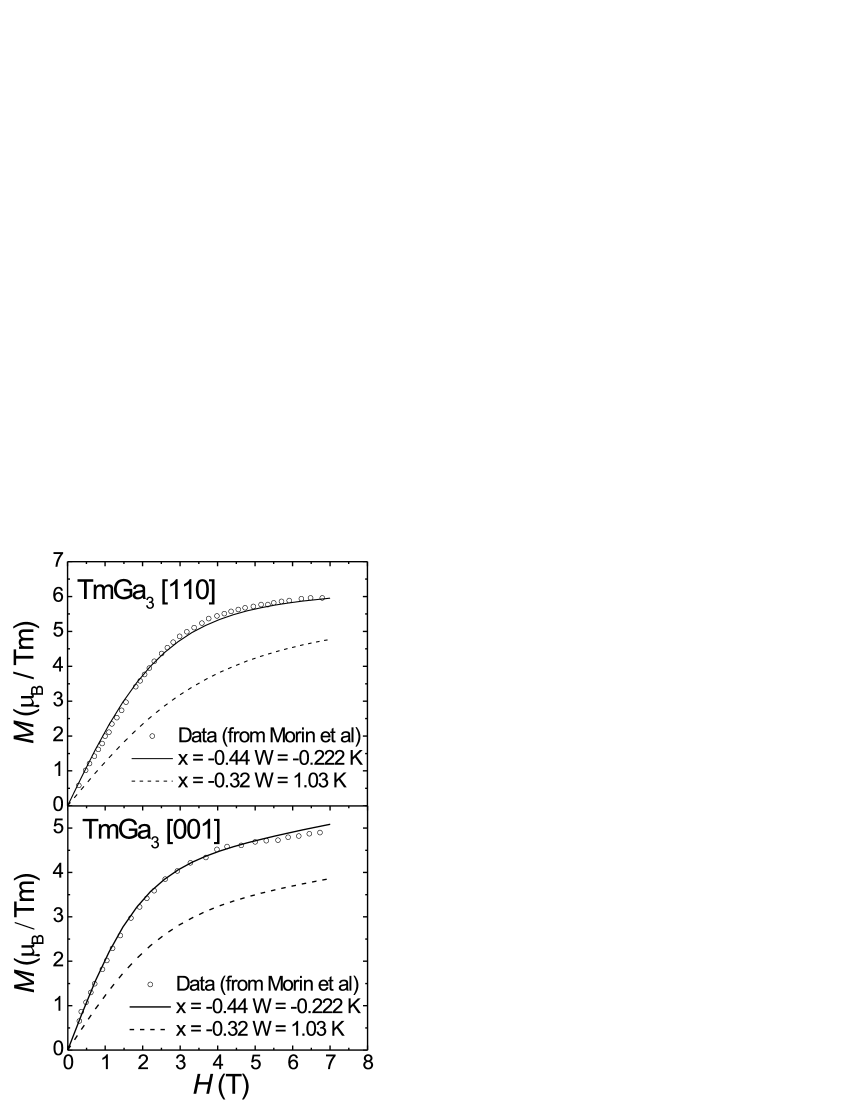
The magnetisation of TmGa3 in the paramagnetic phase with magnetic field applied along some main symmetry directions was also calculated in order to check for consistency with our CEF model. The results are shown in fig 10 in comparison with data collected at 10K by Morin et al. along [001] and [110] directions.Morin et al. (1987b) We also display the magnetisations calculated using the CEF scheme proposed earlier by Morin et al. which leads to significant discrepancies. In contrast, our CEF scheme provides an almost perfect description of the magnetism of TmGa3 in the paramagnetic phase.
IV.4 Effect of a tetragonal distortion on the CEF level scheme
The analysis of the heat capacity and the magnetisation of TmGa3 and the samples Lu1-xTmxGa3 provide very strong evidence that the parameter set = -0.44 and = -0.22 K obtained from the INS measurements describe the CEF scheme of Tm3+ in TmGa3 correctly. We now discuss possible effects of the quadrupolar ordering on the CEF level scheme. Quadrupolar ordering lowers the cubic symmetry and one has to consider additional terms and in the CEF Hamiltonian (see eq. (9)). If one continuously turns on the term a splitting of the levels as shown in fig 11 results. The low energy states become mixed already for small values of being of the order of = -0.3 K as reported Gubbens et al. based on Mössbauer spectroscopy data.Gubbens et al. (1986)
V Discussion
Our new set of crystal field parameters as obtained from inelastic neutron scattering give thermodynamic properties which agree very well with the experimental data. We have shown that the CEF scheme proposed by Morin et al. disagrees with thermodynamic properties and should be discarded. As the crystal field energy levels in TmGa3 are very close to each other, and are all below 4 meV, determining such a level scheme is difficult. To ensure that we have the correct parameter set, we have performed a number of tests. First, using the results of Murasik for ErGa3, by EPR measurement on doped Er samples, we have confirmed that the level scheme by Murasik et al. is correct. We have then scaled these values to give us an approximation of where in the parameter space the correct values of and for TmGa3 could be. As neutron spectroscopy allows the best determination of such parameters, we have fitted numerous spectra and determined values that best suit all spectra. These values have been taken to calculate thermodynamic properties, such as the Schottky anomalies in the specific heat and the temperature dependant susceptibility as well as the magnetisation in several lattice directions. The agreement with the values obtained by inelastic neutron spectroscopy and the thermodynamic properties assures us that we have obtained the correct parameter set. Due to the small energy range of the whole CEF level scheme AFQ ordering in TmGa3 must involve an essential mixing of the CEF levels. Our results can be used for further measurements in the ordered phase in order to understand the complex and interesting competition between orbital and magnetic ordering in TmGa3.

Acknowledgements.
We thank E. Brücher for assistance with the SQUID measurements, W. Schmidt for help with the IN12 measurements as well as M. Rotter and K. U. Neumann for enlightening discussions.References
- Effantin et al. (1985) J. M. Effantin, J. Rossat-Mignod, P. Burlet, H. Bartholin, S. Kunii, and T. Kasuya, J. Magn. Magn. Mat. 47, 145 (1985).
- Onimaru et al. (2005) T. Onimaru, T. Sakakibara, N. Aso, H. Yoshizawa, H. S. Suzuki, and T. Takeuchi, Phys. Rev. Lett 94, 197201 (2005).
- Bauer et al. (2006) E. D. Bauer, P.-C. Ho, M. B. Maple, T. Schauerte, D. L. Cox, and F. B. Anders, Phys. Rev. B 73, 094511 (2006).
- Kaneko et al. (2007) K. Kaneko, N. Metoki, R. Shiina, T. D. Matsuda, M. Kohgi, K. Kuwahara, and N. Bernhoeft, Phys. Rev. B 75, 094408 (2007).
- Pourret et al. (2006) A. Pourret, K. Behnia, D. Kikuchi, Y. Aoki, H. Sugawara, and H. Sato, Phys. Rev. Lett 96, 176402 (2006).
- Walker et al. (2006) H. C. Walker, K. A. McEwan, D. F. McMorrow, S. B. Wilkins, F. Wastin, E. Colineau, and D. Fort, Phys. Rev. Lett 97, 137203 (2006).
- Lüthi et al. (1979) B. Lüthi, R. Sommer, and P. Morin, J. Magn. Magn. Mat. 13, 198 (1979).
- Morin and Schmitt (1980) P. Morin and D. Schmitt, J. Magn. Magn. Mat. 21, 243 (1980).
- Czopnik et al. (1985) A. Czopnik, N. Iliew, B. Staliéski, H. Mädge, C. Bazan, and R. Pott, Physica B 130, 262 (1985).
- Link et al. (1979) P. Link, A. Gukasov, J.-M. Mignot, T. Matsumura, and T. Suzuki, Phys. Rev. Lett. 80, 4779 (1979).
- Morin et al. (1987a) P. Morin, M. Giraud, P. L. Regnault, E. Roudaut, and A. Czopnik, J. Magn. Magn. Mat. 66, 345 (1987a).
- Lea et al. (1962) K. Lea, M. Leask, and W. Wolf, J. Phys. Chem. Solids 23, 1381 (1962).
- Gubbens et al. (1986) P. C. M. Gubbens, A. M. V. der Kraan, and K. H. J. Buschow, Hyperfine Interactions 29, 1343 (1986).
- Abragam and Bleaney (1970) A. Abragam and B. Bleaney, Electron Paramagnetic Resonance of Transition Ions (Oxford University Press, 1970).
- Walter (1982) U. Walter, Ph.D. thesis, Institut für Festkörperforschung Jülich (1982).
- Walter and Holland-Moritz (1981) U. Walter and E. Holland-Moritz, Z. Phys. B - Condensed Matter 45, 107 (1981).
- Freeman and Watson (1962) A. J. Freeman and R. E. Watson, Phys. Rev. 127, 2058 (1962).
- T. O. Brun and Felcher (1971) G. H. L. T. O. Brun and G. P. Felcher, Bull. Am. Phys. Soc. 16, 325 (1971).
- Murasik et al. (2000) A. Murasik, A. Czopnik, E. Clementyev, and J. Schefer, J. Magn. Magn. Mat. 222, 101 (2000).
- Birgeneau et al. (1966) R. J. Birgeneau, M. T. Hutchings, and R. N. Rogers, Phys. Rev. Lett. 16, 1584 (1966).
- Birgeneau et al. (1969) R. J. Birgeneau, M. T. Hutchings, J. M. Baker, and J. D. Riley, J. Appl. Phys. 40, 1070 (1969).
- Canfield and Fisk (1992) P. C. Canfield and Z. Fisk, Phil. Mag. B 65, 1117 (1992).
- Rotter (2004) M. Rotter, J. Magn. Magn. Mat. 272-276, e481 (2004), program available at www.mcphase.de.
- Hirst (1969) L. L. Hirst, Phys. Rev. 181, 597 (1969).
- Orbach (1961) R. Orbach, Proc. Roy. Soc. (London) A264, 458 (1961).
- Low (1960) W. Low, Phys. Rev. 118, 1608 (1960).
- Pake and Estle (1973) G. E. Pake and T. L. Estle, Paramagnetic Resonance, The Physical Principles of Paramagnetic Resonance (W. A. Benjamin, 1973).
- Tao et al. (1971) L. J. Tao, D. Davidov, R. Orbach, and E. P. Chock, Phys. Rev. B 4, 5 (1971).
- Barnes (1981) S. E. Barnes, Ph.D. thesis, Departement de Physique de la Matire Condense, CH 1211 Genéve (1981).
- Dodds et al. (1978) S. A. Dodds, J. Sanny, and R. Orbach, Phys. Rev. B 18, 1016 (1978).
- Morin et al. (1987b) P. Morin, M. Giraud, P. Burlet, and A. Czopnik, J. Magn. Magn. Mater 68, 107 (1987b).