H i Imaging Observations of Superthin Galaxies. II. IC 2233 and the Blue Compact Dwarf NGC 2537
Abstract
We have used the Very Large Array to image the H i 21-cm line emission in the edge-on Sd galaxy IC 2233 and the blue compact dwarf NGC 2537. We also present new optical , , and H imaging of IC 2233 obtained with the WIYN telescope. Despite evidence of localized massive star formation in the form of prominent H ii regions and shells, supergiant stars, and a blue integrated color, IC 2233 has a low surface brightness disk with a very low global star formation rate ( yr-1), and no significant 21-cm radio continuum emission. The H i and ionized gas disks of IC 2233 are clumpy and vertically distended, with scale heights comparable to that of the young stellar disk. Both the stellar and H i disks of IC 2233 appear flared, and we also find a vertically extended, rotationally anomalous component of H i extending to 2.4 kpc from the midplane. The H i disk exhibits a mild lopsidedness as well as a global corrugation pattern with a period of kpc and an amplitude of pc. To our knowledge, this is the first time corrugations of the gas disk have been reported in an external galaxy; these undulations may be linked to bending instabilities or to underlying spiral structure and suggest that the disk is largely self-gravitating.
Lying at a projected distance of from IC 2233, NGC 2537 has an H i disk with a bright, tilted inner ring and a flocculent, dynamically cold outer region that extends to 3.5 times the extent of the stellar light (). Although NGC 2537 is rotationally-dominated, we measure H i velocity dispersions as high as km s-1 near its center, indicative of significant turbulent motions. The inner rotation curve rises steeply, implying a strong central mass concentration. Our data indicate that IC 2233 and NGC 2537 do not constitute a bound pair and most likely lie at different distances. We also find no compelling evidence of a recent minor merger in either IC 2233 or NGC 2537, suggesting that both are examples of small disk galaxies evolving in relative isolation.
1 Introduction
This is the second in our series of papers presenting H i imaging observations of edge-on, pure-disk galaxies obtained with the Very Large Array (VLA)111The Very Large Array of the National Radio Astronomy Observatory is a facility of the National Science Foundation, operated under cooperative agreement by Associated Universities, Inc.. We are focusing on ‘superthin’ Sd galaxies that are characterized by their highly flattened, dynamically cold stellar disks and the absence of a visible spheroid component (Goad & Roberts 1981). The structural simplicity and edge-on orientation of superthins makes these galaxies excellent laboratories for exploring how internal versus external processes regulate many of the key properties of late-type disk galaxies, including their structures and star formation histories. For example, the abundance of thin, bulgeless disks in the local universe (Karachentsev et al. 1999; Kautsch et al. 2006) poses challenges for hierarchical galaxy-formation models in which galaxies are built-up through violent mergers (Abadi et al. 2003; D’Onghia & Burkert 2004; Eliche-Moral et al. 2006; Kormendy & Fisher 2005 and references therein). The superthin disks that we are studying also inhabit a particularly interesting galactic mass range (100 km s-1), where important changes in the structure and composition of the interstellar medium have been noted (Dalcanton et al. 2004; Matthews et al. 2005). Complementary studies of both stellar and interstellar components are necessary to understand the physics behind these changes and, in turn, how they affect the regulation of star formation. Finally, it is well established that the thinnest galaxies tend to be chemically unevolved systems of low optical surface brightness (Goad & Roberts 1981; Bergvall & Rönnback 1995; Matthews et al. 1999; Gerritsen & de Blok 1999). Thus, the vertical structure of superthin galaxies provides information relevant to understanding the overall disk structure and mass distribution of low surface brightness (LSB) galaxies in general.
In a previous paper (Uson & Matthews 2003; hereafter Paper I), we presented VLA observations of the isolated, LSB superthin spiral UGC 7321. Here we turn to IC 2233 (= UGC 4278). In addition to new VLA H i observations (§6), we present optical , and H imaging of IC 2233 obtained with the WIYN telescope (§3). IC 2233 has a comparable physical size and luminosity to UGC 7321, and both are weak infrared sources with very low current star formation rates. However, IC 2233 is slightly less massive and has a slightly higher optical surface brightness. And while both systems are H i-rich and exhibit bulgeless, highly flattened stellar disks with minimal dust absorption, our new optical and H i imaging study has uncovered some interesting differences in the kinematics of these two galaxies and in the structures of their ionized and neutral gas disks.
One of the goals of our VLA study of superthin, edge-on spiral galaxies is to explore the role of environment in shaping the structure, kinematics, and evolution of these dynamically cold and seemingly “fragile” disk systems. While UGC 7321 appears to be an extremely isolated galaxy (Paper I), we targeted IC 2233 because of the presence of a second galaxy at a projected separation of and a radial velocity difference of km s-1: the blue compact dwarf galaxy (BCD) NGC 2537 (= UGC 4274 = Arp 6 = Mrk 86 = “The Bear’s Paw”). We observed NGC 2537 simultaneously with the VLA, and our new observations highlight several interesting features of this galaxy (§8.2). However, we find that IC 2233 and NGC 2537 do not appear to be physically associated and that a mutual tidal interaction is unlikely to have shaped the properties of either galaxy. Indeed, like UGC 7321, both IC 2233 and NGC 2537 appear to be examples of low-mass disk galaxies evolving in relative isolation (§2,§9.1,§9.2).
2 The IC 2233 and NGC 2537 Field
The existence of a true physical association between IC 2233 and NGC 2537 has been a matter of previous debate (see de Vaucouleurs et al. 1976; Schneider & Salpeter 1992; Oosterloo 1993; Gil de Paz et al. 2000a, Wilcots & Prescott 2004). Their surrounding field also contains a number of fainter galaxies whose relationship to our targets has remained unclear. Recently, some new insight has been provided by observations from the Sloan Digital Sky Survey (SDSS).222Funding for the creation and distribution of the SDSS Archive has been provided by the Alfred P. Sloan Foundation, the Participating Institutions, the National Aeronautics and Space Administration, the National Science Foundation, the U.S. Department of Energy, the Japanese Monbukagakusho, and the Max Planck Society. The SDSS Web site is http://www.sdss.org/. The SDSS is managed by the Astrophysical Research Consortium (ARC) for the Participating Institutions. The Participating Institutions are The University of Chicago, Fermilab, the Institute for Advanced Study, the Japan Participation Group, The Johns Hopkins University, Los Alamos National Laboratory, the Max-Planck-Institute for Astronomy (MPIA), the Max-Planck-Institute for Astrophysics (MPA), New Mexico State University, University of Pittsburgh, Princeton University, the United States Naval Observatory, and the University of Washington.
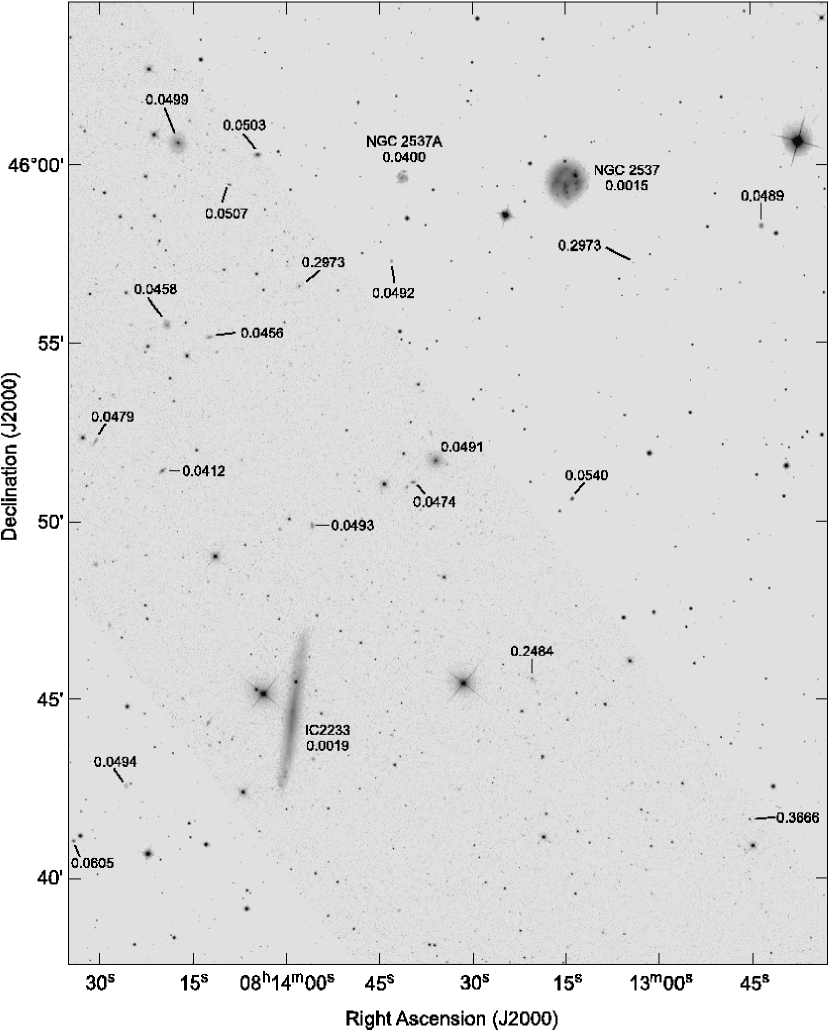
We have obtained the publically available spectra and five-band photometry of the galaxies observed by the SDSS within one degree of the position of IC 2233. Figure 1 is a grey-scale representation of a composite , , mosaic frame of the field with the SDSS redshifts of the galaxies indicated. The SDSS spectra confirm the redshifts of IC 2233 (0.0019) and NGC 2537 (0.0015), but also reveal a group of galaxies at that includes NGC 2537A, whose association with NGC 2537 had been uncertain (see Davis & Seaquist 1983, Gil de Paz et al. 2000a). It now appears likely that a prior report of a redshift for NGC 2537A equal to that of NGC 2537 was due to confusion of the two galaxies in a single-dish H i measurement. Indeed, we have not detected any H i emission toward NGC 2537A with the VLA. As described in §9.1, we have also performed a systematic search for other gas-rich neighbors to IC 2233 and NGC 2537, but have not identified any candidates.
The association between IC 2233 and NGC 2537 has remained controversial because previous distance estimates for both galaxies span a range of values. Assuming that the galaxies are at rest with respect to the cosmic background radiation leads to corrected recessional velocities of km s-1(IC 2233) and km s-1(NGC 2537) and Hubble-flow distances of Mpc (IC 2233) and Mpc (NGC 2537), with a formal uncertainty of 5% (assuming a Hubble constant of 71 km s-1 Mpc-1).
Estimates of the distance to IC 2233 derived from velocity flow models range from 10.4-10.9 Mpc (Tully 1988; Schwarzkopf & Dettmar 2000; García-Ruiz et al. 2002). From the -band Tully-Fisher relation, García-Ruiz et al. (2002) derived a distance of 8.1 Mpc, while, using the -band Tully-Fisher relation, Gil de Paz et al. (2000a) stated that IC 2233 is located at a distance of 13 Mpc (quoting an unpublished, private communication; these estimates all assumed a Hubble constant of 75 km s-1 Mpc-1). Based on Hubble Space Telescope (HST) data from Seth et al. (2005), Tikhonov et al. (2006) recently derived a distance to IC 2233 of Mpc using the “tip of the red-giant branch” method. However, the uncertainty quoted by these latter authors appears to be purely statistical, without allowing for the uncertainties in the zero-point calibration and metallicity corrections. Re-analyzing the same data, A. Seth (private communication) finds a distance modulus of 30.25 using an edge-detection algorithm and 30.11 using a Monte-Carlo approach (see Seth et al. 2005 for details on these methods). The difference is indicative of the low signal-to-noise of the data. Taking into account the uncertainty in the zero-point calibration and metallicity corrections therefore raises the uncertainty in the distance to IC 2233 determined with this method to Mpc.
In the case of NGC 2537, Tully (1988) estimated a distance of 9 Mpc based on a peculiar velocity flow model of the local supercluster. More recently, Sharina et al. (1999) derived a distance of 6.9 Mpc based on the magnitudes of its brightest resolved stars.
Given the uncertainties in the distances to both NGC 2537 and IC 2233, we cannot exclude with absolute certainty the possibility of a true physical association between them. However, as we argue in §9.1, even if they do lie at the same distance, it appears unlikely that either galaxy has been significantly influenced by a mutual interaction. For the present work we adopt 10 Mpc for IC 2233 and =7 Mpc for NGC 2537, but throughout the paper, we indicate the distance dependence of all physical quantities using the symbols and to denote the true distances to the galaxies in units of 10 Mpc and 7 Mpc, respectively.
3 Optical Imaging and Photometry of IC 2233
3.1 Observations and Data Reduction
Harris and CCD imaging observations of IC 2233 were obtained on 1997 November 7 using the 3.5-m WIYN telescope333The WIYN Observatory is a joint facility of the University of Wisconsin-Madison, Indiana University, Yale University, and the National Optical Astronomy Observatory. at Kitt Peak, AZ. Deeper and images, as well as a narrow-band H+[N ii] image were obtained with the same observing setup on 1999 January 19 under non-photometric conditions. The H+[N ii] image was obtained with the WIYN filter with a bandpass of 73Å, centered at 6570Å.
The imaging camera employed a thinned STIS 20482048 CCD with pixels, giving a field of view of per side. The gain was per ADU and the readout noise was per pixel. Exposure times were 550 seconds in and 180 seconds in during the 1997 observations, and 900 seconds in , 750 seconds in , and 1200 seconds in H during the 1999 observations. Seeing during the 1997 run was and during the 1999 run was -.
The images were processed using standard IRAF444IRAF is distributed by the National Optical Astronomy Observatories, which is operated by the Associated Universities for Research in Astronomy, Inc., under cooperative agreement with the National Science Foundation. routines. Overscan and bias levels were subtracted from individual frames and the data were flat-fielded using an average of 5 dome flats taken with the appropriate filter. This yielded images flat to % in and to better than 1% in . A single bad column in the CCD was corrected via interpolation from the adjacent two columns.
During the 1997 November run we derived calibrations by observing standard fields from Landolt (1992) at three different air masses. The data show excess scatter with respect to the best-fit secant law, which suggests that some cirrus might have been present during part of the night. These uncertainties are reflected in the rather large errors in the photometry listed in Table 1.
Photometry of IC 2233 was performed using a single elliptical aperture. Foreground stars, cosmic rays, and background galaxies were removed first via background interpolation from surrounding regions. Sky brightness levels were determined by measuring the mean sky counts in several boxes at different locations on the image.
Basic photometric parameters for IC 2233 are presented in Table 1. Total errors in the magnitude measurements were computed following Matthews & Gallagher (1997) and take into account sky, flat-field, and Poisson errors as well as the formal uncertainty in the photometric solution. They are dominated by the calibration uncertainties described in the previous paragraph. We have corrected all quantities for Galactic extinction following Schlegel et al. (1998). Our new measurements (excluding corrections for Galactic extinction) agree within the uncertainties with those published by de Vaucouleurs et al. (1991; =13.480.18) and Swaters & Balcells (2002; =12.530.02).
| Parameter | Value | Ref. |
|---|---|---|
| (J2000.0) | 08 13 58.9 | 1 |
| (J2000.0) | +45 44 34.3 | 1 |
| Hubble type | Sd | 2 |
| DistanceaaWe adopt a distance of 10 Mpc (see text). Distance-dependent quantities are scaled in terms of , the actual distance in units of 10 Mpc. | 8–12 Mpc | 2 |
| (mag) | 0.223 | 3 |
| (mag) | 0.138 | 3 |
| Measured Quantities | ||
| Position angle | 2 | |
| Inclination | 2 | |
| bbMeasured at an -band surface brightness of 25.5 mag arcsec-2. | 7.0 | 2 |
| bbMeasured at an -band surface brightness of 25.5 mag arcsec-2. | 2 | |
| c,c,footnotemark: ddCorrected for foreground extinction only. | 2 | |
| d,d,footnotemark: eeError estimate includes mag formal error and 0.05 mag zero point uncertainty. | 2 | |
| ddCorrected for foreground extinction only. | 2 | |
| ffMeasured central surface brightness corrected for foreground extinction | 21.3 mag arcsec-2 | 2 |
| ggDisk scale length based on truncated exponential fit. | 32 2′′ | 2 |
| ggDisk scale length based on truncated exponential fit. | 29 2′′ | 2 |
| hhDisk scale height based on exponential fit along the minor axis. | 2 | |
| Derived Quantities | ||
| bbMeasured at an -band surface brightness of 25.5 mag arcsec-2. | 15.0 kpc | 2 |
| iiCorrected for internal extinction (0.70 mag) following Tully et al. 1998. | 2 | |
| iiCorrected for internal extinction (0.70 mag) following Tully et al. 1998. | 1.8 | 2 |
| kkDeprojected central surface brightness based on truncated exponential fit including finite disk thickness and corrected for internal and foreground extinction. | 22.6 mag arcsec-2 | 2 |
| llUncorrected for the contribution of [N ii]. | erg s-1 | 2 |
| 1,2 | ||
Note. — Units of right ascension are hours, minutes, and seconds, and units of declination are degrees, arcminutes, and arcseconds.
References. — (1) NED database; (2) this work; (3) Schlegel et al. 1998.
3.2 Properties of the IC 2233 Stellar Disk
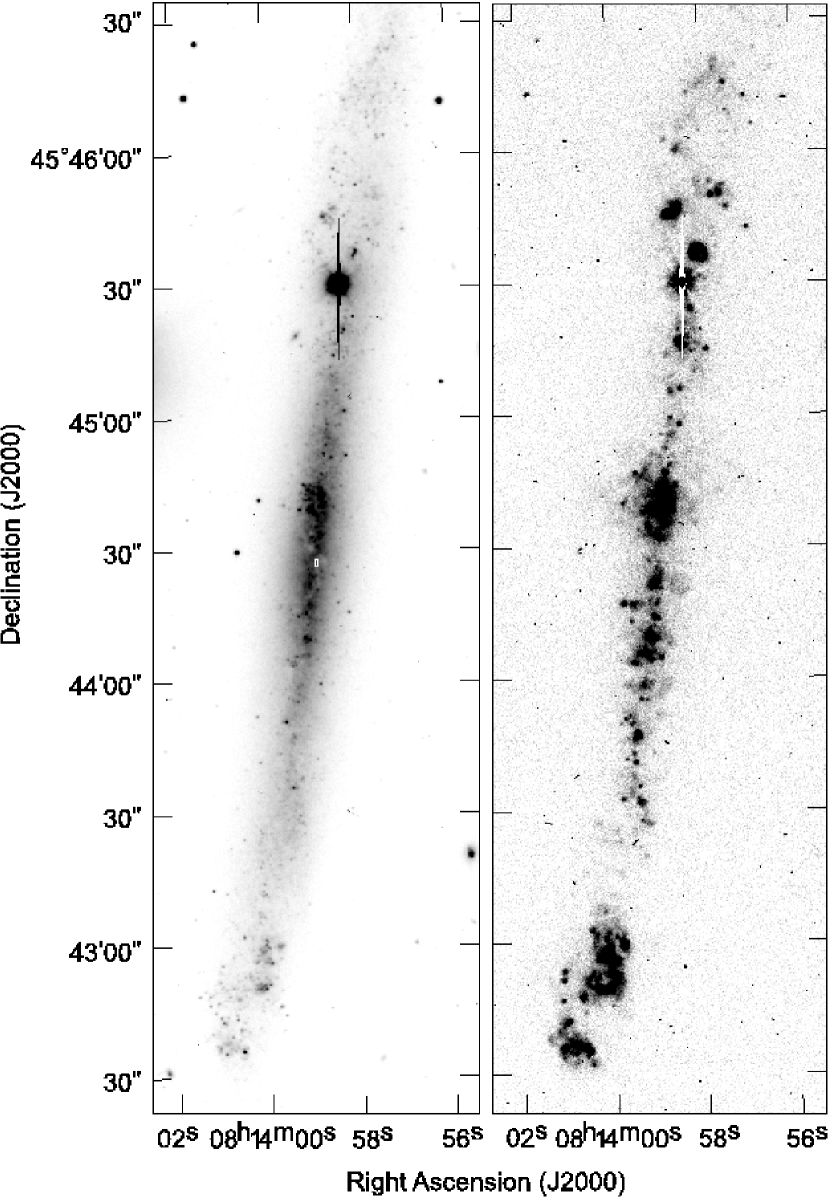
Our -band image of IC 2233 is presented in Figure 2 (left panel). Here we draw attention to a few key features of this image.
Examining first the central regions of IC 2233, we see that the galaxy shows no well-defined equatorial dust lane. Only a few small patches of extinction are evident in projection along the inner few kiloparsecs of the galaxy, together with a narrow dust structure inclined roughly 45∘ to the disk plane. This latter feature can be traced both above and below the mid-plane (Figure 2), and its center corresponds with the kinematic center of the galaxy (see §6.1.1). The nature of this minor axis dust lane is presently unclear; it could be dusty debris recently accreted onto IC 2233, or it may comprise material being expelled from a starburst nucleus or AGN, analogous to what is observed in M82 (Alton et al. 1999). However, Seth et al. (2006) reported no evidence for a nucleus in IC 2233. Another possibility is that it represents dense gas streaming along a vertical density perturbation such as a spiral arm.
Because of the lack of a true equatorial dust lane in IC 2233, it is difficult to determine precisely the inclination of the galaxy. Using the 25.5 mag arcsec-2 -band isophote (after correction for foreground extinction), we measure a semi-minor to semi-major axis ratio =0.14. This ratio is very close to the mean intrinsic flattening expected for Sd galaxies [0.15; Yuan & Zhu 2004], suggesting that IC 2233 is observed no more than a degree or two from edge-on. This is consistent with the small scale height of the stellar disk (see below) and the symmetry in the light distribution about the midplane. We therefore adopt .
We have estimated the radial scale length of the IC 2233 disk by fitting a truncated exponential model to the major-axis light profiles in the and bands. In the -band we derive (1.6 kpc) with a cutoff radius555Following Pohlen et al. 2000, we define the cutoff radius as the location where the radial surface brightness profile vanishes asymptotically into the noise. of 165′′ and in the -band we find (1.4 kpc) with a cutoff radius of 185′′. We caution however that an exponential does not provide an ideal fit to the major axis light profile of IC 2233; it significantly underestimates the amount of light in the intervals and in and in . Our scale length estimates should therefore be considered only as approximations to the more complex underlying stellar light distribution.
Perpendicular to the disk, the -band brightness profile along the minor axis of IC 2233 is well described by an exponential function with scale height (240 pc). This is somewhat larger than the -band scale height = reported by Seth et al. (2005)666For comparison of our exponential disk fits with the isothermal disk fits of Seth et al. 2005, we assume , where is the isothermal scale height.. However, this difference is consistent with other edge-on, late-type galaxies where scale heights are found to be systematically larger in -band compared with the near-infrared (Bizyaev & Mitronova 2002). In agreement with its identification as a superthin galaxy by Goad & Roberts (1981), the global scale height of IC 2233 is on the small end for Sd galaxies (cf. Bizyaev & Mitronova 2002; Seth et al. 2005), although it is notably thicker than the more massive superthin galaxy UGC 7321 ( pc; Matthews 2000). In addition, we see evidence that the stellar disk of IC 2233 flares at larger galactocentric radii (see below).
The excellent seeing during our 1999 observing run shows the disk of IC 2233 partially resolved into a number of bright, point-like sources. These features are most readily identifiable in the outer reaches of the disk, where they stand out strongly against the comparatively faint, diffuse underlying disk light. Our H image (discussed below) does not reveal any compact sources at these locations, implying that the majority of these are not compact H ii regions. Using aperture photometry, we have estimated magnitudes and colors for 38 point sources throughout the galaxy that appear to be unblended and do not correspond with bright, underlying H emission. After correction for foreground and internal extinction, the colors we estimate for these features lie in the range to 3.5, and absolute magnitudes range from to . These ranges of color and luminosity are consistent with a population of blue and red supergiant stars (Johnson 1966; Dohm-Palmer & Skillman 2002). While some of the bluer sources may be young or intermediate-age star clusters or associations, 15 of the sources have , making them redder than even the oldest globular clusters (e.g., Bridges et al. 1996). This is another indication that we are resolving a population of individual luminous stars. Using HST images, Seth et al. (2005) also identified a population of red and blue supergiants in a portion of the inner disk of IC 2233.
Supergiants represent massive stars that have depleted their core hydrogen, and those luminous enough to be identified in our ground-based images are likely to have ages of no more than 20 Myr (see Dohm-Palmer & Skillman 2002). This implies that these stars should still lie very near their birth locations. This makes the distribution of supergiant candidates in the outer disk of IC 2233 noteworthy, as they show no obvious concentration along the midplane, but rather a wide spread of heights. This trend is particularly striking compared with the steep, roughly exponential vertical light profile seen near the central parts of the galaxy and implies an overall flaring of the young stellar disk. We also see evidence for flaring in both the ionized and neutral layers in IC 2233 (see §3.3 & 6.2). Interestingly, the scale heights of the gaseous and stellar components appear to be roughly comparable in the outer disk of IC 2233—a factor that may be linked with the rather low global star-formation efficiency in this galaxy (see also Ferguson 1998; Ferguson et al. 1998; Matthews & Wood 2003).
3.3 The Ionized Gas in IC 2233
Our continuum-subtracted H+[N ii] image of IC 2233 is reproduced in Figure 2. Although our bandpass was broad enough to encompass the [N ii] lines at 6548Å and 6583Å in addition to H, the [N ii] emission in IC 2233 is known to be quite weak (Goad & Roberts 1981) and therefore should contribute minimally to this image.
The ionized gas distribution in IC 2233 has been studied previously by Rand (1996), who drew attention to plumes of emission extending to more than 1 kpc from the plane, near the center of IC 2233 (see also Miller & Veilleux 2003). These features are also visible in our Figure 2. Rand (1996) suggested that this vertically-extended emission may be due to an outflow from a central starburst. However, comparison with the accompanying broadband image in Figure 2 shows that the region from which the ionized plumes originate corresponds (in projection) to a knotty, extremely blue [] clump of starlight that is displaced from both the galaxy midplane and from the isophotal and kinematic centers of the galaxy. This region has an extent of pc. Its structure, size, and color are consistent with a cluster of multiple OB associations (Pietrzyński et al. 2005). The off-planar appearance of this “superassociation” and the lack of any other comparable features within the galaxy suggest the possibility that this could be a remnant from a dwarf intruder. This would be consistent with the very different emission line ratios found by Goad & Roberts (1981) for the central regions of IC 2233 compared with the southern end of the disk, although we find no kinematic evidence to support this hypothesis (see below; see also Garrido et al. 2004).
As also noted by Rand (1996), IC 2233 does not have a widespread extraplanar layer of ionized gas, consistent with the low global star formation rate of this galaxy. Nonetheless, as seen in Figure 2, the ionized emission exhibits a great deal of complex structure, ranging from small-scale features (compact H ii regions, filaments, and shells) to diffuse planar emission, to bright, giant H ii complexes.
The largest and most luminous H ii complex visible in IC 2233 is situated on the southern end of the disk. This region has a projected extension of more than kpc and contains 30% of the total H luminosity of IC 2233. The location of this complex well outside the central regions of the galaxy underscores that recent high-mass star formation in IC 2233 has not been centrally concentrated. Giant, off-center H ii complexes are also seen in other LSB galaxies with similar masses to IC 2233, such as the nearby, face-on LSB galaxy NGC 4395 (Wang et al. 1999). These complexes may be more prevalent in these low-mass disks with slowly rising rotation curves, since these systems lack the shearing forces that would tend to rapidly stretch and distort similar large-scale density enhancements in more massive spirals (Elmegreen & Hunter 2000). In addition, the weaker self-gravity and intrinsically thicker gas disks of small spirals may allow in general the formation of larger bound condensations (Kim & Ostriker 2006). Contrasting with these giant H ii complexes, some lines of sight through the IC 2233 disk show little H emission. This implies that the recent star formation in IC 2233 has been patchy and highly localized, perhaps occurring along loose spiral arms analogous to those visible in NGC 4395.
Turning to smaller scales, several shell- or bubble-like features of various surface brightnesses can be seen in the ionized ISM of IC 2233. One example is the circular, low surface brightness feature centered at , = +45∘44′ (Figure 2), which has a radius of ( pc) and a projected height of pc from the disk midplane. Its size and morphology are consistent with a wind-blown superbubble produced by an association of hot, young OB stars (Mac Low & McCray 1988). Supporting this interpretation, our and continuum images show a blue point source at the apparent center of the bubble.
Another interesting aspect of the ionized gas morphology of IC 2233 is that the various H ii regions and complexes in IC 2233 are not confined to a thin layer. This effect becomes more pronounced toward the outer parts of the galaxy, where a number of bright H ii regions or complexes appear to be displaced by or more from the midplane. The brightest H ii complexes also seem to trace a rather wavy pattern about the midplane, although we are unable to identify a clear correspondence between these undulations and the more well-defined corrugated pattern seen in the neutral hydrogen disk (§6.4). Overall, the complex, “frothy” H morphology of IC 2233 forms an interesting contrast to the much flatter ionized gas disk of the superthin galaxy UGC 7321, which shows very little complex structure and no sign of giant (kiloparsec-scale) H ii complexes (cf. Figure 7 of Matthews et al. 1999).
Although our H image is not flux-calibrated, we have estimated an H luminosity for IC 2233 by using our -band photometric calibration and the response curves for the -band (continuum) and narrow-band (H+[N ii]) filters. In this manner we derive erg s-1. This value is corrected neither for internal extinction nor for the contribution from [N ii] emission in the narrowband filter (likely to be a 10% effect; see Goad & Roberts 1981). Our estimate for is in good agreement with a value derived from the data of Rand (1996) ( erg s-1, with an uncertainty of %; R. Rand 2003, private communication). Using the relations given by Kennicutt (1998), the observed H luminosity translates to a global star formation rate of yr-1. Thus the disk-averaged star formation rate in IC 2233 is quite low despite various signatures of ongoing, localized star formation (e.g., H ii complexes; a blue global color, OB associations, and candidate populations of supergiant stars). For comparison, we can also compute an estimate of the star formation rate based on the IRAS FIR emission. Using the 60 m and 100 m fluxes from the NED database we find . Following Kennicutt (1998), this translates to a global star formation rate of 0.02 yr-1, where we have assumed that the total IR luminosity is . This estimate is more than a factor of two smaller than the H estimate, consistent with the suggestion of Bell (2003) that the FIR may systematically underestimate the total star formation rate of low-luminosity galaxies. In any case, both estimates represent the extreme low end of observed star formation rates for Sd spirals (Kewley et al. 2002). This is consistent with the low emission line intensity ratios measured in IC 2233 by Goad & Roberts (1981) and Miller & Veilleux (2003) and with the general classification of IC 2233 as an LSB spiral.
4 VLA Observations
We observed IC 2233 and NGC 2537 simultaneously in the H i 21-cm line using the VLA in its C (3 km) configuration777Since 1998 the C configuration has been modified from its original form by placing the fifth antenna of the north arm at the center of the array in order to improve sensitivity to extended emission. on 2000 May 28 (hereafter Day 1) and 2000 May 29 (Day 2). The observations were performed over two 8-hour sessions, with a total of hours of data acquired on the target field. Approximately 97% of the data were obtained at elevations greater than 40∘.
Our observations were carried out using the 4-IF spectral line observing mode with a 1.5 MHz bandpass per IF pair (left and right circular polarization) and on-line Hanning smoothing. This resulted in 63 channels of width 24.4 kHz (5.2 km s-1) per IF pair. One IF pair was centered on the published redshifted velocity of IC 2233 (=565 km s-1) while the other IF pair was centered on that of NGC 2537 (=447 km s-1). The field center was chosen to be north of the optical center of IC 2233 to prevent excessive attenuation at the position of NGC 2537, with only a % loss at the position of IC2233. Five-minute observations of J0713+438 were interspersed with 30-minute observations of the IC2233/NGC2537 field in order to determine phase calibrations as well as bandpass corrections (see §4.1.1). In addition, J0137+331 (3C48) and J1331+305 (3C286) were each observed for 10 minutes each day for use as flux calibrators. Details of our observations are summarized in Table 2.
| Parameter | Value |
|---|---|
| Observing Set-Up | |
| Array configuration | C |
| Baseline range | 30 – 3385 m |
| Observing dates ( hours) | 2000 May 28 (Day 1), 29 (Day 2) |
| Pointing and phase center, (J2000.0) | 08 13 58.8 |
| Pointing and phase center, (J2000.0) | +45 49 36.3 |
| Total on-source observing time | 696 minutes (683 min. at elevation ) |
| Flux calibrators | J0137+331 (3C48), J1331+305 (3C286) |
| Phase calibrator | J0713+438 |
| Number of IFs | 4 [2 (RR, LL)] |
| Channel width (after Hanning smoothing) | 24.4 kHz |
| Velocity separation of channels | 5.2 km s-1 |
| Number of channels per IF | 63 |
| Heliocentric central velocity (optical definition) | 565.0 km s-1 (IF pair 1); 447.0 km s-1 (IF pair 2) |
| Primary beam (FWHM) | |
| Deconvolved Image Characteristics | |
| Robustness parameter ()aaWe also used = 0.7 (and a circular restoring beam with FWHM = ) to make the continuum image (see §4.1.3) | 1 |
| Synthesized beam FWHMaaWe also used = 0.7 (and a circular restoring beam with FWHM = ) to make the continuum image (see §4.1.3) | |
| Synthesized beam position angle | |
| Linear resolution of synthesized beambb is the distance to the target galaxies expressed in units of 10 Mpc (the distance to IC 2233, see Table 1). | kpc |
| rms noise per channel (1) | (0.37–0.44) mJy beam-1 |
| rms noise in total-intensity image (1) | mJy beam-1 km s-1 |
| Limiting column density per channel (1) | (8.8 – 10.5) atoms cm-2 |
| rms noise in H i mass channel-1, ()bb is the distance to the target galaxies expressed in units of 10 Mpc (the distance to IC 2233, see Table 1). | (4.5 – 5.3) |
4.1 Data Reduction
4.1.1 Calibration
A vector average of the visibilities from channels 5-59 at each time stamp was used to identify interference and corrupted data. Because our observations were obtained in the daytime during solar maximum, our data contain significant solar interference at short spacings, and noticeably poorer phase stability compared with H i observations of other targets obtained by us on adjacent dates, but after sunset (Paper I). The Sun was away from our target field during the observations and relatively “quiet” on our first day but far more active on the second day, which included a period of about one hour where only baselines between the farthest two antennas of each arm gave usable data. In addition, on the second day, a significant fraction of the data from three antennas (located at the East-2, East-8, and East-16 stations, respectively) had to be discarded due to electronic problems. In spite of these losses, we have succeeded in making images of excellent quality, and comparison with past single-dish observations suggests that we have recovered the bulk of the H i emission in both IC 2233 and NGC 2537 (see §6.2 & 8.2.3).
The flux density scale was determined using the primary calibrators 3C48 and 3C286 and adopting fluxes of 15.90 Jy and 14.74 Jy, respectively, at 1417.64 MHz. These fluxes were scaled to our other frequency setting following the precepts of the VLA calibration manual. Using one of the two primary flux calibrators to solve for the flux of the other, and comparing this flux with its known (predicted) value, indicates that our internal flux calibration uncertainty is less than 1%.
We determined antenna-based amplitude and phase calibrations using the observations of J0713+438 and an initial bandpass calibration from the average of the data obtained on 3C48 and 3C286. This initial bandpass calibration resulted in some curvature in the spectra taken through strong point sources in the IC 2233/NGC 2537 field. We therefore evaluated and applied further scan-based bandpass corrections by fitting 5th order Chebyshev polynomials to channels 5-59 of each (scan) averaged spectrum of J0713+438 and corrected the IC2233/NGC2537 data by linear interpolation (in time). This procedure led to flat bandpasses through the bright continuum sources in the field. The spectrum of the strongest source (4C+46.17) shows no significant deviations at the level of 0.13% (2.5 ).
The IC 2233 field contains significant background continuum emission (totaling Jy observed, i.e. before correction for the attenuation of the primary beam) which is dominated by two bright point sources (4C+45.15 at = 08h12m42.0s, = +45∘36 and 4C+46.17 at = 08h14m30.4s, = +45∘56). For these “4C” sources we observed flux densities of 531 mJy (best fit as two extended components with formal uncertainty below the 1% adopted here) and 1089 mJy (1% calibration uncertainty, with a formal error of 0.5 mJy). These measurements are in good agreement with values from the NRAO VLA Sky Survey (NVSS; mJy and mJy, respectively; Condon et al. 1998). The strength of these two sources results in significant ghosts in the images of channels on both edges of each IF pair. These ghosts, which appear at the symmetric positions of these sources with respect to the phase center of the observations were first discussed by Bos (1984,1985) in his study of the Westerbork array. They are always present but rarely noticed at the VLA. We observe them at a strength of % in channel 1 and can trace them up to channel 10 (although they would be difficult to detect beyond channel 4 if their spatial location were unknown). On the other end of the band, the ghosts are clearly seen in channels 61–63. The cumulative effect of such ghosts is responsible for the well-known increase in the noise of the channel images at the edges of the band in VLA spectral observations (Uson 2007).
H i emission is observed in channels 13–63 of IF1 and 1–45 of IF2, leaving only a small number of line-free channels. Avoiding the ghost emission discussed above, we used channels 5–12 of IF1 and channels 46–59 of IF2 to improve our gain calibration through self-calibration. We took the image obtained from channels 5–12 of IF1 and day 1 as a reference to compute phase corrections in 10-minute intervals for the observations of both IFs and both days (using channels 5–12 for IF1 and channels 46-59 for IF2). After applying the corresponding phase corrections, we determined amplitude and phase corrections with a 30-minute averaging time (one set per scan) restricting the baselines used to those larger than 200 (the shorter baselines contained significant amounts of corrupted data; see above). The average of the amplitudes was constrained to be constant in order to preserve the overall amplitude calibration.
The frequency-averaged residual visibilities (after subtraction of the theoretical contribution of the detected continuum emission) for each day and each IF were used to find low-level contamination of the data. We discarded the corresponding data and performed one additional iteration of phase-only self-calibration on 10-minute intervals which led to improved pseudo-continuum images for each day and IF.
4.1.2 Imaging of the Line Emission
The strong continuum present in our field precluded a fast subtraction of the continuum emission by fitting the real and imaginary components of each visibility (Cornwell et al. 1992). Instead, we have used an alternate, two-step continuum subtraction procedure. First, we computed a continuum model for each IF pair on each day by imaging the available line-free channels. We used channels 6-12 for IF1 and channels 46-59 for IF2. The data were gridded channel by channel to avoid bandwidth smearing. We subtracted these models (channel by channel) from each respective database and concatenated the residual data for each IF pair for each of the two days. Next, we obtained channel images using a 3′′ cell size and a robustness factor . The resulting synthesized beam was at a position angle of . Deconvolution to a level of 0.40 mJy beam-1 was followed by restoration of isolated components if their absolute value inside a 6-pixel radius was less than 1 mJy beam-1. The rms noise in the resulting image cube ranged from 0.40-0.46 mJy beam-1 channel-1 (for channels 5–59). We found that this procedure removed the bulk of the continuum emission, although some low-level sidelobes (of order 1 mJy) from the brightest continuum sources in the field remained.
To improve the continuum subtraction further, we combined the data for the two IFs (which overlap in frequency) to make a “global cube” containing 86 channels and a 2.1 MHz bandwidth. The corresponding channels from both IFs were averaged with equal weight after discarding four edge channels of each IF (60–63 of IF1 and 1–4 of IF2). The frequency misalignment between the two IFs was approximately one-fifth of a channel, so this resulted in a small amount of frequency smearing (1.1 km s-1); however, this is inconsequential for the analysis of the spectral images that follows. We blanked regions that contained line emission in the global cube (leaving only the residual continuum) and fit a first-order polynomial (in frequency) to each (spatial) pixel in the blanked cube (see Cornwell et al. 1992). Finally, we used the average level and slope derived from this fit to remove the residual continuum from each pixel/channel of the global cube containing the line emission.
The rms noise in the resulting continuum-subtracted global cube was reduced to 0.37-0.44 mJy beam-1 channel-1, and the noise showed a Gaussian distribution exclusive of the line emission. Noise in the channels where the data from the two IF pairs were averaged have 10% lower noise. Spectra through the locations of the brightest continuum sources appear extremely flat, with an rms noise of 0.42 mJy and mean flux density levels across the bandpass that are indistinguishable from zero. We have used this resulting continuum-subtracted global image cube for the analysis of the line emission in IC 2233 and NGC 2537 described hereafter.
4.1.3 Imaging of the Continuum Emission
Although the continuum images used to process the spectral line data were adequate for the purpose described in the previous section, they contained a number of systematic errors that became more pronounced when we averaged the four images (2 IFs, 2 days) to obtain a higher sensitivity continuum image for the purpose of studying the emission of IC 2233 and NGC 2537. As discussed in §4.1.1, the field contains two “4C” sources that are located at positions where the response of the primary beam is at % and %, respectively, of its maximum value. In addition, the off-axis geometry of the Cassegrain optics of the VLA antennas induces a beam-squint which separates the right and left circular polarization beams by on the sky (Weinreb et al. 1977). The response at the position of these sources is different for both polarizations and it is modulated oppositely with parallactic angle. Therefore, the visibilities do not obey a simple convolution equation and the image contains a significant and serious error pattern in the form of concentric rings around the two main continuum sources. This pattern extends over the full field-of-view and affects the flux density at the locations of IC 2233 and NGC 2537.
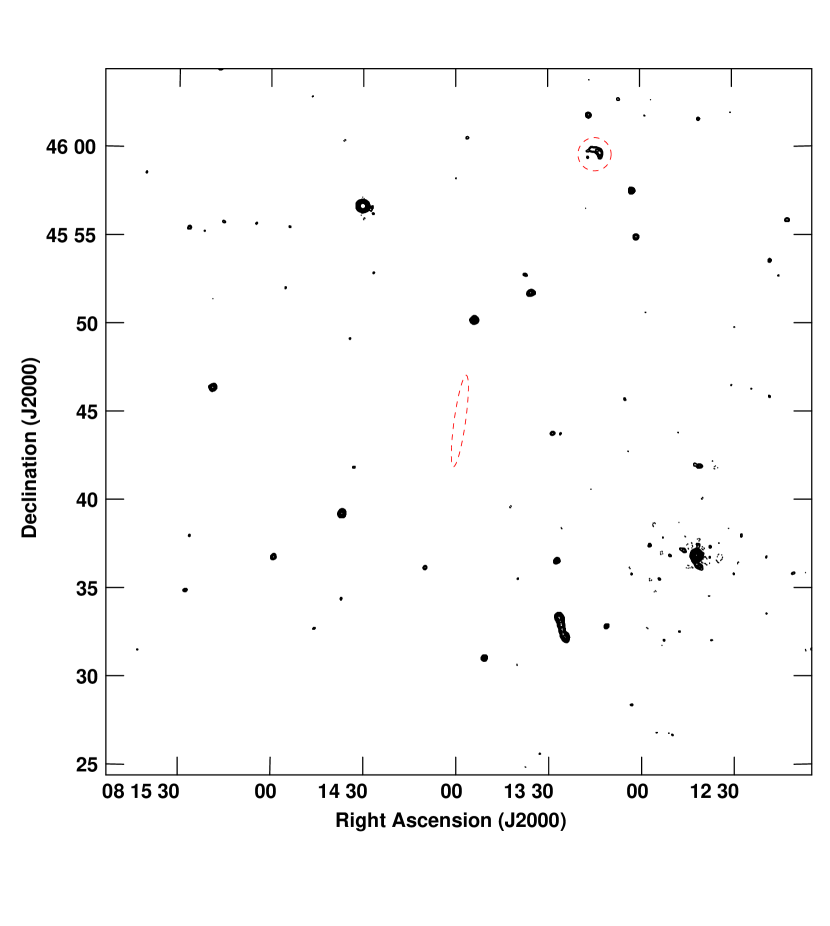
Although the beam-squint imposes a significant modulation on the continuum emission in the IC 2233/NGC 2537 field, the effect is negligible provided that the data are restricted to those visibilities for which both polarizations are available. In addition, it is important to ensure that amplitude self-calibration does not “follow the squint” on the strongest source in the field. Thus, we have made an image of the continuum emission, restricting the data to those visibilities for which both polarizations are available and pre-averaging both polarizations prior to determining corrections to the amplitudes through self-calibration. We have restricted the baselines to those longer than 1600 to minimize low-level cross-talk and solar contamination. This results in a 12% drop in the number of visibilities compared to the previous estimate of the continuum (§4.1.1). Furthermore, we have found that the ghosts discussed in §4.1.1 are still present in channels 5 and 6 of IF1 and in channel 59 of IF2. Therefore we made a new image using channels 7–12 of IF1 as well as channels 46–58 of IF2. We used “3-D” gridding and a robustness factor , which yields the optimal compromise between noise and resolution for VLA imaging observations obtained with full - coverage (Briggs 1995). The resulting image has an rms noise of 0.12 mJy beam-1 and is free of systematic errors, except at the positions of the two brightest “4C” sources, where it is still somewhat dynamic-range limited. This image, which corresponds to an average frequency of 1418.3 MHz, is shown in Figure 3.
5 The 21-cm Continuum Emission in the IC 2233 Field
As previously described, the IC 2233/NGC 2537 field contains significant continuum emission from background sources. The observed flux density (uncorrected by the attenuation of the primary beam) in the central is 1.129 Jy, with a total of 1.145 Jy when two flanking fields located outside the main beam are included. The flux density is dominated by the two aforementioned “4C” sources (see §4.1.1).
For NGC 2537 we detect continuum emission totaling mJy—in good agreement with the NVSS (). The peak emission of mJy lies at , , consistent with the location of the most prominent star forming region in this galaxy.
We do not detect any significant continuum emission from IC 2233. Within an area defined by the stellar disk of the galaxy we measure an integrated flux of mJy, after correction for the attenuation of the primary beam. However, given the dynamic range limitations and residual sidelobes discussed in the previous section, this should be considered non-significant and converted to a () upper limit of 3 mJy. The weak or absent radio continuum emission from IC 2233 is consistent with its LSB nature and with the low global star formation rates derived from other tracers, including H and FIR emission (see §3.3). Using the FIR luminosity of IC 2233 from Table 1, the radio-FIR correlation of Condon (1992) predicts a 1.4 GHz continuum flux of mJy, consistent with our upper limit.
6 Properties of the Neutral Hydrogen in IC 2233
6.1 Channel Images
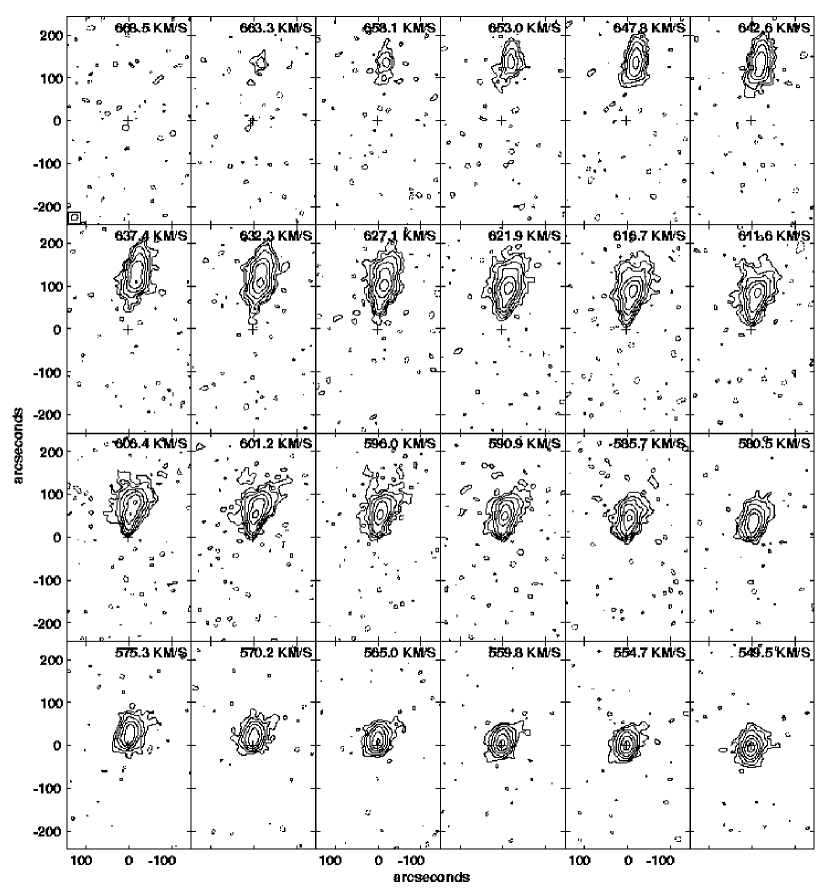
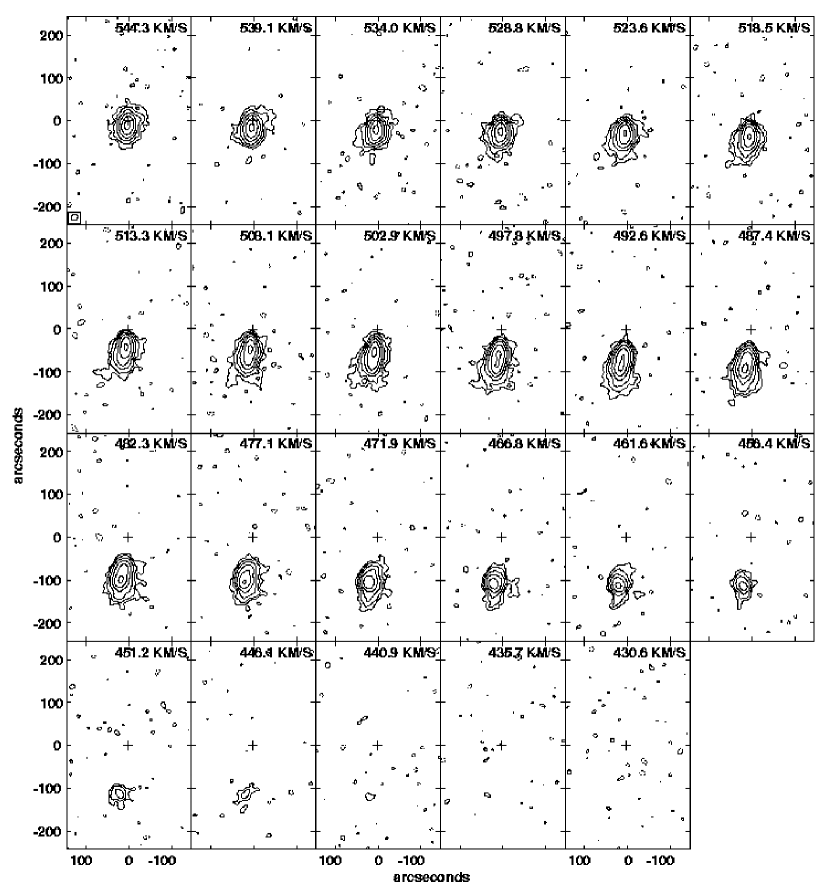
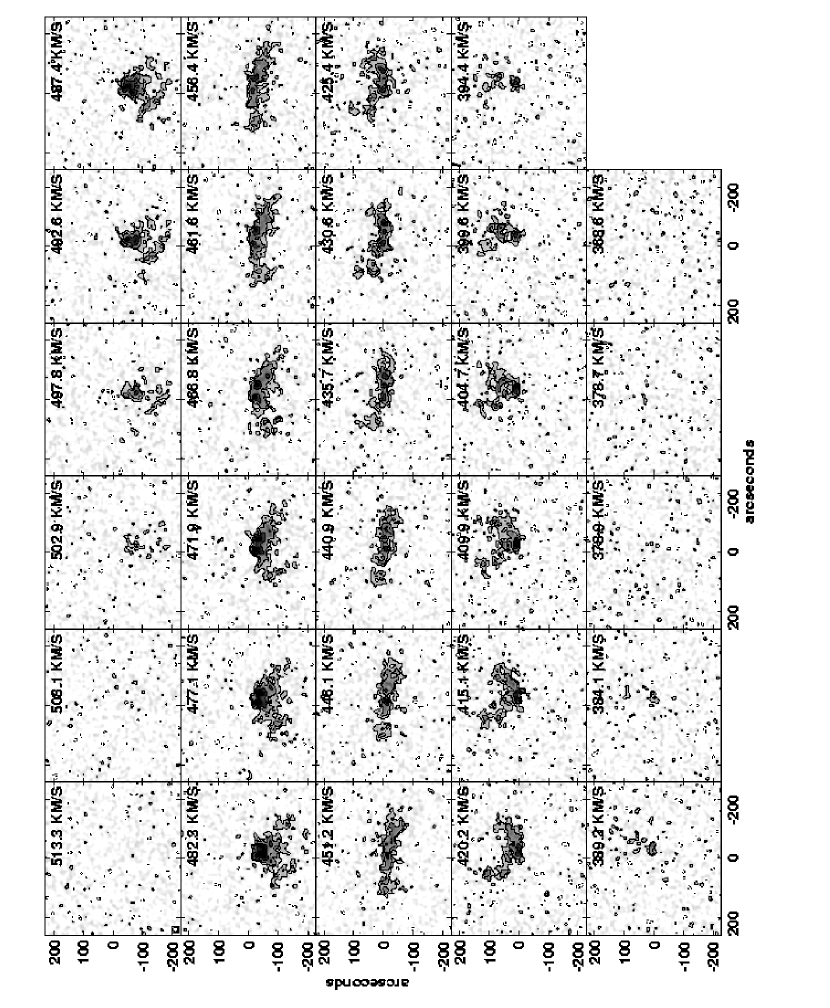
In Figure 4 we show the individual channel images for all velocities where H i line emission was detected in IC 2233. Several key properties of the H i distribution and kinematics of IC 2233 can be gleaned from these images.
There are significant differences in the distribution and morphology of the H i emission on the approaching versus the receding side of IC 2233. For example, on the receding (northern) side the emission distribution in the individual channels appears more radially elongated; all but the outermost few channels show emission near (where we take to lie along the major axis of the galaxy, with positive toward the north), and the channels in the velocity range 627.1–637.4 km s-1 show emission extending along the full extent of the receding side of the disk (). Within these latter channels, the peak brightness occurs from the galaxy center. On the approaching (southern) side, the corresponding channels show a more compact distribution of emission, with brightness peaking from the galaxy center. These differences imply an asymmetry in the H i distribution and velocity field on the two sides of the galaxy (see also below).
The channel images in Figure 4 also provide insight into the vertical structure of the neutral hydrogen in IC 2233. On both the approaching and receding sides of the galaxy—most notably in intermediate velocity channels—the isointensity contours broaden with increasing projected distance from the galaxy center, implying an overall flaring of the gas layer with increasing galactocentric radius (see also §6.2). Three-dimensional modeling would be necessary to characterize the flaring in detail (see Olling 1996; Matthews & Wood 2003). However, because IC 2233 is nearly exactly edge-on, measurements of the vertical extent of the emission in select channel images can provide estimates of how much the gas layer thickness changes as a function of radius. Channels near the velocity extrema contain emission predominantly from the outer regions of the disk. Therefore, the thickness of the emission along the direction in these channels provides an estimate of the maximum thickness of the gas layer. At the same time (owing to the curvature of the isovelocity contours), emission observed near in channels of intermediate velocity should arise from locations close to the true galaxy center and be largely uncontaminated by outer disk gas along the line-of-sight. The vertical thickness of this emission therefore should give an estimate of the H i scale height in the inner galaxy.
To gauge the thickness of the H i layer in the outer disk of IC 2233, we have used Gaussian fits along the direction to the emission in channels corresponding to km s-1 and km s-1. These channels provide better signal-to-noise than the very outermost channels, but still sample primarily outer disk emission. The fitted intensity profiles were extracted through the location of the peak intensity in each of these channels. The resulting deconvolved FWHM thickness in both cases is ( kpc). To estimate the thickness of the inner gas disk, we limit our measurement to the receding side of the galaxy. We fit the emission along in the channel corresponding to =606.4 km s-1 and find a deconvolved FWHM of ( pc). Similar results were obtained in adjacent channels. We conclude that the H i scale height of IC 2233 increases by at least a factor of two from the center to the outskirts of the galaxy.
In addition to the trends described above, several channels show plumes of emission stretching to heights of above and below the plane that cannot readily be attributed to warping or flaring of the disk. This phenomenon is particularly prevalent on the receding side of the galaxy. For example, in the channel images corresponding to heliocentric radial velocities between km s-1, we see a faint envelope of “extra” emission lying between roughly , on both the sides of the disk. The high- material shifts little in position from channel to channel; therefore toward the highest velocity channels, this gas lies at smaller projected radii than most of the emission, while in channels corresponding to km s-1, this material is seen “trailing” behind the bulk of the H i. Although there is relatively little H i mass associated with these extraplanar features, the large spread of velocities observed near a single spatial location implies a large velocity dispersion for this material. The characteristics of this emission are therefore consistent with those expected for a rotationally lagging H i “halo” (see Figure 13 below), analogous to those now identified in several other spiral galaxies (e.g., Swaters et al. 1997; Fraternali et al. 2001), including the LSB spiral UGC 7321 (Matthews & Wood 2003). The possible presence of an H i halo around IC 2233 is of particular interest as a second example of this phenomenon in a galaxy with a low global star formation rate and minimal extraplanar ionized gas component. However, a more rigorous characterization of this extraplanar H i emission will require three-dimensional kinematic modeling and is beyond the scope of this paper. Note that the estimates of disk flaring computed above should be largely unaffected by a rotationally lagging halo, since the halo gas is expected to manifest itself as non-Gaussian wings to the vertical intensity profiles rather than a global broadening (see Matthews & Wood 2003).
6.1.1 The Kinematic Center of IC 2233
The systemic velocity and kinematic center of spiral galaxies often are defined using either the centroid of the global H i profile or the location that minimizes the asymmetry in the rotation curve. However, given the frequency of lopsidedness and other perturbations in galaxies (see §9.1), such choices are not always physically justified. Here we propose an alternate method of defining the systemic velocity and kinematic center of an edge-on galaxy. Our method is most appropriate for late-type spirals, where H i typically has a high filling factor.
For a differentially rotating disk whose velocity field is spatially and spectrally resolved, the gas emission will be expected to have its minimum observed spatial extent along the direction of the disk major axis () within the channel corresponding to the velocity range , where is the true systemic velocity and is the spectral resolution. For all other observed velocities, , emission observed within will span a larger -extent () owing to the projection along the direction of the curved isovelocity loci (see e.g., Figure 6 of Sancisi & Allen 1979). In the absence of severe optical depth effects, the emission is also likely to exhibit its peak brightness in the channel encompassing the true systemic velocity owing to the combination of its minimum projected spatial extent and the maximum path length through the disk.
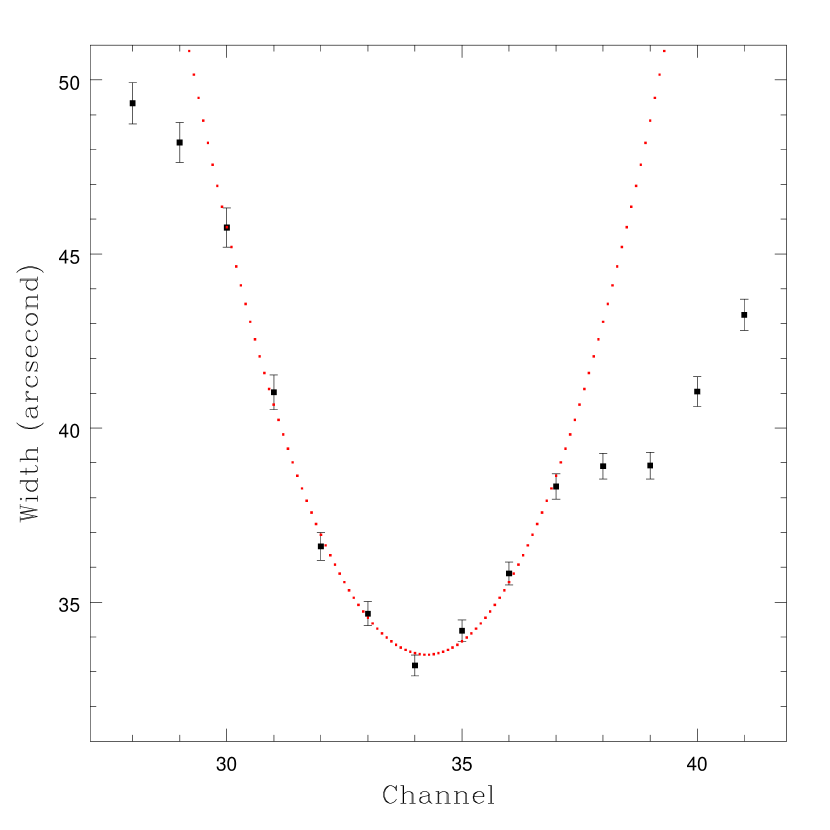
Using elliptical Gaussian fits, we derived a position angle and FWHM major and minor axis diameters for the H i emission distribution in each of the channel images of IC 2233 (corrected for the broadening due to the synthesized beam). A simple parabolic fit to the values of the major-axis diameters () as a function of channel yielded a minimum at channel with with 5 degrees of freedom (Figure 6), corresponding to a heliocentric velocity of km s-1. The orientation of the major axis in channel 34 corresponds to a PA , well aligned with the disk of IC 2233. A similar series of fits to the peak H i brightness as a function of channel yielded a maximum corresponding to channel . However, self-absorption as well as local changes in the gas phase can affect the column density of H i . In addition, the peak brightnesses in channels 34 and 35 are essentially identical. Therefore, we adopt a value of km s-1 () for the systemic velocity of IC 2233. We derived the location of the kinematic center of IC 2233 by linear interpolation to “channel” 34.25 using the centroids of the H i emission in channels 34 and 35, which yields: , with formal uncertainties of in right ascension and in declination (). The location of the H i kinematic center coincides within the errors with the location of the minor axis dust feature seen in our optical images of IC 2233 (see §3.2; Figure 2).
6.2 The Total H i Content
To derive a global H i profile for IC 2233 and measure its integrated H i flux, we have applied a “percolation” procedure to the individual channel images containing galactic line emission. For each channel we defined an irregular blotch containing line emission above 1 mJy beam-1 () and successively expanded this region for iterations using bands of pixels, until the flux within the blotch converged. Each step increases the noise in the total flux, as it is proportional to the square-root of the number of synthesized-beam areas inside the blotch. Convergence in each channel was assumed if an expansion band lead to no significant increase in the total flux (i.e., the SNR of the total flux did not increase with an additional step). To avoid biases, the algorithm begins by finding pixels with absolute value above the 1 mJy beam-1 threshold, with spurious noise spikes (positive and negative) being discarded. We corrected the channel images for primary beam attenuation prior to determining the flux in the regions localized with the percolation algorithm, and estimated an error based on the rms noise in the channel and the number of beam areas in the blotch. These uncertainties are 4 mJy channel-1. The resulting global H i profile is shown in Figure 7.
The global H i profile of IC 2233 exhibits a classic double-horn shape, but with a clear lopsidedness. As illustrated in the inset of Figure 7, the slopes of the two edges of the profile are also different: the side having the brighter horn shows a steeper slope than the side with the weaker and narrower horn. We comment on the significance of this further in §9.1.
From our global H i profile we measure velocity widths at 20% and 50% of peak maximum of 195.0 km s-1 and 174.1 km s-1, respectively. These values are in good agreement with previous measurements in the literature (e.g., Haynes et al. 1999). The centroid of our global H i profile as defined by the 20% peak maximum value is 557.1 km s-1. This is slightly higher than the systemic velocity of 553.41.0 km s-1 defined by the kinematic center of the galaxy (§6.1.1).
The integrated H i flux that we derive for IC 2233 is Jy km s-1. The error includes a statistical contribution from each channel (between 1 mJy and 4 mJy) and a calibration uncertainty of 1%. Our integrated flux is consistent with the mean of various published single-dish values including: Jy km s-1 (Fisher & Tully 1981); Jy km s-1 (Tifft 1990); and Jy km s-1 (Haynes et al. 1999). Published values of the integrated H i flux from aperture synthesis measurements include Jy km s-1 (Stil & Israel 2002a) and Jy km s-1 (Swaters et al. 2002). Assuming that the H i emission in IC 2233 is optically thin, we derive a total H i mass of =(1.11 .
6.3 The H i Intensity Distribution
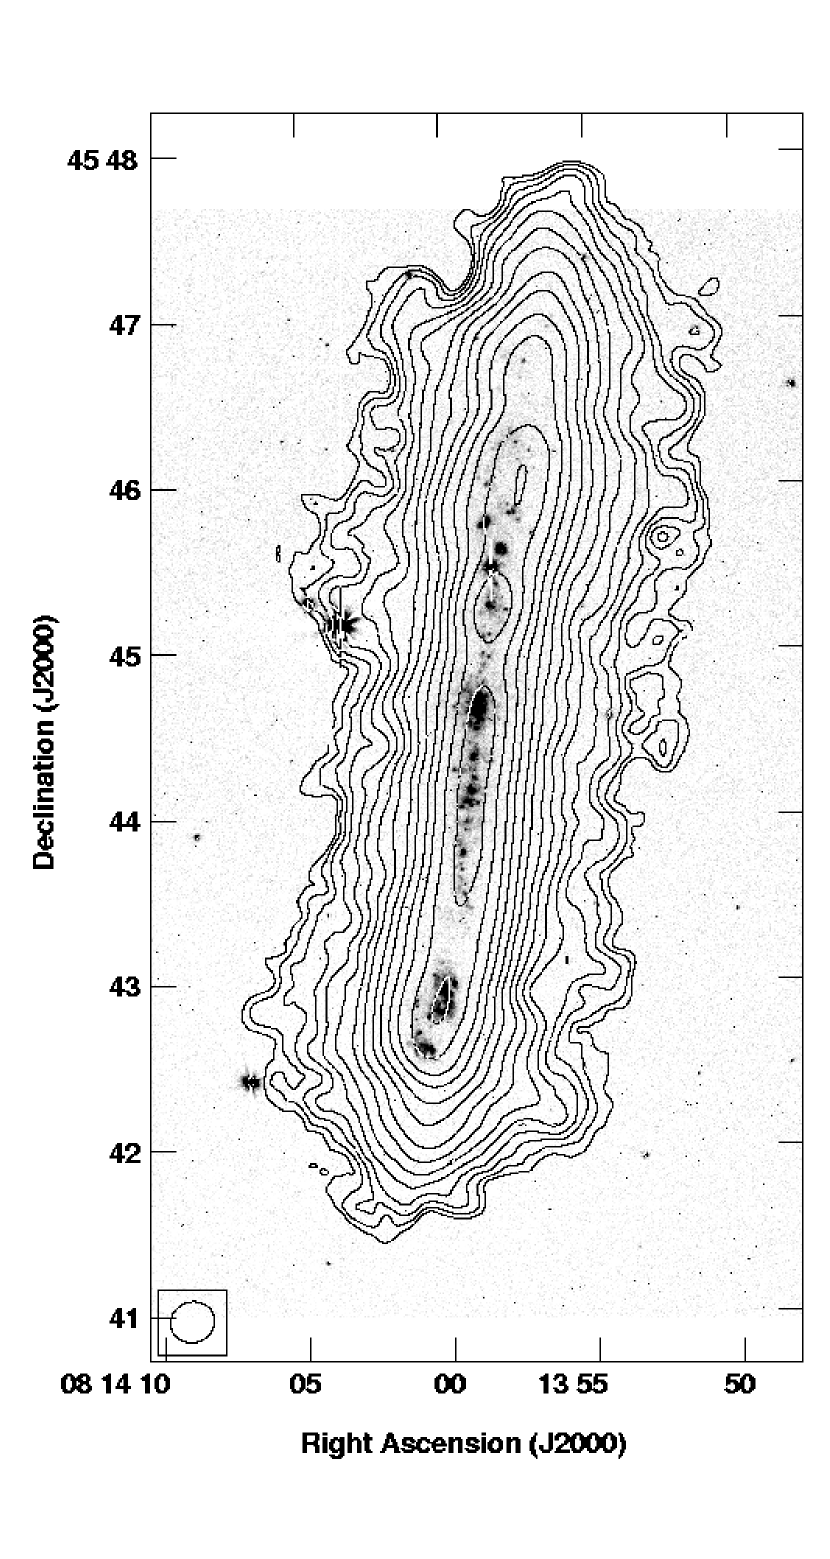
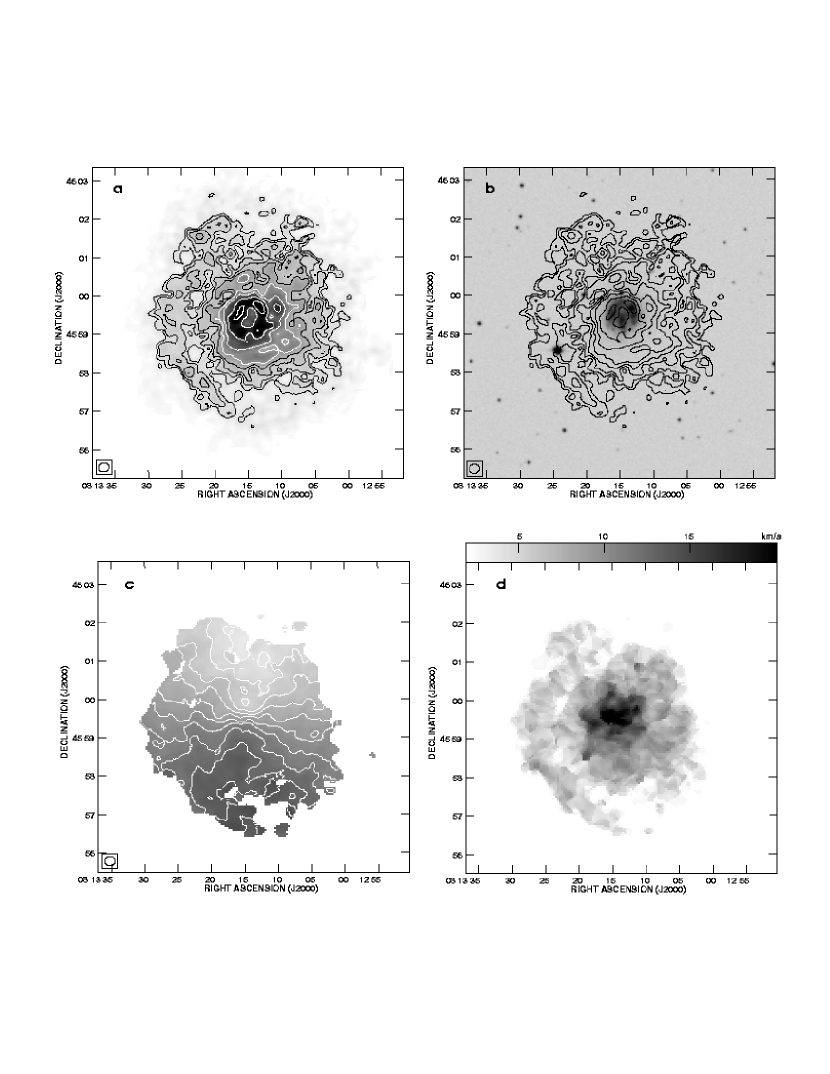
We derived the total H i intensity distribution (zeroth moment map) for IC 2233 by summing the emission identified in each channel by the percolation algorithm described in the previous section. The resulting total H i intensity map is shown in Figure 8, overplotted as contours on our H+[N ii] image. Our new H i map of IC 2233 reveals a variety of features not seen in previous H i images of this galaxy.
Along the midplane of IC 2233, the H i distribution of IC 2233 appears clumpy in spite of the line-of-sight averaging effects of our edge-on viewing angle. At the resolution of our data, these clumps have peak column densities of atoms cm-2—roughly 30% higher than the surrounding gas. The clumps are not distributed symmetrically about the kinematic center of the galaxy, nor do they lie in a flat plane (see also §6.4). As seen in Figure 8, the locations of all but the northernmost clump correspond with some of the brightest H ii complexes in the galaxy. Viewed face-on, the H i disk of IC 2233 may appear similar to that of the dwarf LSB spiral NGC 4395, where the H i shows a lopsided distribution with little central concentration and a number of denser, sub-kiloparsec-scale clumps are visible scattered throughout the disk (see Swaters et al. 1999). Most of these latter clumps correspond with the locations of the brightest star-forming regions in NGC 4395.
Further from the midplane of IC 2233, the H i isophotes become increasingly complex in shape. Various ripples and protrusions form a network of material extending to along the full radial extent of the galaxy. The bulk of these features cannot be attributed to noise, as most are visible in multiple successive contours. Figure 8 illustrates that the full vertical extent of the H i disk of IC 2233 is significantly larger than that of the ionized gas disk, even after accounting for resolution effects. While part of this effect comes from flaring and warping of the H i layer, it seems likely that at least some portion of this vertically-extended emission comprises a distinct H i “halo” (see also §6.1 and §7.2).
Along the radial direction, we measure the H i extent of IC 2233 to be at a limiting column density of atoms cm-2. This is 1.3 times the optical diameter (defined by the 25.5 mag arcsec2 -band isophote). Perpendicular to the disk, the deconvolved FWHM thickness of the H i layer through the location of the kinematic center is ( pc). Similar fits to the emission in the individual channel images (§6.1) show that the H i layer in the inner galaxy is intrinsically thinner, then flares at larger radii, especially on the northern side where the (projected) thickness of the gas layer reaches FWHM . Despite projection effects, this flaring is also evident in Figure 8, where we find that the global, deconvolved FWHM of the H i layer increases systematically with increasing galactocentric radius.
It is interesting to contrast the vertical structure of the H i disk of IC 2233 with that of the superthin galaxy UGC 7321 studied in Paper I. We measured the global FWHM of the H i disk of UGC 7321 to be pc — roughly 15% smaller than we measure for IC 2233. In addition, the distance-independent H i axial ratio of UGC 7321 is significantly larger than that of IC 2233: 29 versus 18, respectively. These differences cannot be attributed to projection effects given the similar orientation of the two galaxies, and imply that the mean thickness of the H i disk of IC 2233 is intrinsically larger than that of UGC 7321, consistent with its thicker stellar and ionized gas disks. While part of this difference could result from dynamical heating due to a recent minor merger (e.g., Reshetnikov & Combes 1997) we find no direct evidence of such an event (see §9.1), and it is quite likely that at least part of the difference in thickness stems from the lower total mass of IC 2233 and thus the lower self-gravity of its disk. As the H i velocity dispersion of galaxy disks seems to be nearly constant at 6-9 km s-1 in disk galaxies of a wide variety of types and morphologies (van der Kruit & Shostak 1984; Dickey 1996), it follows that the gas scale height of lower-mass disks should be proportionately larger (see also Brinks et al. 2002). This in turn may have important implications for the formation of molecular clouds in low-mass galaxies and their overall regulation of star formation (Elmegreen & Parravano 1994; Ferguson 1998; Dalcanton et al. 2004; Matthews et al. 2005).
Knowledge of the gas surface density of a galaxy is important to characterizing its star-formation efficiency. To estimate the deprojected H i surface density in the disk of IC 2233, we have used an Abel inversion technique (e.g., Binney & Tremaine 1987). We extracted a -wide slice along the major axis of the galaxy, sampled at increments, and then computed deprojected intensity distributions for the two sides of the galaxy independently, using a fortran program adapted from Fleurier & Chapelle (1974). The results are presented in Figure 9. We assume that the H i is optically thin and cylindrically symmetric on each of the two sides of the galaxy. Because the observed intensity profile fluctuates rapidly near the galaxy center, the deprojected surface density at small radii ( or kpc) is not well constrained. To minimize the impact of this effect, we have smoothed the measured intensity profile by a factor of three before each fit. Despite these small-scale uncertainties, the resulting profiles for the two sides of the galaxy should give a reasonable estimate for the mean H i surface density as a function of radius. Indeed, the integrated H i mass derived from the deprojected profiles shown in Figure 9 is —in excellent agreement with our observed value (see Table 3). Modest differences are apparent on the two sides of the disk. At all radii, the mean H i surface density of IC 2233 is considerably below the mean value of pc-2 found by Cayatte et al. (1994) for high surface brightness Sd galaxies. However, values of within the disk of IC 2233 are comparable to those seen in other LSB spirals (van der Hulst et al. 1993), including the superthin LSB spiral UGC 7321 (Paper I).
| Parameter | Value |
|---|---|
| Measured Quantities | |
| (J2000.0)aaKinematic center (see §6.1.1) | 08 13 58.9 () |
| (J2000.0)aaKinematic center (see §6.1.1) | +45 44 27.0 () |
| Peak H i column densitybbAt 16′′ resolution. | atoms cm-2 |
| ccError estimate includes mag formal error and 0.11 mag zero point uncertainty. | |
| ddProjected thickness of H i layer along minor axis, measured at a column density of atoms cm-2 and corrected for the resolution of the synthesized beam. (FWHM) | |
| eeAxial ratio of H i disk measured at a column density of atoms cm-2 and corrected for the resolution of the synthesized beam. | 18 |
| Jy km s-1 | |
| ff is the H i profile width measured at % of the mean peak value of the two profile horns. | 195.0 km s-1 |
| ff is the H i profile width measured at % of the mean peak value of the two profile horns. | 174.1 km s-1 |
| ggFrom kinematic method (heliocentric frame; optical definition). | 553.41.0 km s-1 |
| hhFrom global H i profile (heliocentric frame; optical definition). | 557.1 km s-1 |
| 85 km s-1 | |
| (21-cm) | mJy (2) |
| Derived Quantities | |
| iiAssuming the H i is optically thin and is the distance to IC 2233 expressed in units of 10 Mpc. | |
| jjFrom , where we have taken kpc (190′′) and 85 km s-1. | 1.55 |
| 0.62 | |
| 14 | |
| 1.3 | |
| Major axis distance (arcsec) | Circular Velocity (km s-1) | Uncertainty (km s-1) |
|---|---|---|
| -189.0 | 472.8 | 4.9 |
| -171.0 | 473.9 | 2.8 |
| -162.0 | 470.5 | 1.5 |
| -153.0 | 472.9 | 0.8 |
| -144.0 | 473.0 | 0.7 |
| -135.0 | 475.7 | 0.4 |
| -126.0 | 467.0 | 0.3 |
| -117.0 | 469.2 | 0.2 |
| -108.0 | 475.9 | 0.1 |
| -99.0 | 484.0 | 0.1 |
| -90.0 | 488.8 | 0.1 |
| -81.0 | 491.5 | 0.1 |
| -72.0 | 493.2 | 0.1 |
| -63.0 | 498.0 | 0.1 |
| -54.0 | 504.0 | 0.1 |
| -45.0 | 508.7 | 0.1 |
| -36.0 | 514.5 | 0.1 |
| -27.0 | 523.4 | 0.1 |
| -18.0 | 531.7 | 0.1 |
| -9.0 | 542.6 | 0.1 |
| 0.0 | 551.5 | 0.1 |
| 9.0 | 573.6 | 0.1 |
| 18.0 | 589.6 | 0.1 |
| 27.0 | 597.3 | 0.1 |
| 36.0 | 599.4 | 0.1 |
| 45.0 | 603.9 | 0.1 |
| 54.0 | 608.3 | 0.1 |
| 63.0 | 617.0 | 0.1 |
| 72.0 | 618.2 | 0.1 |
| 81.0 | 620.3 | 0.1 |
| 90.0 | 623.9 | 0.1 |
| 99.0 | 627.8 | 0.1 |
| 108.0 | 632.7 | 0.1 |
| 117.0 | 635.7 | 0.1 |
| 126.0 | 639.0 | 0.1 |
| 135.0 | 645.8 | 0.1 |
| 144.0 | 641.3 | 0.1 |
| 153.0 | 641.8 | 0.1 |
| 162.0 | 642.7 | 0.2 |
| 171.0 | 641.6 | 0.3 |
| 180.0 | 642.8 | 0.4 |
| 189.0 | 640.0 | 0.6 |
| 198.0 | 641.4 | 1.1 |
| 207.0 | 641.2 | 3.0 |
6.4 Warping and Undulations in the IC 2233 Disk
A careful examination of Figure 8 reveals that neither the brightest H i clumps nor the underlying, smoother gas component in IC 2233 lie along a flat plane. To illustrate this more clearly, we have plotted in Figure 10 the vertical displacement in the centroid of the H i layer as a function of radius. These displacements were derived from Gaussian fits to a sequence of slices perpendicular to the mean galactic plane. The resulting plot highlights two important features of the IC 2233 HI disk.
At the edge of the stellar disk of IC 2233 (denoted by arrows on Figure 10), we see that the H i layer bends away from the plane, forming an “integral sign” warp. The amplitude of the warp is asymmetric, with an amplitude 50% higher on one side of the disk than on the other ( versus ). On the higher-amplitude side, the gas layer is observed to twist back toward the midplane at its outermost extent. These various traits are common features of galactic warps (Burton 1988; García-Ruiz et al. 2002; Sánchez-Saavedra et al. 2003; Paper I). Recently Saha & Jog (2006) have suggested that amplitude asymmetries in warps are a natural consequence of dynamical wave interference between =0 and =1 bending modes of a disk. The process that might excite such modes is still unclear, but one possibility is accretion of gas—either from a minor merger or from the intergalactic medium. We return to this issue in §9.1.
In addition to the warp, Figure 10 reveals another particularly intriguing feature of the neutral gas disk of IC 2233: a pattern of positive and negative vertical displacements spanning the full extent of the stellar disk. These undulations appear remarkably regular, with a wavelength of 150′′ ( kpc). Their amplitude increases with distance from the center of the galaxy, reaching a maximum of ( pc).
In the Milky Way, systematic deviations of the H i layer from the mean principal plane along the direction (so-called “corrugations”) were first noted by Gum et al. (1960). Subsequent studies found that corrugations are present along both radial and azimuthal directions over a significant fraction of the disk of the Galaxy (e.g., Quiroga 1974,1977; Spicker & Feitzinger 1986). The corrugations are reflected not only in the distribution of neutral hydrogen, but in a variety of tracers, including molecular clouds and H ii regions (Lockman 1977; Alfaro & Efremov 1996 and references therein). As measured in H i, scales of the corrugations range from 50–350 pc in amplitude and from one to several kpc in wavelength (Spicker & Feitzinger 1986), comparable in scale to the undulations seen in IC 2233. Although it has been suggested that corrugations should be a common phenomenon in disk galaxies, similar phenomena have so far been observed (in optical light) in only a few galaxies (Florido et al. 1991,1992; Alfaro et al. 2001). To our knowledge, corrugations have not been reported previously in the H i disk of an external galaxy.
Inspection of Figure 2 reveals that both the H emission and the optical continuum of IC 2233 also show deviations from a purely planar geometry, although these undulations are not as regular as those seen in H i. Analysis of the vertical displacements via optical tracers is complicated by the patchy distribution of bright H ii regions and by the presence of a superimposed foreground star in the northern part of the galaxy. In the case of the -band data, we find a displacement of the intensity-weighted centroid from the midplane of + at ; the displacement systematically decreases with increasing , reaching a value of at , before increasing again monotonically to a value of 0 near . The changes in with thus have the same sense as in the H i data, but with different amplitude and phase. On the northern side of the disk, analysis is hindered by the bright foreground star, and no systematic trend in the displacement of the centroid as a function of radius is evident. All measured centroids between have positive , with the exception of one point near with 0. The midplane deviations measured from the H data show no obvious systematic trend with radius, and using an autocorrelation analysis we were unable to identify a periodicity in the H undulations on spatial scales . These differences between the vertical displacements measured from the H i and optical data may result from intrinsic differences between the vertical displacements of the stars and the gaseous components, but projection effects and differences in the radial extent and filling factor of the different tracers are also likely to contribute. Disentangling these effects in an edge-on galaxy is further complicated by the fact that disk corrugations may occur along the plane as well as orthogonally to it (see Spicker & Feitzinger 1986).
The origin of the corrugations in the disk of IC 2233 is a puzzle. We will present a more extensive investigation of this issue based on additional multiwavelength observations in a future paper (L. D. Matthews & J. M. Uson, in preparation). Here we offer a brief discussion of this question based on results from the present data.
In the Milky Way and in the face-on spiral galaxy NGC 5427, clear relationships have been found between corrugations and existing spiral arms, suggesting that the two phenomena are linked (Quiroga 1977; Spicker & Feitzinger 1986; Alfaro et al. 2001; see also Nelson 1976; Martos & Cox 1998). While the edge-on orientation of IC 2233 makes it difficult to assess what type of spiral arm structure it might possess, the patchy distribution of H emission in this galaxy is suggestive of H ii regions organized along loose spiral arms. This is supported by the observed correlation between the locations of the H i density enhancements along the midplane and the brightest H ii complexes (Figure 8). The H rotation curve derived by Goad & Roberts (1981; see Figure 14, discussed below) also shows a series of amplitude “wiggles” similar to those linked with the spiral arms and velocity corrugations in face-on spirals (Alfaro et al. 2001 and references therein).
Using numerical simulations, Edelsohn & Elmegreen (1997) showed that in a Milky Way-like galaxy, tidal perturbations from a low-mass companion will induce kpc-scale vertical oscillations (i.e., vertical displacements coupled with velocity undulations) with a spiral-like shape. In addition, simulations by Sellwood et al. (1998) have shown that vertical “buckling”—qualitatively similar in appearance to the undulations we see in IC 2233—can be induced by the passage of a low-mass satellite through the disk. However, a problem with invoking either of these scenarios is that our optical and H i studies of IC 2233 have not uncovered any direct evidence of an ongoing tidal interaction or minor merger (see also §2, §9.1), and Sellwood et al. found that if the satellite has been completely disrupted, bending waves will not be excited. While we noted in §3.2 that the unusual OB “superassociation” to the north of the kinematic center could be an intruder remnant, supporting kinematic evidence is lacking. Moreover, it is predicted that disk undulations would not persist once the orbit of the satellite has decayed into the disk (Sellwood et al. 1998).888We note that the simulations of Sellwood et al. 1998 strictly pertain only to collisionless systems, thus their direct applicability to a gas-rich system like IC 2233 is somewhat unclear.
If the midplane undulations in IC 2233 are not caused by either a recent intruder or linked with (pre-existing) spiral arms, another possibility is that they reflect spontaneous bending instabilities in the disk (e.g., Griv & Chiueh 1998). This might offer a natural explanation for the increase in amplitude of the undulations with radius, as such an increase could be a consequence of the change in the group velocity of this wave as it reaches regions with larger gas scale-height and lower gas density in the outer disk (Spicker & Feitzinger 1986; Hofner & Sparke 1994). If bending waves are the cause of the corrugations then similar features should be observable in the disks of other isolated galaxies.
One final aspect of the corrugated structure of IC 2233 that is worth noting is that, regardless of its origin, this type of coherent, large-scale pattern can only exist if the gas disk of this LSB spiral is largely self-gravitating (e.g., Bosma 2002; Revaz & Pfenniger 2004). This adds to other recent evidence for “heavy” disks in some LSB disk galaxies based on the analysis of their spiral structure (Fuchs 2002,2003; Masset & Bureau 2003).
7 The H i Kinematics of IC 2233
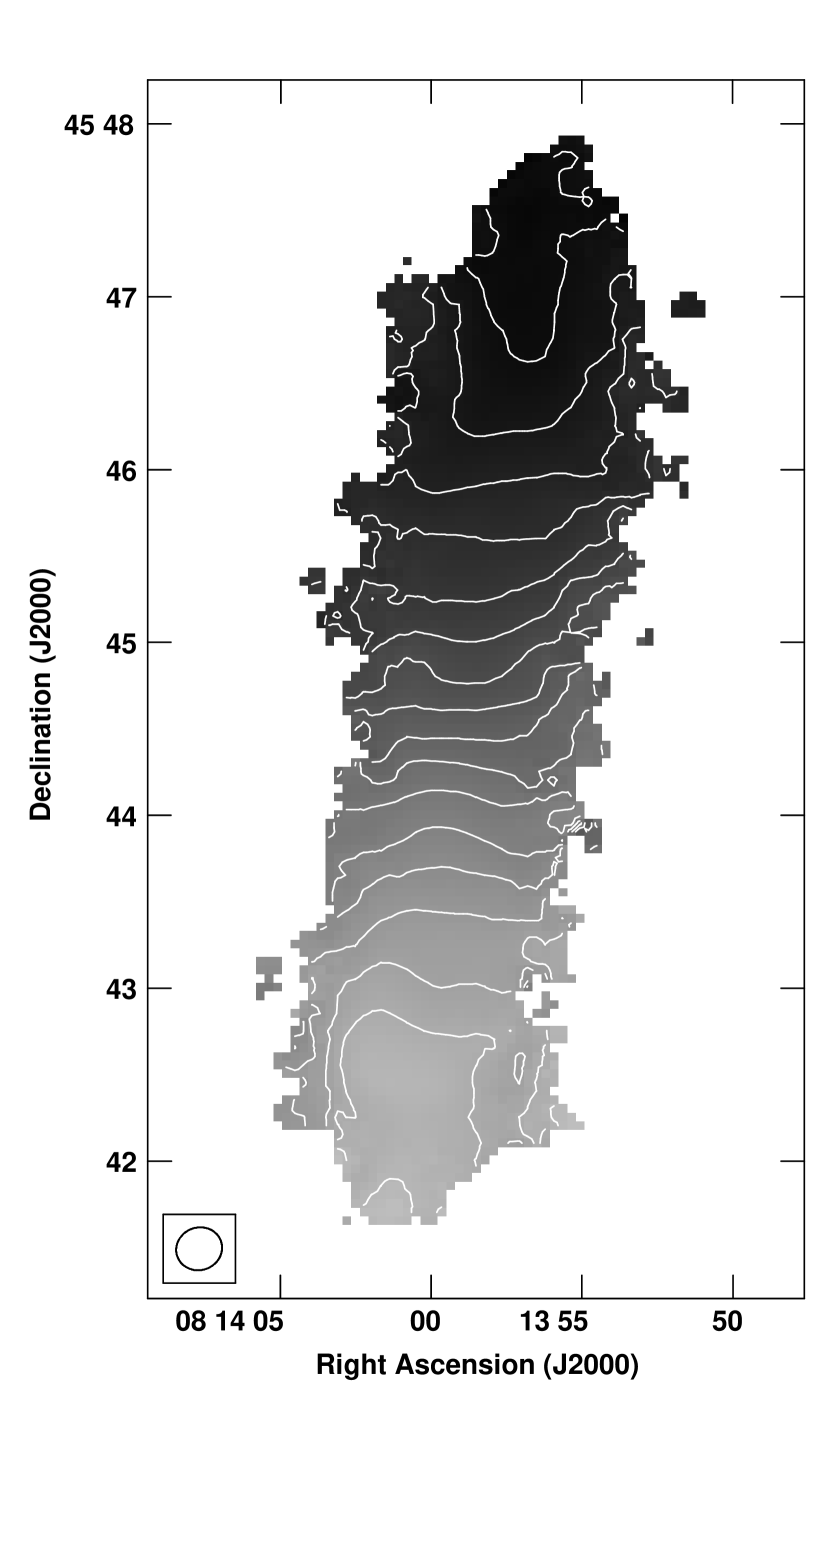
7.1 H i Velocity Field
The H i velocity field (first moment map) of IC 2233 is shown in Figure 11. Near the midplane this diagram shows fairly straight and parallel isovels, as expected from the high inclination of the galaxy and its inner-disk kinematics, which resemble a solid-body rotator (see also §7.2 below). However, away from the midplane, many of the isovels curve to form S- or L-shaped lines. Such pronounced twisting of the velocity field is rarely observed in edge-on galaxies and could be a signature of warping or of gas on non-circular orbits (e.g., as a result of a lopsided or triaxial potential or large-scale streaming motions through spiral arms). Because IC 2233 is viewed so close to edge-on, the curved portions of the isovels trace primarily faint, extraplanar material, hence warping seems to be the most likely explanation, although the presence of some gas on non-circular orbits and/or a lopsidedness in the overall potential cannot be excluded (see also §9.1). In addition, the kinematically anomalous gas discussed in §6.1 and §7.2 may also contribute to the observed complexity of the extraplanar velocity structure.
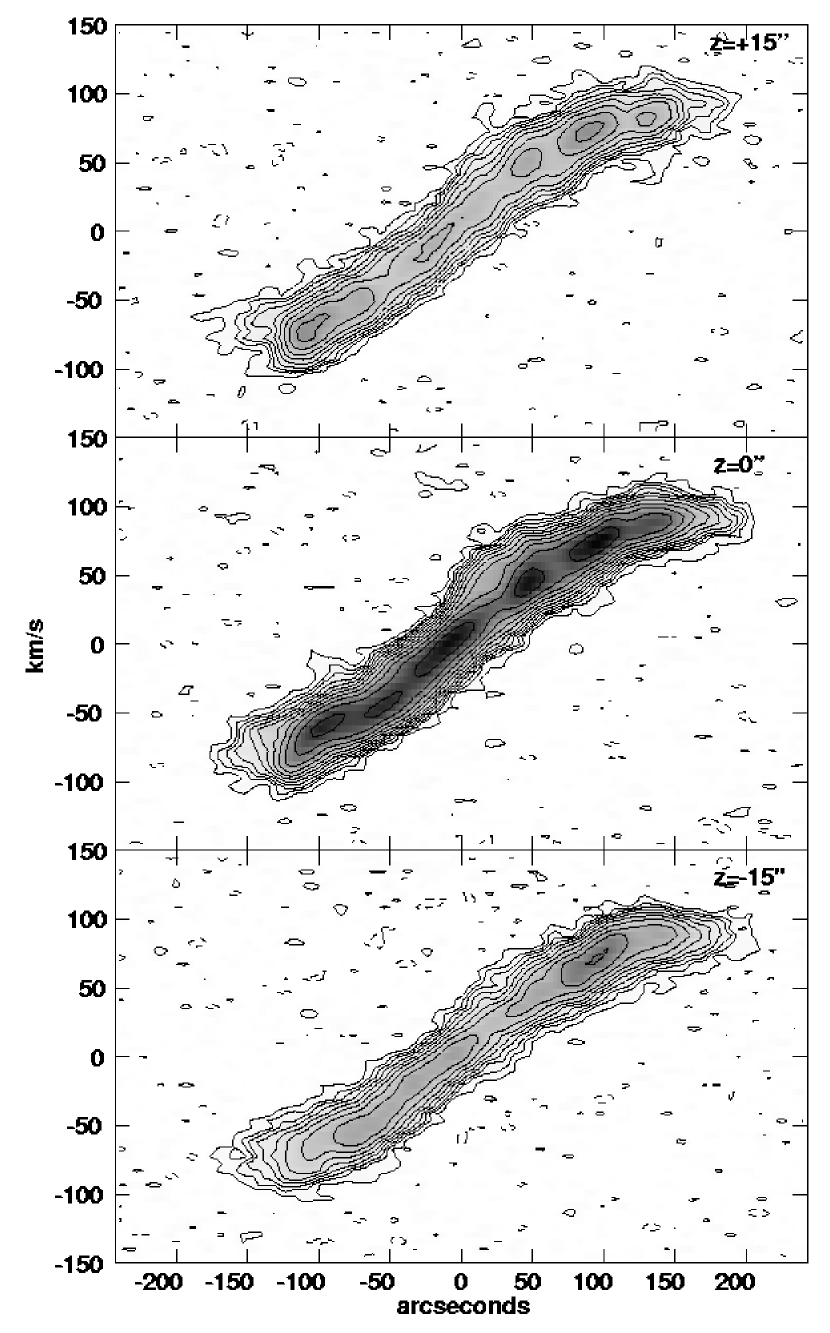
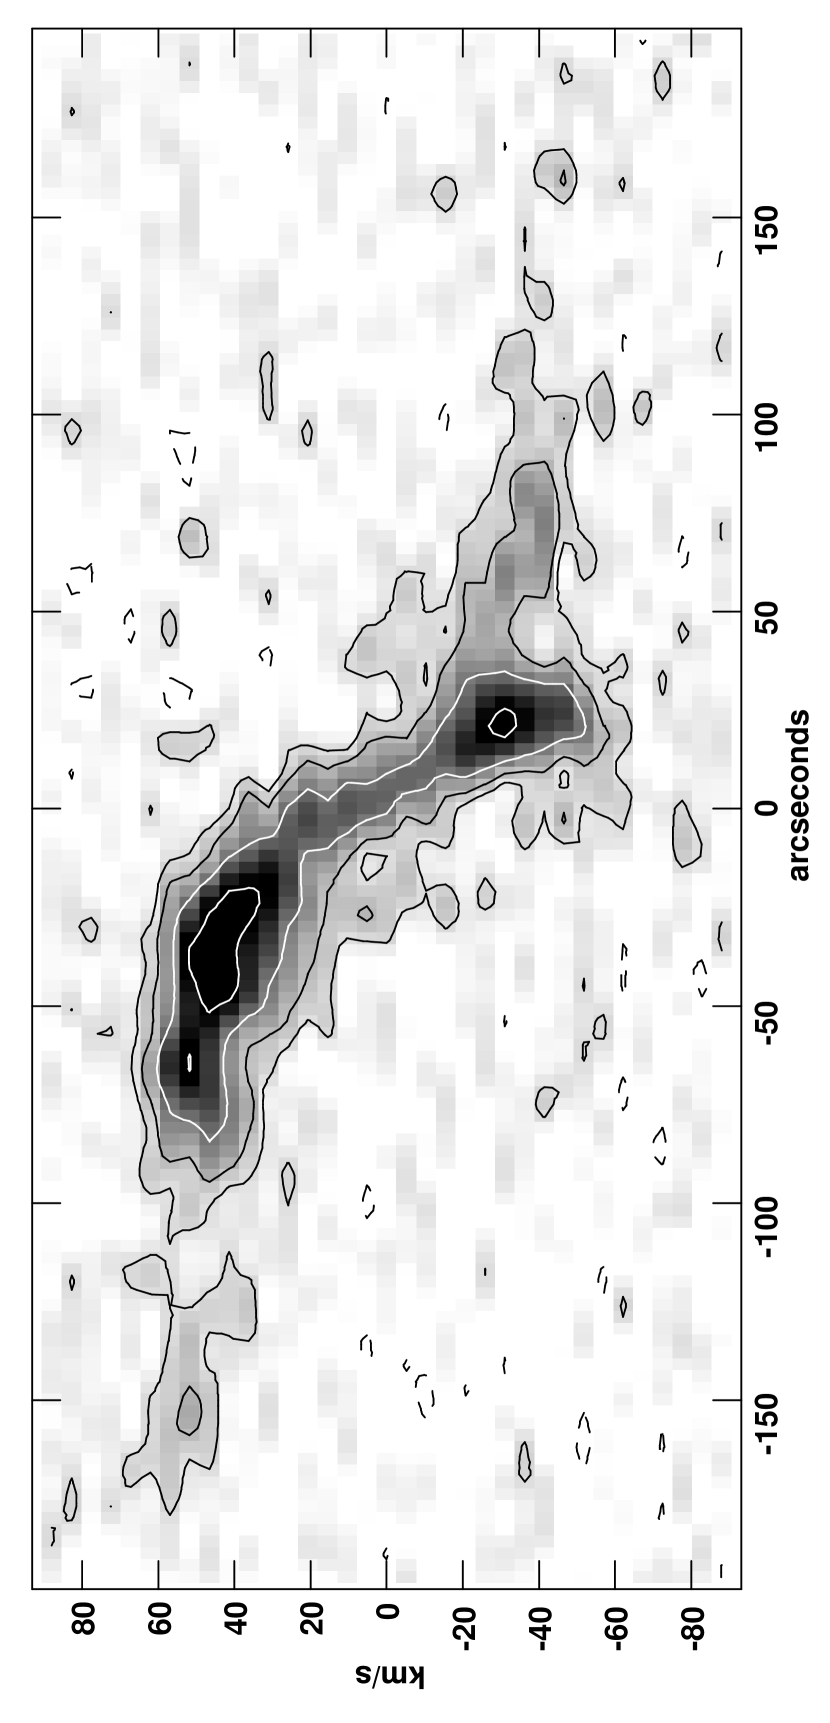
7.2 Position-Velocity Plots
In Figure 12 we show a position-velocity (P-V) diagram along the major axis of IC 2233, together with additional P-V profiles extracted from the midplane. The major-axis P-V diagram of IC 2233 displays noticeable asymmetries, with the redshifted side exhibiting a more obvious flattening or turnover at large radii, and the blueshifted side showing an apparent “upturn” near and maximum observed gas velocities 25 km s-1 larger than on the redshifted side. As is frequently seen in lopsided galaxies, the “flat” side of the P-V profile corresponds to the brighter horn in the global H i profile (see Figure 7 and §9.1; see also Swaters et al. 1999; Noordermeer et al. 2001). We also draw attention to the features seen in Figure 12 near that indicate deviations of +20 km s-1 and 20 km s-1, respectively, from the spread of “permitted” velocities at these locations.
It is interesting to contrast the major axis P-V plots of IC 2233 with those we derived for UGC 7321 in Paper I. In spite of having only a slightly smaller peak rotational velocity than UGC 7321, the major axis P-V plot for IC 2233 is strikingly different: while that of UGC 7321 is reminiscent of a “scaled-down” giant spiral galaxy (see Figure 10 of Paper I), the P-V profile of IC 2233 has a nearly solid-body shape, characteristic of dwarf and Magellanic spiral galaxies (cf. e.g., Swaters et al. 2002). At any given position along the major axis of IC 2233, the spread of observed velocities is narrower than what we observed in UGC 7321, and the peak intensities lie at smaller values of . These differences imply less rotational shear in IC 2233, a factor that may be important in allowing it to form the giant H ii complexes that are absent in UGC 7321 (see §3.3).
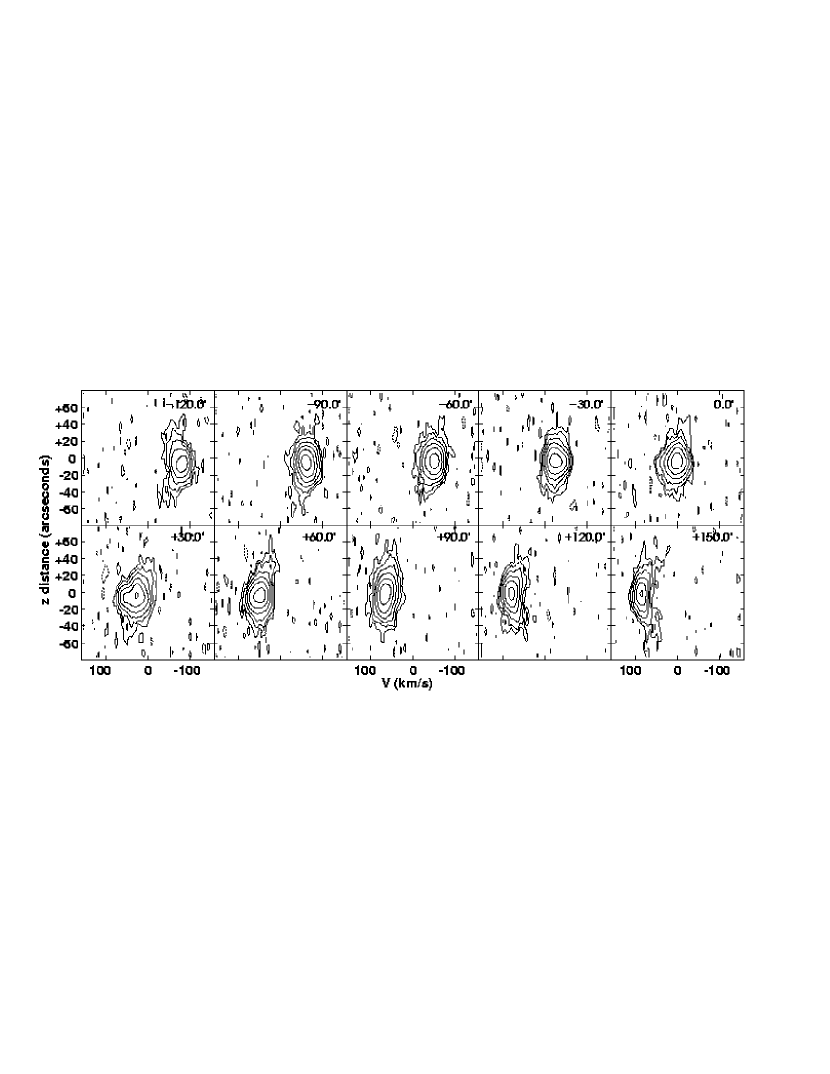
A sample of P-V diagrams extracted parallel to the minor axis of IC 2233 is shown in Figure 13. This figure highlights the previously mentioned high-latitude emission, extending to , and the tendency for the observed velocities of this emission to lie at smaller values compared with the emission along the plane (see also §6.1). This type of velocity structure is consistent with the expected signatures of a rotationally lagging H i halo (e.g., Matthews & Wood 2003). Kinematically anomalous extraplanar gas is observed on both sides of the plane of IC 2233, although it is slightly more prevalent in the northeast quadrant of the galaxy.
7.3 Disk Rotation Curve
Using the data shown in Figure 12 we have derived a major axis rotation curve for IC 2233 following the method described in Paper I. The result is plotted in Figure 14 and provided in electronic form in Table 4. The optical (H) rotation curve from Goad & Roberts (1981) is overplotted for comparison. The generally excellent agreement between the H rotation curve and our new H i rotation curve suggests that the latter is not significantly affected by beam smearing. The one notable discrepancy occurs over the interval -100′′, where the H i rotation curve is much smoother than the H curve. This may result from an irregular or patchy H ii region distribution and/or non-circular motions. Indeed, we see evidence of a larger spread in H i velocities at the corresponding location (Figure 12).
A maximum rotational velocity of 85 km s-1 is reached on both sides of the disk of IC 2233. Both sides also show a small but statistically significant drop in rotational velocity of 10 km s-1 near the edge of the stellar disk (), just before the terminal velocity is reached. The locations of these dips correspond closely to where the edges of the H i disk are seen to warp (Figure 10). Compared with UGC 7321, the H i rotation curve of IC 2233 shows a more leisurely rise relative to the stellar disk and has a less extended flat portion.
Despite the asymmetries visible in the major axis P-V plot of IC 2233 (Figure 12) and the global H i profile (Figure 7), our derived rotation curve is relatively symmetric, both in terms of shape and in terms of peak rotational velocity on the two sides of the disk. The difference in extent of the rotation curve on the two sides is also rather modest, with the receding side extending roughly further than the approaching side. Only between is a significant difference in amplitude between the two sides seen, with an offset of 25 km s-1.
A closer examination reveals that the reason why the underlying disk rotation curve appears fairly symmetric in spite of the asymmetries visible in Figure 12 is that the bulk of the underlying gas in IC 2233 has a fairly smooth and symmetric distribution (note the isophotes corresponding to intermediate intensities), with additional irregularities and asymmetries present in the form of the emission traced by the brightest, innermost contours, and the faintest, outermost contours. The innermost contours correspond to the bright clumps along the midplane visible in Figure 8; based on their locations in the P-V plane, it appears that these clumps are located at small to intermediate galactocentric radii and may be subject to modest non-circular motions. On the approaching side of the disk, the outermost contours seen in our data reveal gas extended to velocities 25 km s-1 beyond the asymptotic rotational velocities shown in Figure 14; however, this highest-velocity gas is of insufficient quantity to receive substantial weight in the determination of the rotation curve (see Paper I).
8 The Blue Compact Dwarf Galaxy NGC 2537
As described in §2, the blue compact dwarf (BCD) galaxy NGC 2537 lies at a projected distance of (49 kpc = 34 kpc) from IC 2233. Here we describe our new H i measurements of this galaxy and briefly discuss how our observations constrain scenarios for its evolution (see also §9.2).
8.1 Optical Morphology
NGC 2537 has been studied extensively at a variety of wavelengths, and some of its key properties are summarized in Table 5. This galaxy was observed at optical and near-infrared wavelengths by Gil de Paz et al. (2000a,2000b), who found that its nuclear region hosts an intermediate-age starburst (30 Myr) containing numerous star-forming knots. Surrounding the central starburst is a diffuse, red outer disk with an underlying stellar population of age 5-13 Gyr, implying that NGC 2537 has been forming stars for a significant fraction of a Hubble time. The metallicity of NGC 2537 is somewhat uncertain, but it is well below solar (; Meier et al. 2001; Wu et al. 2006). NGC 2537 has been imaged previously in H i by other authors (Stil & Israel 2002a,b; Swaters et al. 2002; Wilcots & Prescott 2004), but the improved sensitivity and resolution of our data provide additional insight into the H i properties and kinematics of this galaxy.
| Parameter | Value | Ref. |
|---|---|---|
| (J2000.0) | 08 13 14.7 | 1 |
| (J2000.0) | +45 59 26.3 | 1 |
| Hubble type | SB(s)m pec | 1 |
| DistanceaaWe adopt a distance of 7 Mpc (see §2). Distance-dependent quantities are scaled in terms of , the actual distance in units of 7 Mpc. | Mpc | 2 |
| (mag) | 0.232 | 3 |
| (mag) | 0.144 | 3 |
| Measured Quantities | ||
| 1 | ||
| bbCorrected for foreground extinction only. | 12.070.03 | 4 |
| bbCorrected for foreground extinction only. | 0.580.11 | 4 |
| 4 | ||
| bbCorrected for foreground extinction only. | mag arcsec-2 | 4 |
| Derived Quantities | ||
| AB,25 | 3.5 kpc | 1,4 |
| bbCorrected for foreground extinction only. | 17.16 | 2,4 |
| bbCorrected for foreground extinction only. | 8.4 | 2,4 |
| ccMeasured at a column density of atoms cm-2. | 2.8 | 1,2 |
References. — (1) NED database; (2) this work; (3) Schlegel et al. 1998; (4) Gil de Paz et al. 2000a,b
8.2 Properties of the Neutral Hydrogen in NGC 2537
8.2.1 Channel Images
In Figure 15 we present the H i channel images for NGC 2537. The same data are represented both as contours and as greyscale in order to highlight the existence of numerous small clumps of H i superposed on a lower surface density background. Many of these clumps are unresolved by our beam (i.e., they have sizes pc). The background emission underlying the clumps is itself rather diffuse and fragmented, and the emission within the individual channel images does not appear contiguous at the sensitivity limit of our data.
8.2.2 The Global HI Profile of NGC 2537
We derived a global H i profile for NGC 2537 in the same manner as for IC 2233 (§6.2). The result is shown in Figure 16. The uncertainty in our global profile for NGC 2537 is larger than that of IC 2233, both because NGC 2537 was farther from the center of the primary beam, and because the LSB, noncontiguous nature of its H i emission made it more difficult to sum the total flux in each channel accurately. Nonetheless, consistent with the ordered velocity field seen in Figure 16, the derived H i profile confirms that NGC 2537 is clearly rotationally dominated (the measured profile width at 20% peak maximum is 121 km s-1, compared with the peak H i velocity dispersion of 25 km s-1; see §8.2.5). The H i profile is somewhat lopsided, and the slopes of the two edges of the profile differ, with the blueshifted side having a shallower slope. The global H i profile we have derived is in good agreement with the single-dish profiles published by Thuan & Martin (1981) and Huchtmeier & Richter (1986) and the profiles derived by Swaters et al. (2002) and Stil & Israel (2002a) using Westerbork aperture synthesis measurements.
We derive an integrated H i flux for NGC 2537 of 19.20.6 Jy km s-1. The uncertainty is a combination of a statistical error of 0.35 Jy km s-1 and an overall calibration uncertainty of 1%. Our integrated flux lies within the range of previously published single-dish values, including: 21.61.1 Jy km s-1 (Thuan & Martin 1981); 17.22.2 Jy km s-1 (Davis & Seaquist 1983); 20.11.1 Jy km s-1 (Huchtmeier & Richter 1986); 21.62.5 Jy km s-1 (Fisher & Tully 1981); 18.51.2 Jy km s-1 (Tifft 1990); and 20.21.0 Jy km s-1 (Bottinelli et al. 1990). Previous aperture synthesis measurements include 18.80.9 Jy km s-1 (Stil & Israel 2002a) and 14.8 Jy km s-1 (Swaters et al. 2002).
8.2.3 The Total H i Intensity Distribution
An H i total intensity (moment 0) image of NGC 2537 is shown in Figure 17. In the upper left panel, the H i intensity contours are overplotted on a greyscale representation of the data, while in the upper right panel, we show the H i contours overplotted on a blue image of the galaxy from the Digitized Sky Survey (DSS). Because of the very diffuse and patchy nature of the H i emission in this galaxy, the percolation method described in §6.2 picks up a large amount of low-level noise. Therefore to compute the zeroth moment we have summed all positive emission over the velocity range =368.4-502.9 km s-1. To increase signal-to-noise for the higher order (first and second) moments (discussed below), we rejected data that did not exceed 1.5 times the rms noise per channel in a version of the data that had been smoothed spatially with a Gaussian kernel of width 5 pixels and in velocity with a boxcar function of width 3 channels.
As seen in the upper panels of Figure 17, we detect H i emission in NGC 2537 extending to 1.5–2 times the limiting isophote on the blue DSS image, with the extent of the H i relative to the starlight varying with azimuth. The mean ratio of the H i diameter to the optical diameter is 3.5. As is evident from the individual channel images (Figure 15), the global morphology of the neutral gas is quite clumpy and fragmented, and several patches within the disk appear nearly devoid of H i emission. This flocculent appearance of the H i is not confined to the star-forming portion of the galaxy, implying that it is not linked to feedback processes or to the instabilities giving rise to star formation. The overall H i distribution and morphology of NGC 2537 are similar to other low-mass starburst and post-starburst galaxies observed with comparable spatial resolution (e.g., Israel & van Driel 1990; Meurer et al. 1996; van Zee et al. 1998; Wilcots & Miller 1998; Hunter et al. 1999; Thuan et al. 2004), although frequently BCDs show global H i morphologies that are much more disorganized and irregular than seen in NGC 2537 (cf. van Zee et al. 1998,2001; Thuan et al. 2004).
A notable feature of the outer H i disk of NGC 2537 is the spiral arm-like feature on the eastern edge, which extends nearly 180∘ around the galaxy. This feature has no optical counterpart, and as seen in §8.2.4, the gas in this arm follows the same ordered rotation as the rest of the disk. One possibility is that this feature could be a remnant from a past interaction (§9.1). However, gaseous arms induced by interactions tend to be short-lived, persisting only one or two rotation periods (e.g., Quinn 1987; Iono et al. 2004), implying that the interloper should still be nearby. As discussed in §2 and §9.1, we are unable to identify a likely culprit. Moreover, the tight winding of the NGC 2537 arm, together with its regular rotation and lack of a counter-arm all are inconsistent with classic tidal features (see Toomre & Toomre 1972). Explaining the arm through more indirect dynamical effects, such as swing amplification (Toomre 1981), also appears problematic given the extremely low H i surface density of the disk. The Toomre parameter of the outer disk is quite high (10) implying a high degree of stability against axisymmetric perturbations; in such a case, the swing amplification mechanism will be very inefficient, although this problem could be overcome if the H i disk contains sufficient dark matter to render it gravitationally unstable (see the discussion in Masset & Bureau 2003).
The most striking feature of the inner H i disk of NGC 2537 is the bright “ring” approximately 1′ (2.0 kpc) in diameter. Typical column densities along the ring are cm-2, although several brighter knots with cm-2 are superposed. In contrast, inside the ring the mean column density is roughly a factor of two lower ( cm-2), although part of the gas inside is likely to be molecular. One of the regions of bright optical continuum emission in NGC 2537 lies coincident with the center of the H i ring, but based on the H and [O iii] images of Gil de Paz et al. (2000b), there does not appear to be any significant amount of ionized gas at this location.
Using the data from Figure 17a, we have derived a radial H i surface density profile for NGC 2537 by taking measurements within a series of concentric, elliptical annuli. The center of the annuli was taken to be the kinematic center listed in Table 6; this position approximately corresponds to the center of the bright H i ring in Figure 17a,b. The ellipticity of the annuli was taken to be 0.1 and their major axis position angle to be (see §8.2.4 below). The results are presented in Figure 18. We have not corrected the inferred H i surface density for inclination since this correction is small (18%). We see that the H i surface density in the outer disk of NGC 2537 is extremely low, comparable to values found in typical dwarf irregular and LSB spiral galaxies, including IC 2233 (Figure 9). However, in contrast to IC 2233, NGC 2537 shows a steep rise in H i density toward its center, where the H i surface density reaches a peak of pc-2—comparable to values seen in the inner parts of normal late-type spiral galaxies (Cayatte et al. 1994). Similar enhancements in the central H i surface density are also observed in other BCD systems (Meurer et al. 1996; van Zee et al. 1998).
We have overplotted as a dashed line on Figure 18 the canonical star formation threshold of Kennicutt (1989). We have assumed that the gas is isothermal with a constant sound speed of 7 km s-1. We see that the computed Kennicutt threshold lies significantly above the measured gas surface density at all radii. However, scaling the measured H i curve by a factor of 1.34 to account for He and by an additional factor of 1.9 reconciles it with the computed instability threshold over the portion of the galaxy where stars are visible (delineated by the vertical bar). The latter scaling factor is comparable to the expected contribution to the total gas surface density from the molecular gas: Gil de Paz et al. (2002) measured within the the central kpc () of NGC 2537. Therefore, in contrast to IC 2233, the locations of star formation within NGC 2537 appear to be in reasonable agreement with Kennicutt’s star formation criterion so long as the total gas surface density is considered.
| Parameter | Value |
|---|---|
| Measured Quantities | |
| (J2000.0)aaFrom tilted-ring rotation curve fit. | 08 13 14.84 () |
| (J2000.0)aaFrom tilted-ring rotation curve fit. | +45 59 30.5 () |
| Peak H i column densitybbAt resolution. | atoms cm-2 |
| Jy km s-1 | |
| 120.9 km s-1 | |
| 99.2 km s-1 | |
| a,a,footnotemark: ccBased on 60m and 100m fluxes from the NED database. | 445.3 km s-1 |
| c,c,footnotemark: ddFrom global H i profile (optical definition). | 443.5 km s-1 |
| (21-cm) | mJy |
| Position angleeeBased on the kinematic major axis of the H i velocity field (see §8.2.4) | 172.0 |
| InclinationaaFrom tilted-ring rotation curve fit. | 33 |
| aaFrom tilted-ring rotation curve fit. | 87 km s-1 |
| Derived Quantities | |
| ffAssuming the H i is optically thin and is the distance to NGC 2537 expressed in units of 7 Mpc. | |
| ggFrom , where we have taken kpc (160′′) and 87 km s-1. | 9.5 |
| 2.5 | |
| 43 | |
| 3.5 | |
| Major axis distance (arcsec) | Circular Velocity (km s-1) | Uncertainty (km s-1) |
|---|---|---|
| -165.0 | 497.5 | 3.2 |
| -156.0 | 492.0 | 2.0 |
| -147.0 | 491.2 | 3.2 |
| -138.0 | 493.5 | 3.1 |
| -129.0 | 485.8 | 5.3 |
| -120.0 | 503.2 | 7.6 |
| -111.0 | 497.8 | 5.4 |
| -102.0 | 493.2 | 2.8 |
| -93.0 | 487.8 | 3.8 |
| -84.0 | 486.9 | 1.8 |
| -75.0 | 488.6 | 1.1 |
| -66.0 | 492.9 | 0.7 |
| -57.0 | 490.6 | 0.9 |
| -48.0 | 486.6 | 0.8 |
| -39.0 | 484.4 | 0.8 |
| -30.0 | 483.8 | 0.9 |
| -21.0 | 479.2 | 1.0 |
| -12.0 | 471.8 | 1.4 |
| -3.0 | 461.8 | 2.4 |
| 6.0 | 442.4 | 2.8 |
| 15.0 | 417.4 | 2.1 |
| 24.0 | 410.0 | 1.3 |
| 33.0 | 411.4 | 2.8 |
| 42.0 | 411.4 | 8.0 |
| 51.0 | 412.5 | 5.2 |
| 60.0 | 409.4 | 1.9 |
| 69.0 | 400.0 | 3.0 |
| 78.0 | 402.6 | 1.3 |
| 87.00 | 403.1 | 1.9 |
| 96.0 | 394.6 | 5.6 |
| 105.0 | 384.6 | 8.0 |
| 114.0 | 408.0 | 1.3 |
| 123.0 | 396.0 | 5.3 |
| 132.0 | 401.1 | 1.5 |
| 141.0 | 404.0 | 1.7 |
| 150.0 | 405.1 | 1.5 |
| 159.0 | 395.1 | 1.6 |
8.2.4 The H i Kinematics of NGC 2537
The H i velocity field shown in Figure 17 reveals that NGC 2537 exhibits well-ordered rotation. Note that the H i arm mentioned in the previous section participates in the regular disk rotation (although a series of kinks can be seen in the isovelocity contours as they cross the region between the arm and the main disk). While BCDs as a class are in general rotationally-supported, only a small fraction exhibit the type of well-ordered velocity field seen in NGC 2537 (cf. van Zee et al. 1998,2001; Thuan et al. 2004).
In Figure 19 we show a P-V diagram extracted along the kinematic major axis of NGC 2537 (lying at PA; see below). To improve signal-to-noise, we have averaged over a 15′′-wide strip. Using the data shown in Figure 19, we have also measured a disk rotation curve for NGC 2537 by fitting intensity-weighted Gaussians to a series of one-dimensional slices extracted at 9′′ intervals along the major axis. The result is shown in Figure 20 and provided in electronic form in Table 7. Despite the rather high central velocity dispersion observed in NGC 2537 (see below) we have not applied corrections to the observed rotation curve for asymmetric drift. We estimate that such corrections are likely to be significant (%) only within the centralmost regions of the galaxy (), and the corrections to individual points are difficult to compute accurately with only a few resolution elements across this portion of the galaxy (cf. Meurer et al. 1996; Masset & Bureau 2003). Even without correcting for asymmetric drift, we find the rotation curve of NGC 2537 rises rather steeply, reaching a plateau within ( kpc, i.e., two beam widths). Beyond this, a more extended region is seen on both sides of the disk. This extended portion is nearly flat, although it continues to rise slightly with increasing galactocentric distance. Superposed on the outer, nearly flat portion of the rotation curve, a series of “wiggles” with amplitude 10 km s-1 is visible. The onset of these velocity undulations corresponds with the observed edge of the stellar disk.
Based on the rotation curve in Figure 20, the peak observed rotation velocity of NGC 2537 is 50 km s-1. Correcting this to the true rotational velocity requires an estimate of the inclination of the galaxy. The morphology of this BCD makes an inclination determination from optical images difficult, as the intrinsic flattening of this type of galaxy is poorly known. To better constrain the inclination and other kinematic properties of NGC 2537, we have used the velocity-field analysis method of van Moorsel & Wells (1985) which models the galaxy as a rotating thin disk. Assuming an exponential parameterization of the rotation curve leads to rapid convergence but also shows that the bright central ring is tilted with respect to the rest of the galaxy. Fitting the region outside the central (in radius) results in an inclination angle of , whereas the region of bright H i clumps is well fit by a rotating ring with an inclination of . Both regions yield a consistent center of rotation at = 08h 13m 14.84s (); = +45∘ 59′ (), where the errors are formal values derived from the fits. The systemic velocities derived from both fits are consistent as well, yielding an average value of km s-1. The major axis is found to lie at PA, with both fits again showing good agreement. Finally, the deprojected rotational velocities are km s-1 for the “ring” and km s-1 for the asymptotic (maximum) rotational velocity of the disk of the galaxy. The two velocity curves join smoothly at the radial distance of . This value of is surprisingly high for an optically tiny galaxy like NGC 2537, and it exceeds most of the values measured for other BCDs, which tend to be a factor of two smaller (van Zee et al. 1998), although a few exceptions are known (e.g., Meurer et al. 1996). Nonetheless, the rather large derived for NGC 2537 is congruous with the shape of its rotation curve, which shows a turnover and extended flat portion as opposed to the solid body-type rotation curve seen in lower-mass dwarfs.
8.2.5 HI Velocity Dispersion
A map of the line-of-sight H i velocity dispersion in NGC 2537 is shown in Figure 17d. A radial gradient in the velocity dispersion is apparent, with values ranging from 4-8 km s-1 in the galaxy outskirts to as high as 25 km s-1 near the center. The values in the outskirts are comparable to the canonical values of 6-9 km s-1 typical of both dwarf and spiral galaxies; however, the values near the disk center reach a significant fraction of the rotational velocity in the disk, implying appreciable pressure support. The gas with the highest measured velocity dispersions coincides with the location of the bright star forming regions in the stellar disk of NGC 2537, although a few areas with km s-1 are also seen outside the stellar disk. A similar pattern of H i velocity dispersion has also been observed in other BCDs, including NGC 2915 (Meurer et al. 1996). In this latter case, Wada et al. (2002) argued that a stellar bar is responsible for driving the high central turbulence. However, NGC 2537 does not show any sign of a stellar bar, implying that another mechanism (most likely feedback from star formation) is responsible for the elevated velocity dispersion.
9 Discussion
9.1 The Origin of the Structural and Kinematic Features of the IC 2233 Disk
In earlier sections we have drawn attention to a variety of interesting features of the H i distribution and kinematics of IC 2233, including warping and flaring of the H i layer; a corrugated vertical structure; lopsidedness in the H i intensity distribution, global H i profile and P-V diagrams; and evidence for vertically-extended, rotationally anomalous gas. Here we discuss possible origins for these various features and note the likelihood that some or all of these phenomena may share a common origin.
Some of the features of IC 2233 are known to be quite common in disk galaxies. For example, the study of García-Ruiz et al. (2002) established that warping is nearly ubiquitous in disk galaxies and affects nearly 100% of galaxies where the H i disk extends beyond the stellar distribution. Similarly, lopsidedness in the stellar and gas distributions is now well known to affect a significant fraction of galaxies (Richter & Sancisi 1994; Zaritsky & Rix 1997; Haynes et al. 1998), and asymmetries seem to be even more common among extreme late-type disks, affecting more than half of such systems (Matthews et al. 1998). To date, rotationally anomalous extraplanar H i and disk corrugations have been confirmed in only a handful of galaxies (see §6.4,§7.2), but relatively few investigators have searched systematically for these phenomena, thus their frequency of occurrence is not yet known.
Tidal interactions and minor mergers frequently have been invoked to explain a variety of structural and kinematic phenomena in galaxies. For example, tidal interactions have been suspected as a key trigger of galaxy lopsidedness (e.g., Zaritsky & Rix 1997) and have been proposed as a possible driver of warps (e.g., Weinberg 1995) and of disk corrugations (e.g., Edelsohn & Elmegreen 1997). This raises the possibility that this process could be shaping IC 2233. Indeed, we chose to observe IC 2233 as a suspected “victim” of a tidal encounter (see §1). However, numerical simulations predict that most tidally-induced disturbances will be rather short-lived, and prevalent only during the interval when the minor merger is ongoing (Walker et al. 1996; Sellwood et al. 1998; Noguchi 2001; Bournaud et al. 2005). Our observations do not support this scenario, as we find no neighbor with sufficient mass to induce tidal effects in IC 2233, and we have not identified any stellar or gaseous remnant of a possible intruder.
In §2 we noted the lack of any candidates for bona fide companions to IC 2233 based on optical data and argued that its previously suspected neighbor, NGC 2537, most likely lies at a different distance. Furthermore, our H i observations of both galaxies show that even if they lay at similar distances, NGC 2537 and IC 2233 would not constitute a bound pair. Assuming a minimum separation (equal to the projected separation at 10 Mpc), a relative velocity equal to the difference in the recessional velocities, and total galaxy masses equal to the dynamical masses given in Tables 3 and 6, then the kinetic energy of the system ( erg) would exceed the potential energy ( erg) by roughly a factor of 3. Furthermore, the velocity separation of the centers of mass of the galaxies exceeds their “flat” rotational velocities, again indicating that the galaxies are not gravitationally bound. Finally, a comparison of Figures 11 and 17 shows that any interaction would have been retrograde, thus minimizing its dynamical effects (e.g., Velazquez & White 1999). Consistent with these arguments, our deep H i observations of IC 2233 and NGC 2537 have failed to uncover any overt signatures of a recent or ongoing interaction, such as tidal debris or counter-rotating gas.
To investigate the environment of IC 2233 further, we have also performed a systematic search for gas-rich neighbors using the matched-filter method described in Paper I. We explored a region over the velocity interval covered by our observations (see Table 2) and searched for signals with velocity widths of up to 40 km s-1. This search uncovered seven features with amplitudes , but none greater than . Four of the features are positive (emission) features, while three are negative, suggesting these simply represent the expected Gaussian tail of the noise distribution. Moreover, none of the positive features have optical counterparts in the SDSS data (see §2). We therefore do not consider any of these to be likely candidates for companions to IC 2233. Based on these results, we derive an (8) upper limit to the H i mass of any companions to IC 2233 of within a radius of 30′ ( kpc). Similar limits for NGC 2537 are within kpc.
If the properties of IC 2233 cannot readily be accounted for by a recent interaction, it is necessary to consider alternative explanations. For example, Levine & Sparke (1998) and Noordermeer et al. (2001) have proposed that galaxy lopsidedness may be linked to the disk lying offset from the center of its global potential. Noordermeer et al. (2001) presented some predictions of this model that can be compared with observations. The details depend on whether the disk rotates prograde or retrograde relative to the halo. However, in general the models predict: (1) modest asymmetries in shape and extent of the two sides of the major axis P-V curve, with the more extended side showing a slight velocity decrease and the less extended side showing a slight “upturn” near the last measured point; (2) a global H i profile with a higher peak on the side corresponding to the more extended side of the rotation curve and a lower, sloping horn on the opposite side; (3) various degrees of twisting or distortion of the velocity field (which depend on the orientation of the axis of symmetry of the disk relative to the observer). All of these signatures are observed in IC 2233 (Figures 7, 11, 12). Unfortunately, Noordermeer et al. (2001) did not offer specific suggestions as to what mechanism might lead to an offset between the disk and the overall galactic potential.
There are intriguing similarities between the velocity field, rotation curve, and global H i profile of IC 2233 and those of the dwarf LSB spiral NGC 4395 (see Swaters et al. 1999; Noordermeer et al. 2001), a galaxy we have suggested might be an analog of IC 2233 observed face-on (§6.3). NGC 4395 is not known to be tidally interacting or undergoing a minor merger, hence these similarities suggest the possibility of a more universal and continuous driver for these traits in low-mass, late-type disks (see also Wilcots & Prescott 2004). Spontaneously arising asymmetries (e.g., those linked with spiral arm formation) are one possibility, although Bournaud et al. (2005) argue that in most instances these are likely to be too weak; these authors suggest instead that a more promising explanation is the continuing cosmological accretion of gas. Cosmological models predict that such infall should continue to the present day, particularly in low-density field environments such as those inhabited by IC 2233 and NGC 4395 (e.g., Kereš et al. 2005).
The possibility that IC 2233 might be continuing to accrete material from the IGM is intriguing in light of several other recent theoretical studies that predict that cosmological accretion can account for a variety of properties observed in isolated galaxies, including the presence of anomalously rotating extraplanar gas (Fraternali et al. 2007) and warping of the disk (Jiang & Binney 1999; Shen & Sellwood 2006). While none of these studies specifically investigated whether disk corrugations might also be triggered by slow gas accretion, previous studies linking corrugations with warps (Nelson 1976; Sparke 1995; Masset & Tagger 1997) and velocity undulations with disk lopsidedness (Schoenmakers et al. 1997) suggest this would be an interesting topic for further research. Additional high-resolution, high-sensitivity H i studies of apparently isolated, low-mass spirals would also help to establish how ubiquitous the simultaneous appearance of these various phenomena is in the absence of close neighbors and permit more rigorous comparisons with the morphological and kinematic signatures of gaseous infall predicted by models.
9.2 A Comparison between NGC 2537 and IC 2233: Clues to their Evolutionary Histories
As emphasized by Matthews & Gallagher (1997), one intriguing aspect of extreme late-type disk galaxies is the existence of such a diversity of disk morphologies within a relatively narrow range of mass and luminosity (see also Noguchi 2001). IC 2233 and NGC 2537 are two excellent illustrations of this contrast; both are rotationally-dominated galaxies having similar peak rotational velocities, dynamical masses, and blue luminosities (see Tables 3 & 6), yet they exhibit a variety of differences in terms of their optical and H i morphologies. We now briefly comment on the possible origin and implications of these differences.
One key difference between IC 2233 and NGC 2537 becomes apparent from a comparison of their respective disk rotation curves (Figures 14 & 20). Compared with IC 2233, the rotation curve of NGC 2537 rises far more steeply in the central regions, implying a much higher central mass concentration. Indeed, such enhanced central mass concentrations appear to be a hallmark of BCDs (e.g., van Zee et al. 1998).
Previous authors have suggested that BCDs might represent a brief starbursting state of ordinary dwarf galaxies (e.g., Taylor et al. 1993; Papaderos et al. 1996). While we cannot rule out such a scenario for some low-mass BCDs, our present observations suggest that it is unlikely that a galaxy like NGC 2537 will ever evolve into a “normal” LSB disk galaxy (e.g., similar to IC 2233), or vice versa.
If a tidal interaction or minor merger were invoked to explain a transition from LSB disk to starbursting BCD (e.g., Taylor 1997), one difficulty would be to account for the properties of the outer gas disk of NGC 2537, which appears quite dynamically cold with no signs of recent dynamical heating or perturbations. Moreover, in contrast to typical gas-rich LSB spirals—which tend to have blue outer disks, shallow light profiles, and little central light concentration—the underlying stellar disk of NGC 2537 is old, red, and compact; thus it is unclear that the required pre-merger progenitor would resemble any ordinary class of disk galaxy. Finally, we note that NGC 2537 seems to join an increasing number of BCDs that are found to reside in rather isolated environments (Telles & Terlevich 1995; van Zee et al. 1998).
As an alternative means of linking BCD and LSB/dwarf disk galaxies, Papaderos et al. (1996) proposed that the reverse transition (from BCD to LSB) might occur via secular evolution processes. However, this would necessitate a large-scale redistribution of mass, presumably via starburst-driven winds followed by cooling and infall of this gas from the halo. While this might be possible for extremely low-mass dwarfs, this requirement is particularly problematic for NGC 2537, since its gravitational potential is too steep to permit substantial mass-loss via mechanical energy from stellar winds and supernovae (see e.g., Ferrara & Tolstoy 2000).
Given the above difficulties, the current body of observations of NGC 2537 seems to be most consistent with the suggestion that at least some BCDs are a special subset of low-mass disk galaxies whose central mass concentrations lie at the extreme end of the present-day distribution (Salzer & Norton 1999; Ferrara & Tolstoy 2000; Noguchi 2001). Models by Noguchi (2001) predict that viscous evolution would be particularly efficient in such centrally-concentrated galaxies, thus giving a natural explanation for their ability to funnel gas inwards to fuel episodic central starbursts; in contrast, his models predict that the low central mass densities of LSB galaxies like IC 2233 will help them to maintain a fairly flat and largely subcritical H i surface density across much of their disk. We conclude that IC 2233 and NGC 2537 are therefore examples of small disk galaxies that have evolved in relative isolation, and whose inherent structural differences have allowed them to preserve important differences in their morphologies and star-forming properties.
10 Summary
We have presented VLA H i imaging of the edge-on Sd ‘superthin’ spiral galaxy IC 2233 as well as the blue compact dwarf (BCD) NGC 2537. We have also described results from new optical , , and H imaging and photometry for IC 2233.
We confirm that IC 2233 is an intrinsically LSB galaxy, having a deprojected central surface brightness mag arcsec-2 and an extremely low H i surface density over its entire disk ( pc-2). Similar to many other late-type, LSB galaxies, the H i component of IC 2233 comprises a significant fraction of its observed baryons (0.83 ). Despite evidence for localized ongoing star formation in IC 2233 in the form of prominent H ii complexes and shells, red and blue supergiant stars, and a very blue integrated color [], we detect no significant 21-cm radio continuum emission from the galaxy, and the global star formation rate inferred from the H emission and from the IRAS FIR emission both imply an extremely low globally-averaged star formation rate ( yr-1).
Both the H i and ionized gas disks of IC 2233 are clumpy and vertically distended, exhibiting scale heights comparable to that of the young stellar disk. The thickness of both the gas and the stars flares with increasing galactocentric radius. We have quantified the flaring of the H i disk and estimate an increase in scale height of a factor of two across the galaxy. We find evidence that IC 2233 also contains a component of “anomalous” extraplanar H i emission whose rotation does not follow that of the material in the midplane. Future three-dimensional kinematic modeling should help to confirm whether this material comprises a part of a rotationally lagging H i halo similar to those now confirmed in a number of other spiral galaxies.
The H i disk of IC 2233 exhibits a mild lopsidedness as evidenced by differences in the H i intensity distribution on the two sides of the disk, differences in shape and extent of the major axis P-V curves on the two sides of the galaxy, and by the asymmetric shape of the global H i profile. The origin of this lopsidedness is unclear, although its kinematic signatures are consistent with model predictions for a disk lying offset from the center of its overall halo potential.
A particularly intriguing feature of the H i disk of IC 2233 is the presence of a global corrugation pattern with a period of kpc and an amplitude of pc. These undulations may represent bending instabilities or be linked to underlying spiral structure. Their presence suggests that the optically diffuse disk of IC 2233 is largely self-gravitating. Outside of the stellar disk, a mild warp of the H i disk is also observed.
The properties of IC 2233 form an interesting contrast to those of the LSB superthin galaxy UGC 7321 (Paper I). Although IC 2233 is only a factor of two less massive than UGC 7321, its kinematic characteristics resemble those of a solid-body rotator (§7.2), while those of UGC 7321 are more similar to those of a giant spiral. The stellar disk as well as the neutral and ionized gas layers of IC 2233 are intrinsically thicker than those of UGC 7321 and exhibit far more complex structure. These differences may reflect in part the weaker self-gravity of the IC 2233 disk and the decreasing importance of rotation shear. The respective properties of IC 2233 and UGC 7321 are consistent with previous suggestions that important changes occur in the structural and ISM properties of galaxies over the mass interval corresponding to 100 km s-1 (Dalcanton et al. 2004; Matthews et al. 2005).
We have confirmed that the BCD NGC 2537 is a rotationally-dominated galaxy and estimate its maximum (deprojected) rotational velocity to be 87 km s-1. This is at the high end of values observed for BCDs. The steep inner rise of its rotation curve indicates a high central matter density.
The H i velocity field of NGC 2537 is quite regular and shows no obvious signs of recent perturbations. An arm-like feature in the outer H i disk shows regular rotation and does not appear to be tidal in origin. The H i disk of NGC 2537 extends to 3.5 times the () diameter of its stellar disk, and its outer regions appear dynamically cold and fragmented. In the inner H i disk we measure H i velocity dispersions as high as km s-1, indicative of significant turbulent motions. The inner disk also exhibits a tilted H i ring with a diameter of kpc and peak column density of atoms cm-2— several times higher than that of the surrounding gas.
Several of the properties of of IC 2233, including its lopsidedness, warped H i disk, disk corrugations, and the presence of anomalously rotating, vertically extended H i emission, might seem readily explained by a recent interaction or minor merger, but we have not uncovered any direct evidence of such an event. We also argue that NGC 2537 is unlikely to be the required perpetrator. Indeed, both IC 2233 and NGC 2537 each appear to be evolving in relative isolation. Although IC 2233 and NGC 2537 have sometimes been described as a “binary pair” in the past literature, recent distance estimates suggest they probably lie at different distances. Moreover, even if they lay at the same distance, our data show they would not form a bound pair and any encounter would have been retrograde, implying that any mutual interaction would have had minimal impact on the properties of the two galaxies. Our search for other companions to both galaxies using imaging and spectroscopic data from the SDSS as well as our new H i data have failed to identify any additional candidates for close neighbors. Slow, continuing accretion of intergalactic gas may be one means of accounting for a number of the observed properties of IC 2233 in the absence of a companion. In the case of NGC 2537, the intrinsically high central matter density of the galaxy coupled with efficient viscous evolution may account for its bursting state without the need for a recent interaction.
References
- (1) Abadi, M. G., Navarro, J. F., Steinmetz, M., Eke, V. R. 2003, ApJ, 591, 499
- (2)
- (3) Alfaro, E. J. & Efremov, Y. N. 1996, RMxAC, 4, 1
- (4)
- (5) Alfaro, E. J., Pérez, E., González Delgado, R. M., Martos, M. A., & Franco, J. 2001, ApJ, 550, 253
- (6)
- (7) Alton, P. B., Davies, J. I., & Bianchi, S. 1999, A&A, 343, 51
- (8)
- (9) Baldwin, J. E., Lynden-Bell, D., & Sancisi, R. 1980, MNRAS, 193, 313
- (10)
- (11) Bell, E. F. 2003, ApJ, 586, 794
- (12)
- (13) Bergvall, N. & Rönnback, J. 1995, MNRAS, 273, 603
- (14)
- (15) Binney, J. & Tremaine, S. 1987, Galactic Dynamics, (Princeton: Princeton University Press)
- (16)
- (17) Bizyaev, D. & Mitronova, S. 2002, A&A, 389, 795
- (18)
- (19) Bos, A. 1984, in Indirect Imaging, ed. J. A. Roberts, (Cambridge: Cambridge University Press), 239
- (20)
- (21) Bos, A. 1985, PhD dissertation, University of Groningen
- (22)
- (23) Bosma, A. 2002, in Disks of Galaxies: Kinematics, Dynamics, and Perturbations, ed. E. Athanassoula, A. Bosma, and R. Mujica, ASP Conf. Series, Vol. 275 (San Francisco:ASP), 23
- (24)
- (25) Bottinelli, L., Gouguenheim, L., Fouqué, P. & Paturel, G. 1990, A&AS, 82, 391
- (26)
- (27) Bournaud, F., Combes, F., Jog, C. J., & Puerari, I. 2005, A&A, 438, 507
- (28)
- (29) Bridges, T. J., Carter, D., Harris, W. E., & Pritchet, C. J. 1996, MNRAS, 281, 1290
- (30)
- (31) Briggs, D. S. 1995, Ph.D. Dissertation, New Mexico Institute of Mining and Technology, Socorro, NM (http://www.aoc.nrao.edu/ftp/dissertations/dbriggs/diss.html), p. 64
- (32)
- (33) Brinks, E., Walter, F., & Ott, J. 2002, in Disks of Galaxies: Kinematics, Dynamics, and Perturbations, ASP Conf. Series, Vol. 275, ed. E. Athanassoula, A. Bosma, & R. Mujica, 57
- (34)
- (35) Burton, W. B. 1988, in Galactic and Extragalactic Radio Astronomy, Second Edition, ed. G. L. Vershuur and K. I. Kellermann (New York: Springer-Verlag), 295
- (36)
- (37) Cayatte, V., Kotanyi, C., Balkowski, C., & van Gorkom, J. H. 1994, AJ, 107, 1003
- (38)
- (39) Condon, J. J. 1992, ARA&A, 30, 575
- (40)
- (41) Condon, J. J., Cotton, W. D., Greisen, E. W., Yin, Q. F., Perley, R. A., Taylor, G. B., & Broderick, J. J. 1998, AJ, 115, 1693
- (42)
- (43) Cornwell, T. J., Uson, J. M., & Haddad, N. 1992, A&A, 258, 583
- (44)
- (45) Dalcanton, J. J., Yoachim, P., & Bernstein, R. A. 2004, ApJ, 608, 189
- (46)
- (47) Davis, L. E. & Seaquist, E. R. 1983, ApJS, 53, 269
- (48)
- (49) de Vaucouleurs, G., de Vaucouleurs, A., & Corwin, H. G. 1976, Second Reference Catalogue of Bright Galaxies (Austin: University of Texas Press)
- (50)
- (51) de Vaucouleurs, G., de Vaucouleurs, A., Corwin, H. G. Jr., Buta, R. J., Paturel, G., & Fouqué, P. 1991, The Third Reference Catalogue of Bright Galaxies (New York: Springer)
- (52)
- (53) Dickey, J. M. 1996, in Unsolved Problems of the Milky Way, IAU Symp. 169, ed. L. Blitz & P. Teuben, 489
- (54)
- (55) Dohm-Palmer, R. C. & Skillman, E. D. 2002, AJ, 123, 1433
- (56)
- (57) D’Onghia, E. & Burkert, A. 2004, ApJ, 612, 13
- (58)
- (59) Edelsohn, D. J. & Elmegreen, B. G. 1997 MNRAS, 287, 947
- (60)
- (61) Eliche-Moral, M. C., Balcells, M., Aguerri, J. A. L., & González-Garía, A. C. 2006, A&A, 457, 91
- (62)
- (63) Elmegreen, B. G. & Hunter, D. A. 2000, ApJ, 540, 814
- (64)
- (65) Elmegreen, B. G. & Parravano, A. 1994, ApJ, 435, L121
- (66)
- (67) Ferguson, A. M. N. 1998, PhD thesis, Johns Hopkins University
- (68)
- (69) Ferguson, A. M. N., Wyse, R. F. G., Gallagher, J. S., & Hunter, D. A. 1998, ApJ, 506, L19
- (70)
- (71) Ferrara, A. & Tolstoy, E. 2000, MNRAS, 313, 291
- (72)
- (73) Fisher, J. R. & Tully, R. B. 1981, ApJS, 47, 139
- (74)
- (75) Fleurier, C. & Chapelle, J. 1974, Computer Physics Communications, 7, 200
- (76)
- (77) Florido, E., Battaner, E., Gros, A., Prieto, M., & Mediavilla, E. 1992, Ap&SS, 190, 293
- (78)
- (79) Florido, E., Battaner, E., Sanchez-Saavedra, M. L., Prieto, M., & Mediavilla, E. 1991, MNRAS, 251, 193
- (80)
- (81) Fraternali, F., Binney, J., Oosterloo, T., Sancisi, R. 2007, NewAR, 51, 95
- (82)
- (83) Fraternali, F., Oosterloo, T., Sancisi, R., & van Moorsel, G. A. 2001, ApJ, L47
- (84)
- (85) Fuchs, B. 2002, in Dark Matter in Astro- and Particle Physics, ed. H. V. Klapdor-Kleingrothaus and R. D. Viollier, (Berlin: Spriner), 28
- (86)
- (87) Fuchs, B. 2003 Ap&SS, 284, 719
- (88)
- (89) García-Ruiz, I., Sancisi, R., & Kuijken, K. 2002, A&A, 394, 769
- (90)
- (91) Garrido, O. Marcelin, M. & Amram, P. 2004, MNRAS, 349, 225
- (92)
- (93) Gerritsen, J. P. E. & de Blok, W. J. G. 1999, A&A, 342, 655
- (94)
- (95) Gil de Paz, A., Silich, S. A., Madore, B. F., Sánchez Contreras, C., Zamorano, J., & Gallego, J. 2002, ApJ, 573, L101
- (96)
- (97) Gil de Paz, A., Zamorano, J., & Gallego, J. 2000a, A&A, 361, 465
- (98)
- (99) Gil de Paz, A., Zamorano, J., Gallego, J., & Domínguez, F. de B. 2000b, A&AS, 145, 377
- (100)
- (101) Goad, J. W. & Roberts, M. S. 1981, ApJ, 250, 79
- (102)
- (103) Griv, E. & Chiueh, T. 1998, ApJ, 503, 186
- (104)
- (105) Gum, C. S., Kerr, F. J., & Westerhout, G. 1960, MNRAS, 121, 132
- (106)
- (107) Haynes, M. P., Giovanelli, R., Chamaraux, P., da Costa, L. N., Freudling, W., Salzer, J. J., & Wegner, G. 1999, AJ, 117, 2039
- (108)
- (109) Haynes, M. P., van Zee, L., Hogg, D. E., Roberts, M. S., & Maddalena, R. J. 1998, AJ, 115, 62
- (110)
- (111) Hofner, P. & Sparke, L. S. 1994, ApJ, 428, 466
- (112)
- (113) Huchtmeier, W. K. & Richter, O.-G. 1986, A&AS, 63, 323
- (114)
- (115) Hunter, D. A., van Woerden, H., & Gallagher, J. S. 1999, AJ, 118, 2184
- (116)
- (117) Iono, D., Yun, M. S., & Mihos, J. C. 2004, ApJ, 616, 199
- (118)
- (119) Israel, F. P. & van Driel, W. 1990, A&A, 236, 323
- (120)
- (121) Jiang, I. G. & Binney, J. 1999, MNRAS, 303, L7
- (122)
- (123) Johnson, H. L. 1966, ARA&A, 4, 193
- (124)
- (125) Karachentsev, I. D., Karachentseva, V. E., Kudrya, Y. N., Sharina, M. E., & Parnovsky, S. L. 1999, BSAO, 47, 5
- (126)
- (127) Kautsch, S. J., Grebel, E. K., Barazza, F. D., & Gallagher, J. S. III, 2006, A&A, 445, 765
- (128)
- (129) Kennicutt, R. C. Jr. 1989, ApJ, 344, 685
- (130)
- (131) Kennicutt, R. C. Jr. 1998, ARA&A, 36, 189
- (132)
- (133) Kereš, D., Katz, N., Weinberg, D. H., & Davé, R. 2005, MNRAS, 363, 2
- (134)
- (135) Kewley, L. J., Geller, M. J., Jansen, R. A., & Dopita, M. A. 2002, ApJ, 124, 3135
- (136)
- (137) Kim, W.-T. & Ostriker, E. C. 2006, ApJ, 646, 213
- (138)
- (139) Kormendy, J. & Fisher, D. B. 2005, RevMexAA, 23, 101
- (140)
- (141) Landolt, A. U. 1992, AJ, 104, 340
- (142)
- (143) Levine, S. E. & Sparke, L. S. 1998, ApJ, 503, 125
- (144)
- (145) Lockman, F. J. 1977, AJ, 82, 408
- (146)
- (147) Mac Low, M.-M. & McCray, R. 1988, ApJ, 324, 776
- (148)
- (149) Martos, M. A. & Cox, D. P. 1998, ApJ, 509, 703
- (150)
- (151) Masset, F. S. & Bureau, M. 2003, ApJ, 586, 152
- (152)
- (153) Masset, F. & Tagger, M. 1997, A&A, 318, 747
- (154)
- (155) Matthews, L. D. 2000, AJ, 120, 1764
- (156)
- (157) Matthews, L. D. & Gallagher, J. S. III. 1997, AJ, 114, 1899
- (158)
- (159) Matthews, L. D., Gallagher, J. S. III, & van Driel, W. 1999, AJ, 118, 2751
- (160)
- (161) Matthews, L. D., Gao, Y., Uson, J. M., & Combes, F. 2005, AJ, 129, 1849
- (162)
- (163) Matthews, L. D., van Driel, W., & Gallagher, J. S. III, 1998, AJ, 116, 1169
- (164)
- (165) Matthews, L. D. & Wood, K. 2003, ApJ, 593, 721
- (166)
- (167) Meier, D. D., Turner, J. L., Crosthwaite, L. P., & Beck, S. C. 2001, ApJ, 121, 740
- (168)
- (169) Meurer, G. R., Carignan, C., Beaulieu, S. F., & Freeman, K. C. 1996, AJ, 111, 1551
- (170)
- (171) Miller, S. T. & Veilleux, S. 2003, ApJ, 592, 79
- (172)
- (173) Nelson, A. H. 1976, MNRAS, 174, 661
- (174)
- (175) Noguchi, M. 2001, ApJ, 555, 289
- (176)
- (177) Noordermeer, E., Sparke, L. S., & Levine, S. E. 2001, MNRAS, 328, 1064
- (178)
- (179) Olling, R. P. 1996, AJ, 112, 457
- (180)
- (181) Oosterloo, T. 1993, A&A, 272, 389
- (182)
- (183) Papaderos, P., Loose, H.-H., Fricke, K. J., & Thuan, T. X. 1996, A&A, 314, 59
- (184)
- (185) Pietrzński, G., Ulaczyk, K., Gieren, W., Bresolin, F., & Kudritzki, R. P. 2005, A&A, 440, 783
- (186)
- (187) Pohlen, M., Dettmar, R.-J., Lütticke, R., & Schwarzkopf, U. 2000, A&AS, 144, 405
- (188)
- (189) Quinn, P. J. 1987 in Nearly Normal Galaxies: From the Planck Time to the Present, ed. S. M. Faber, (New York: Springer), 138
- (190)
- (191) Quiroga, R. J. 1974, Ap&SS, 27, 323
- (192)
- (193) Quiroga, R. J. 1977, Ap&SS, 50, 281
- (194)
- (195) Rand, R. J. 1996, ApJ, 462, 712
- (196)
- (197) Reshetnikov, V. & Combes, F. 1997, A&A, 324, 80
- (198)
- (199) Revaz, Y. & Pfenniger, D. 2004, A&A, 425, 67
- (200)
- (201) Richter, O.-G. & Sancisi, R. 1994, A&A, 290, L9
- (202)
- (203) Saha, K. & Jog, C. J. 2006, A&A, 446, 897
- (204)
- (205) Salzer, J. J. & Norton, S. A. 1999, in The Low Surface Brightness Universe, IAU Colloq. 171, ed. J. I. Davies, C. Impey, and S. Phillips, (ASP: San Francisco), 253
- (206)
- (207) Sánchez-Saavedra, M. L., Battaner, E., Guijarro, A., López-Corredoira, M., & Castro-Rodríguez, N. 2003, A&A, 399, 457
- (208)
- (209) Sancisi, R. & Allen, R. J. 1979, A&A, 74, 73
- (210)
- (211) Schlegel, D. J., Finkbeiner, D. P., & Davis, M. 1998, ApJ, 500, 525
- (212)
- (213) Schneider, S. E. & Salpeter, E. E. 1992, ApJ, 385, 32
- (214)
- (215) Schoenmakers, R. H. M., Franx, M., & de Zeeuw, P. T. 1997, MNRAS, 292, 349
- (216)
- (217) Schwarzkopf, U. & Dettmar, R.-J. 2000, A&A, 361, 451
- (218)
- (219) Sellwood, J. A., Nelson, R. W., & Tremaine, S. 1998, ApJ, 506, 590
- (220)
- (221) Seth, A. C., Dalcanton, J. J., & De Jong, R. S. 2005, AJ, 129, 1331
- (222)
- (223) Seth, A. C., Dalcanton, J. J., Hodge, P. W., & Debattista, V. P. 2006, AJ, 132, 2539
- (224)
- (225) Sharina, M. E., Karachentsev, I. D., & Tikhonov, N. A. 1999, Astr. Lett., 25, 322
- (226)
- (227) Shen, J. & Sellwood, J. A. 2006, MNRAS, 370, 2
- (228)
- (229) Sparke, L. S. 1995, ApJ, 439, 42
- (230)
- (231) Spicker, J. & Feitzinger, J. V. 1986, A&A, 163, 43
- (232)
- (233) Stil, J. & Israel, F. P. 2002a, A&A, 389, 42
- (234)
- (235) Stil, J. & Israel, F. P. 2002b, A&A, 392, 473
- (236)
- (237) Swaters, R. A. & Balcells, M. 2002, A&A, 390, 863
- (238)
- (239) Swaters, R. A., Sancisi, R., & van der Hulst, J. M. 1997, ApJ, 491, 140
- (240)
- (241) Swaters, R. A., Schoenmakers, R. H. M., Sancisi, R., & van Albada, T. S. 1999, MNRAS, 304, 330
- (242)
- (243) Swaters, R. A., van Albada, T. S., van der Hulst, J. M., & Sancisi, R. 2002, A&A, 390, 829
- (244)
- (245) Taylor, C. L. 1997, ApJ, 480, 524
- (246)
- (247) Taylor, C., Brinks, E., & Skillman, E. D. 1993, AJ, 105, 128
- (248)
- (249) Telles, E. & Terlevich, R. 1995, MNRAS, 275, 1
- (250)
- (251) Thuan, T. X., Hibbard, J. E., & Lévrier, F. 2004, AJ, 128, 617
- (252)
- (253) Thuan, T. X. & Martin, G. E. 1981, ApJ, 247, 823
- (254)
- (255) Tifft, W. G. 1990, ApJS, 73, 603
- (256)
- (257) Tikhonov, N. A., Galazutdinova, O. A., & Drozdovsky, I. O. 2006, A&A, submitted (astro-ph/0603457)
- (258)
- (259) Toomre, A. 1981, in The Structure and Evolution of Normal Galaxies, Proc. Adv. Study Inst., (Cambridge University Press: Cambridge), 111
- (260)
- (261) Toomre, A. & Toomre, J. 1972, ApJ, 178, 623
- (262)
- (263) Tully, R. B. 1988, Nearby Galaxies Catalog (Cambridge University Press: Cambridge)
- (264)
- (265) Tully, R. B., Pierce, M. J., Huang, J.-S., Saunders, W., Verheijen, M. A. W., & Witchalls, P. L. 1998, ApJ, 115, 2264
- (266)
- (267) Uson, J. M. 2007, VLA Test Memo #237
- (268)
- (269) Uson, J. M. & Matthews, L. D. 2003, AJ, 125, 2455 (Paper I)
- (270)
- (271) van der Hulst, J. M., Skillman, E. D., Smith, T. R., Bothun, G. D., McGaugh, S. S., & de Blok, W. J. G. 1993, AJ, 106, 548
- (272)
- (273) van der Kruit, P. C. & Shostak, G. S. 1984, A&A, 134, 258
- (274)
- (275) van Moorsel, G. A. & Wells, D. C. 1985, AJ, 90, 1038
- (276)
- (277) van Zee, L., Salzer, J. J., & Skillman, E. D. 2001, AJ, 122, 121
- (278)
- (279) van Zee, L., Skillman, E.D., & Salzer, J. J. 1998, AJ, 116, 1186
- (280)
- (281) Velazquez, H. & White, S. D. M. 1999, MNRAS, 304, 254
- (282)
- (283) Wada, K., Meurer, G., & Norman, C. A. 2002, ApJ, 577
- (284)
- (285) Walker, I. R., Mihos, J. C., & Hernquist, L. 1996, ApJ, 460, 121
- (286)
- (287) Wang, J., Heckman, T. M., & Lehnert, M. D. 1999, ApJ, 515, 97
- (288)
- (289) Weinberg, M. D. 1995, ApJ, 455, L31
- (290)
- (291) Weinreb, S., Balister, M., Maas, S., & Napier, P. J. 1977, IEEE Trans. Microwave Theory Tech., vol. MTT-25, 243
- (292)
- (293) Wilcots, E. M. & Miller, B. W. 1998, AJ, 116, 2363
- (294)
- (295) Wilcots, E. M. & Prescott, M. K. M. 2004, AJ, 127, 1900
- (296)
- (297) Wu, Y., Charmandaris, V., Hao, L., Brandl, B. R., Bernard-Salas, J., Spoon, H. W. W., & Houck, J. R. 2006, ApJ, 639, 157
- (298)
- (299) Yuan, Q.-R. & Zhu, C.-X. 2004, ChA&A, 28, 127
- (300)
- (301) Zaritsky, D. & Rix, H.-W. 1997, ApJ, 477, 118
- (302)