Multi-wavelength Observations of PG 1553+113 with HESS
Abstract
Very high energy (VHE; 100 GeV) -ray observations of PG 1553+113 were made with the High Energy Stereoscopic System (HESS) in 2005 and 2006. A strong signal, 10 standard deviations, is detected by HESS during the 2 years of observations (24.8 hours live time). The time-averaged energy spectrum, measured between 225 GeV to 1.3 TeV, is characterized by a very steep power law (photon index of ). The integral flux above 300 GeV is 3.4% of the Crab Nebula flux and shows no evidence for any variations, on any time scale. H+K (1.452.45m) spectroscopy of PG 1553+113 was performed in March 2006 with SINFONI, an integral field spectrometer of the ESO Very Large Telescope (VLT) in Chile. The redshift of PG 1553+113 is still unknown, as no absorption or emission lines were found.
1 Introduction
Evidence for VHE (100 GeV) -ray emission from the high-frequency-peaked BL Lac object PG 1553+113 was first reported by the HESS collaboration [3] based on observations made in 2005. This detection was later confirmed [6] with MAGIC observations in 2005 and 2006. The measured VHE spectra are unusually soft (photon index =4.00.6 and =4.20.3 for the HESS and MAGIC experiments, respectively) but the errors are large, clearly requiring improved measurements before detailed interpretation of the complete SED is possible. Further complicating any SED interpretation is the absorption of VHE photons [10, 11] by pair-production on the Extragalactic Background Light (EBL). This absorption, which is energy dependent and increases strongly with redshift, distorts the VHE energy spectra observed from distant objects. For a given redshift, the effects of the EBL on the observed spectrum can be reasonably accounted for during SED modeling. Unfortunately, the redshift of PG 1553+113 is unknown, despite many attempts to measure it (see, e.g., [8, 16]).
In 2005 and 2006, a total of 30.3 hours of HESS observations were taken on PG 1553+113. The 2005 HESS observations are exactly the same as reported in [3]. The good-quality exposure is 24.8 hours live time. The data are processed using the standard HESS calibration [2] and analysis tools [7]. Soft cuts [3] are applied to select candidate -ray events, resulting in an average post-analysis energy threshold of 300 GeV at the mean zenith angle of the observations, .
2 HESS Results
| Epoch | Time | Excess | Sig | I(300 GeV) |
|---|---|---|---|---|
| [h] | [] | [f.u.] | ||
| 2005 | 7.6 | 249 | 6.0 | |
| 2006 | 17.2 | 536 | 8.3 | |
| Total | 24.8 | 785 | 10.2 |
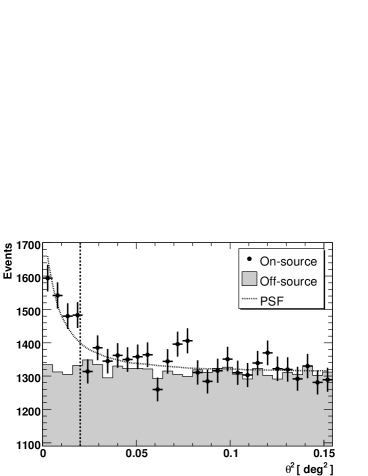
A significant VHE -ray signal is detected in each year of HESS data taking. The total observed excess is 785 events, corresponding to a statistical significance of 10.2 standard deviations (). Table 1 shows the results of the HESS observations of PG 1553+113. Figure 1 shows the on-source and normalized off-source distributions of the square of the angular difference between the reconstructed shower position and the source position () for all observations. The background is approximately flat in as expected, and there is a clear point-like excess of on-source events at small values of , corresponding to the observed signal. The peak of a two-dimensional Gaussian fit to a sky map of the observed excess is coincident with the position of PG 1553+113.
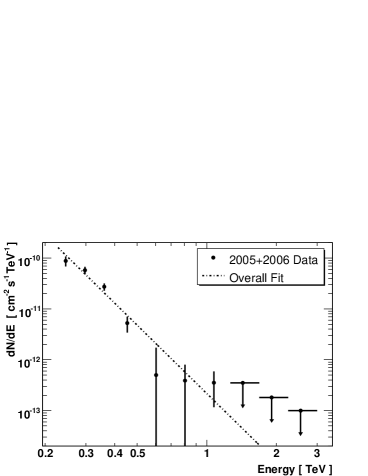
The photon spectrum for the entire data set is shown in Figure 2. These data are well fit ( of 8.4 for 5 degrees of freedom) by a power-law function, d/d, with a photon index . Fits of either a power law with an exponential cut-off or a broken power law do not yield significantly better values.
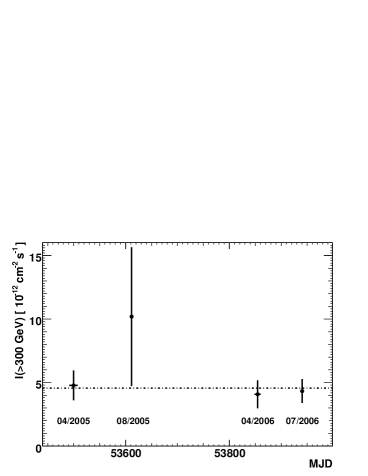
The observed integral flux above 300 GeV for the entire data set is I(300 GeV) = cm-2 s-1. This corresponds to 3.4% of I(300 GeV) determined from the HESS Crab Nebula spectrum [5]. The integral flux, I(300 GeV), is shown in Table 1 for each year of observations. Figure 3 shows the flux measured for each dark period. There are no indications for flux variability on any time scale within the HESS data. The data previously published [3] for HESS observations of PG 1553+113 in 2005 were not corrected for long-term changes in the optical sensitivity of the instrument. Relative to a virgin telescope, the total optical throughput was decreased by 29% in 2005 and 33% in 2006. Correcting [5] for this decrease, using efficiencies determined from simulated and observed muon events, increases the flux measured from the object. The effect of this correction is larger for soft spectrum sources than it is for hard spectrum sources. Due to the correction, the flux measured in 2005 is three times higher than previously published.
On July 24 and 25, 2006, PG 1553+113 was observed by the Suzaku X-ray satellite ([14], Suzaku Observation Log: http://www.astro.isas.ac.jp/suzaku/index.html.en). On these two dates HESS observed PG 1553+113 for 3.1 hours live time, resulting in a marginally significant excess of 101 events (3.9). The average flux measured on these two nights is I(300 GeV) = cm-2 s-1.
3 SINFONI Near-IR Spectroscopy
The determination of the redshift of an AGN is generally based upon the detection of emission or absorption lines in its spectrum. In an attempt to detect absorption features from the host galaxy or emission lines from the AGN, H+K (1.50–2.40m) spectroscopy of PG 1553+113 was performed with SINFONI, an integral field spectrometer mounted at Yepun, Unit Telescope 4 of the ESO Very Large Telescope in Chile. The source was observed on March 9, 2006 and March 15, 2006. The resulting images are spatially unresolved and no underlying host galaxy is detected.
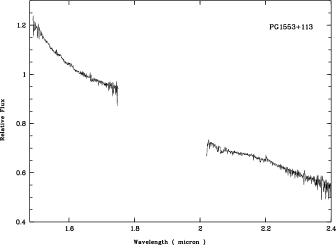
The H+K-band spectrum of PG 1553+113 measured here is shown in Figure 4. The signal-to-noise reach is 250 in the H-band and 70 in the K-band. The observed near-IR spectrum is featureless apart from some residuals from the atmospheric corrections. Thus in neither the broad-band images nor in the spectrum are the influences of the gas of a host galaxy or the AGN detected, even though PG 1553+113 is bright in the IR. As a result, a redshift determination from these observations is not possible.
4 Discussion
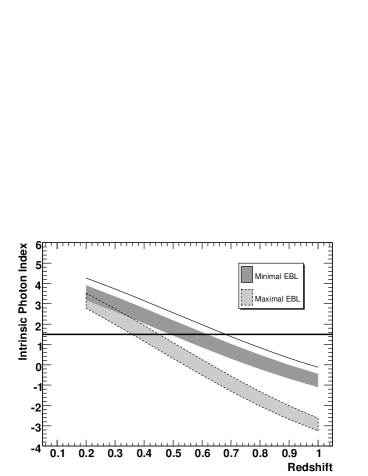
As the redshift of PG 1553+113 is likely , the observed VHE spectrum should be strongly affected by VHE -ray absorption on the EBL. If the redshift were known the spectrum intrinsic to the source could be reconstructed assuming a model of the EBL density. However, the EBL SED is not well-determined. Using a Maximal EBL model at the level of the upper limits from [4] or a Minimal model near the EBL lower limits from galaxy counts [12] can yield a significantly different intrinsic spectrum. Figure 5 shows the intrinsic spectrum versus redshift for both the Maximal and Minimal EBL parameterizations. Here, scaled models of [13] are used, exactly as described in [3]. The redshift of the AGN can be limited using assumptions for the intrinsic spectrum. Assuming the intrinsic photon index is not harder than , a limit of is thus determined from the Minimal EBL model.
5 Conclusion
With a 25 h data set, 3 times larger than previously published [3], the HESS signal from PG 1553+113 is now highly significant (10). Thus the evidence for VHE emission from PG 1553+113 previously reported is now clearly verified. However, the flux observed in 2005 is now 3 times higher than initially reported due to an improved calibration of the absolute energy scale of HESS, and agrees well with the flux measured in 2005 by MAGIC [6]. The statistical error on the VHE photon index is still rather large (0.3), primarily due to the extreme softness of the observed spectrum (). The total HESS exposure on PG 1553+113 is 25 hours. Barring a flaring episode, not yet seen in two years of observations, a considerably larger total exposure (100 hours) would be required to significantly improve the spectral measurement. However, the VHE flux from other AGN is known to vary dramatically and even a factor of a few would reduce the observation requirement considerably. Should such a VHE flare occur, not only will the error on the measured VHE spectrum be smaller, but the measured photon index may also be harder (see, e.g., [1]). Both effects would dramatically improve the redshift constraints and correspondingly the accuracy of the source modeling. Therefore, the VHE flux from PG 1553113 will continue to be monitored by HESS. In addition, the soft VHE spectrum makes it an ideal target for the lower-threshold HESS Phase-II [15] which should make its first observations in 2009.
6 Acknowledgements
The support of the Namibian authorities and of the University of Namibia in facilitating the construction and operation of H.E.S.S. is gratefully acknowledged, as is the support by the German Ministry for Education and Research (BMBF), the Max Planck Society, the French Ministry for Research, the CNRS-IN2P3 and the Astroparticle Interdisciplinary Programme of the CNRS, the U.K. Science and Technology Facilities Council (STFC), the IPNP of the Charles University, the Polish Ministry of Science and Higher Education, the South African Department of Science and Technology and National Research Foundation, and by the University of Namibia. We appreciate the excellent work of the technical support staff in Berlin, Durham, Hamburg, Heidelberg, Palaiseau, Paris, Saclay, and in Namibia in the construction and operation of the equipment. Based on ESO-VLT SINFONI program 276.B-5036 observations.
References
- [1] Aharonian, F., et al. (HEGRA Collaboration) 2002, A&A, 393, 89
- [2] Aharonian, F., et al. (HESS Collaboration) 2004, Astroparticle Physics, 22, 109
- [3] Aharonian, F., et al. (HESS Collaboration) 2006, A&A, 448, L19
- [4] Aharonian, F., et al. (HESS Collaboration) 2006, Nature, 440, 1018
- [5] Aharonian, F., et al. (HESS Collaboration) 2006, A&A, 457, 899
- [6] Albert, J., et al. 2007, ApJ, 654, L119
- [7] Benbow, W. 2005, Proceedings of Towards a Network of Atmospheric Cherenkov Detectors VII (Palaiseau), 163
- [8] Carangelo, N., et al. 2003, ASP Conference Series, 299, 299
- [9] Feldman, G.J. & Cousins, R.D. 1998, Phys Rev D, 57, 3873
- [10] Gould, R.J., & Schréder, G.P. 1967, Phys Rev, 155, 1408
- [11] Hauser, M.G. & Dwek, E. 2001, ARA&A, 39, 249
- [12] Madau, P. & Pozzetti, L. 2000, MNRAS, 312, L9
- [13] Primack, J.R., et al. 2001, AIP Conference Proceedings, 558, 463
- [14] Mitsuda, K., et al. 2007, PASJ, 59, 1
- [15] Punch, M. 2005, Proceedings of Towards a Network of Atmospheric Cherenkov Detectors VII (Palaiseau), 509
- [16] Sbarufatti, B., et al. 2006, Astronomical Journal, 132, 1