A Spectacular VHE Gamma-Ray Outburst from PKS 2155-304 in 2006
Abstract
Since 2002 the VHE (100 GeV) -ray flux of the high-frequency peaked BL Lac PKS 2155304 has been monitored with the High Energy Stereoscopic System (HESS). An extreme -ray outburst was detected in the early hours of July 28, 2006 (MJD 53944). The average flux above 200 GeV observed during this outburst is 7 times the flux observed from the Crab Nebula above the same threshold. Peak fluxes are measured with one-minute time scale resolution at more than twice this average value. Variability is seen up to 600 s in the Fourier power spectrum, and well-resolved bursts varying on time scales of 200 seconds are observed. There are no strong indications for spectral variability within the data. Assuming the emission region has a size comparable to the Schwarzschild radius of a black hole, Doppler factors greater than 100 are required to accommodate the observed variability time scales.
1 Introduction
In the Southern Hemisphere, PKS 2155304 (redshift ) is generally the brightest blazar at VHE energies, and is probably the best-studied at all wavelengths. The VHE flux observed [1] from PKS 2155304 is typically of the order 15% of the Crab Nebula flux above 200 GeV. The highest flux previously measured in one night is approximately four times this value and clear VHE-flux variability has been observed on daily time scales. The most rapid flux variability measured for this source is 25 min [2], occurring at X-ray energies. The fastest variation published from any blazar, at any wavelength, is an event lasting 800 s where the X-ray flux from Mkn 501 varied by 30% [16]111Xue & Cui [16] also demonstrate that a 60% X-ray flux increase in 200 s observed [8] from Mkn 501 is likely an artifact., while at VHE energies doubling time scales as fast as 15 minutes have been observed from Mkn 421 [9].
As part of the normal HESS observation program the flux from known VHE AGN is monitored regularly to search for bright flares. During the July 2006 dark period, the average VHE flux observed by HESS from PKS 2155304 was more than ten times its typical value. In particular, an extremely bright flare of PKS 2155304 was observed in the early hours of July 28, 2006 (MJD 53944). This contribution focuses solely on this particular flare, which is described in more detail in [4].
2 Results from MJD 53944
A total of three observation runs (28 min each) were taken on PKS 2155304 in the early hours of MJD 53944. These data entirely pass the standard HESS data-quality selection criteria, yielding an exposure of 1.32 h live time at a mean zenith angle of 13∘. The analysis method is described in [4]. The observed excess is 11771 events (168), corresponding to a rate of 2.5 Hz. This is the first time the detected VHE -ray rate has exceeded 1 Hz.
2.1 Flux Variability
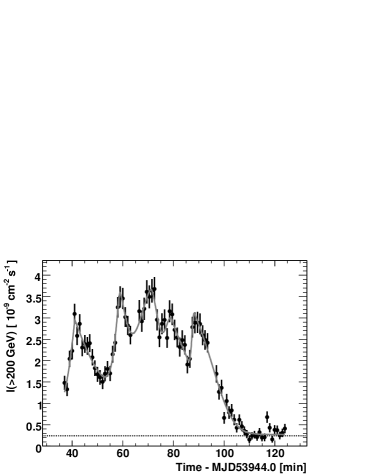
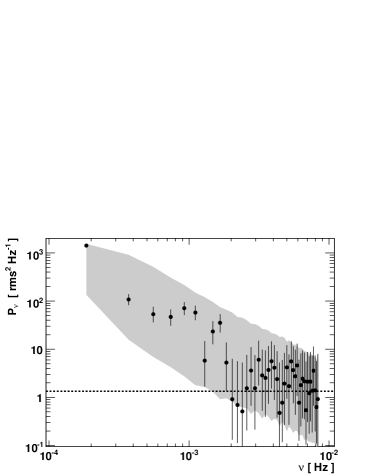
The average integral flux above 200 GeV observed from PKS 2155304 is I(200 GeV) = (1.72)10-9 cm-2 s-1, equivalent to 7 times the I(200 GeV) observed from the Crab Nebula (ICrab, [3]). Figure 1 shows I(200 GeV), binned in one-minute intervals, versus time. The fluxes in this light curve range from 0.65 ICrab to 15.1 ICrab, and their fractional root mean square (rms) variability amplitude [15] is F. This is 2 times higher than archival X-ray variability [18, 19]. The Fourier power spectrum calculated from Figure 1 is shown in Figure 2. There is power significantly above the measurement noise level up to (). The power spectrum derived from the data is compatible with a light curve generated by a stochastic process with a power-law Fourier spectrum of index -2. An index of -1 produces too much power at high frequencies and is rejected. These power spectra are remarkably similar to those derived in X-rays [18] from the same source.
Figure 1 clearly contains substructures with even shorter rise and decay time scales than found in the Fourier analysis. Therefore, the light curve is considered as consisting of a series of bursts, which is common for AGN and -ray bursts (GRBs). To characterize these bursts, the “generalized Gaussian” shape from Norris et al. [13] is used, where the burst intensity is described by: , where is the time of the burst’s maximum intensity (A); and are the rise () and decay () time constants, respectively; and is a measure of the burst’s sharpness. The rise and decay times, from half to maximum amplitude, are . Five significant bursts were found with a peak finding tool based on a Markov chain algorithm [12]. The data are well fit222All parameters are left free in the fit. by a function consisting of a superposition of an identical number of bursts plus a constant signal. The best fit has a probability of 20% and the fit parameters are shown in Table 1. Interestingly, there is a marginal trend for to increase with subsequent bursts, making them less sharp, as the flare progresses, which could imply the bursts are not stochastic. The values are close to the bulk of those found by Norris et al. [13], but the time scales measured here are two orders of magnitude larger.
| min | [s] | [s] | |
|---|---|---|---|
| 41.0 | 17328 | 610129 | 1.070.20 |
| 58.8 | 11653 | 178146 | 1.430.83 |
| 71.3 | 404219 | 269158 | 1.590.42 |
| 79.5 | 17855 | 657268 | 2.010.87 |
| 88.3 | 6744 | 62075 | 2.440.41 |
During both the first two bursts there is clear doubling of the flux within . Such doubling is sometimes used as a characteristic time scale of flux variability. For compatibility with such estimators, the definition of doubling time, , from [18] is also used333Only values of with less than 30% uncertainty are considered.. Here, , , , with and I being the time and flux, respectively, of any pair of points in the light curve. The fastest is compatible with the fastest significant time scale found by the Fourier transform. Averaging the five lowest values yields .
2.2 Spectral Analysis
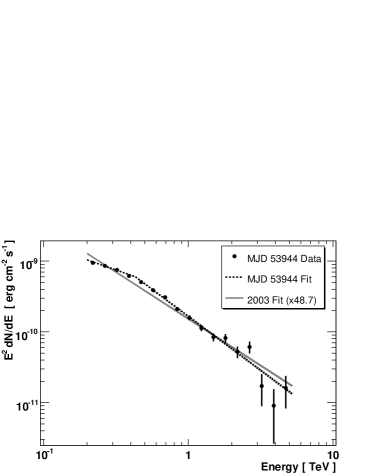
Figure 3 shows the time-averaged photon spectrum for these data. The data are well fit, for 13 degrees of freedom (d.o.f.), by a broken power-law function with = 4302280 GeV, = 2.710.060.10, and = 3.530.050.10. For each parameter, the two uncertainties are the statistical and systematic values, respectively. The time-averaged spectrum ( = 3.32) of PKS 2155304 measured in 2003 [1], multiplied by the ratio (48.7) of I(200 GeV) from the respective data sets, is also shown in Figure 3. Despite a factor of 50 change in flux there is qualitatively little difference between the two spectra which is surprising. The lack of any strong ( 0.2) temporal variability in the VHE spectrum within these data (tested on time scales of 5, 10 and 28 minutes) is also surprising.
3 Discussion
It is very likely that the electromagnetic emission in blazars is generated in jets that are beamed and Doppler-boosted toward the observer. Superluminal expansions observed with VLBI [14] provide evidence for moderate Doppler boosting in PKS 2155304. Causality implies that -ray variability on a time scale , with a Doppler factor444With defined in the standard way as , where is the bulk Lorentz factor of the plasma in the jet, , and is the angle to the line of sight. (), is related to the radius () of the emission zone by . Conservatively using the best-determined rise time (i.e. with the smallest error) from Table 1 for limits the size of the emission region to cm AU.
The jets of blazars are believed to be powered by accretion onto a supermassive black hole (SMBH). Thus accretion/ejection properties are usually presumed to scale with the Schwarzschild radius of the SMBH, where , which is the smallest, most-natural size of the system (see, e.g., [7]). Expressing the size of the -ray emitting region in terms of , the variability time scale limits its mass by . The reported host galaxy luminosity (Table 3 in [11]) would imply a SMBH mass of order 12 [6], and therefore, . Emission regions of only a few would require values of much greater than those typically derived for blazars (10) and come close to those used for GRBs, which would be a challenge to understand.
Although the choice of a 3 minute variability time scale in this article is conservative, it is still the fastest ever seen in a blazar, at any wavelength, and is almost an order of magnitude smaller than previously observed from this object. The variability is a factor of five times faster than VHE variability previously measured from Mkn 421 [9] and comparable to that reported from Mkn 501 [5]. However, in terms of the light-crossing time of the Schwarzschild radius, , the variability of PKS 2155304 is more constraining by another factor555These factors assume black hole masses of and for Mkn 421 and Mkn 501, respectively [17]. of for Mkn 421, and a factor of for Mkn 501.
The light curve presented here is strongly oversampled, allowing for the first time in the VHE regime a detailed statistical analysis of a flare, which shows remarkable similarity to other longer duration events at X-ray energies. More detailed discussion of this outburst can be found in [4], and the event continues to be investigated with other statistical techniques. As the sensitivity of VHE instruments continues to improve, it is likely that similar extreme flaring episodes will be more commonly detected in the future. Similar flares will only strengthen the conclusion that either very large Doppler factors can be present in AGN jets, or that the observed variability is not connected to the central black hole.
4 Acknowledgements
The support of the Namibian authorities and of the University of Namibia in facilitating the construction and operation of HESS is gratefully acknowledged, as is the support by the German Ministry for Education and Research (BMBF), the Max Planck Society, the French Ministry for Research, the CNRS-IN2P3 and the Astroparticle Interdisciplinary Programme of the CNRS, the U.K. Science and Technology Facilities Council (STFC), the IPNP of the Charles University, the Polish Ministry of Science and Higher Education, the South African Department of Science and Technology and National Research Foundation, and by the University of Namibia. We appreciate the excellent work of the technical support staff in Berlin, Durham, Hamburg, Heidelberg, Palaiseau, Paris, Saclay, and in Namibia in the construction and operation of the equipment.
References
- [1] Aharonian, F., et al. (HESS Collaboration) 2005, A&A, 430, 865
- [2] Aharonian, F., et al. (HESS Collaboration) 2005, A&A, 442, 895
- [3] Aharonian, F., et al. (HESS Collaboration) 2006, A&A, 457, 899
- [4] Aharonian, F., et al. (HESS Collaboration) 2007, ApJ, 664, L71
- [5] Albert, J., et al. 2007, ApJ, in press [arXiv:astro-ph/0702008]
- [6] Bettoni, D., Falomo, R., Fasano, G. & Govoni, F. 2003, A&A, 399, 869
- [7] Blandford, R.D. & Payne, D.G. 1982, MNRAS, 199, 883
- [8] Catanese, M. & Sambruna, R.M. 2000, ApJ, 534, L39
- [9] Gaidos, J.A., et al. 1996, Nature, 383, 319
- [10] Hinton, J. 2004, New Astron Rev, 48, 331
- [11] Kotilainen, J.K., Falomo, R., & Scarpa, R. 1998, A&A, 336, 479
- [12] Morhac, M., et al. 2000, Nucl. Instrum. and Methods Phys. Res. A, 443, 108
- [13] Norris, J.P., et al. 1996, ApJ, 459, 393
- [14] Piner, B.G. & Edwards, P.G. 2004, ApJ, 600, 115
- [15] Vaughan, S., Edelson, R., Warwick, R.S. & Uttley, P. 2003, MNRAS, 345, 1271
- [16] Xue, Y. & Cui, W. 2005, ApJ, 622, 160
- [17] Woo, J.-H., et al. 2005, ApJ, 631, 762
- [18] Zhang, Y.H., et al. 1999, ApJ, 527, 719
- [19] Zhang, Y.H., et al. 2005, ApJ, 629, 686