The Revealing Dust: Mid-Infrared Activity in Hickson Compact Group Galaxy Nuclei
Abstract
We present a sample of 46 galaxy nuclei from 12 nearby ( km s-1) Hickson Compact Groups (HCGs) with a complete suite of 1–24µm 2MASS+Spitzer nuclear photometry. For all objects in the sample, blue emission from stellar photospheres dominates in the near-infrared through the 3.6µm IRAC band. Twenty-five of 46 (54%) galaxy nuclei show red, mid-infrared continua characteristic of hot dust powered by ongoing star formation and/or accretion onto a central black hole. We introduce , the spectral index of a power-law fit to the 4.5–8.0µm IRAC data, and demonstrate that it cleanly separates the mid-infrared active and non-active HCG nuclei. This parameter is more powerful for identifying low to moderate-luminosity mid-infrared activity than other measures which include data at rest-frame µm that may be dominated by stellar photospheric emission. While the HCG galaxies clearly have a bimodal distribution in this parameter space, a comparison sample from the Spitzer Nearby Galaxy Survey (SINGS) matched in -band total galaxy luminosity is continuously distributed. A second diagnostic, the fraction of 24µm emission in excess of that expected from quiescent galaxies, , reveals an additional three nuclei to be active at 24µm. Comparing these two mid-infrared diagnostics of nuclear activity to optical spectroscopic identifications from the literature reveals some discrepancies, and we discuss the challenges of distinguishing the source of ionizing radiation in these and other lower luminosity systems. We find a significant correlation between the fraction of mid-infrared active galaxies and the total H I mass in a group, and investigate possible interpretations of these results in light of galaxy evolution in the highly interactive system of a compact group environment.
Subject headings:
galaxies: active — galaxies: interactions — galaxies: nuclei — galaxies: starburst — infrared: galaxies1. Introduction
The first galaxies and their environments differed substantially from those locally, often involving multiple interactions as seen in the HST Ultra Deep Field (e.g., Malhotra et al., 2005). Compared to all other nearby environments, present-day compact galaxy groups most closely reproduce the interaction environment of the early Universe () when galaxies assembled through hierarchical formation (e.g., Baron & White, 1987), and galaxy groups combined to form proto-clusters (in dense regions; e.g., Rudick et al. 2006) or massive ellipticals (in the field; White et al. 2003).
Because of their high space densities (with comparable surface densities to the centers of rich galaxy clusters; e.g., Rubin et al. 1991) and low velocity dispersions ( km s-1), compact groups of galaxies are ideal environments for studying the mechanisms of interaction-induced star formation and nuclear activity. From optical spectroscopic surveys, Hickson Compact Groups (HCGs) are known to host a population of galaxies with emission-line nuclear spectra characteristic of star-formation and/or active galactic nuclei (AGNs). Based on the optical spectroscopic survey of Coziol et al. (1998b, a), the AGN fraction in HCGs is found to be , perhaps consistent with the nuclear activity level found for nearby galaxies (with greater detection sensitivity; Ho et al. 1997b) and significantly higher than the AGN fraction identified optically in cluster galaxies (with ; Dressler et al. 1985). Further, HCG AGNs (including low-luminosity AGNs, hereafter LLAGNs; HCGs host no known Seyfert 1-luminosity AGNs) are preferentially found in optically luminous, early-type galaxies with little or no ongoing star formation in the cores of evolved groups. Similarly, many galaxies in clusters host LLAGNs in the local Universe (e.g., Martini et al., 2007), in particular brightest cluster galaxies (Best et al., 2007).
Typically, the most active star-forming galaxies are late-type spirals in the outskirts of groups. Coziol et al. (1998a) interpreted relative distributions of star-forming and AGN-hosting galaxies as indicating a clear evolutionary scenario whereby group cores are mature collapsed systems in which the high galaxy densities led to increased gravitational interactions and hence more rapid exhaustion of gas reservoirs in the past through star formation. (The radiatively weak AGNs in the evolved group cores require only a small amount of gas for fueling.) A similar study by Shimada et al. (2000) found that the fraction of emission-line HCG galaxies was comparable to the field, and conversely concluded that the HCG environment does not trigger either star formation or AGN activity.
The initial expectation that the interactions evident in the compact group environment would naturally lead to markedly enhanced levels of star formation compared with the field has not been satisfied, and a coherent understanding of the history of gas and cold dust in compact groups has proven elusive. An analysis of the CO content in HCG galaxies found them to be similar to those in the field, in loose groups, and in other environments; a notable exception is the of HCG spirals that are CO deficient. This suggests less, not more, star formation in HCGs compared to other environments (Verdes-Montenegro et al., 1998). At the same time, the detection of a few HCG elliptical and S0 galaxies in both CO and the far-infrared (unlike typical galaxies of these types) suggests that tidal interactions are influencing galaxy evolution to some extent. While the far-infrared power is similar to comparison samples, the ratios of 25 to 100µm IRAS fluxes implies a greater number of intense, nuclear starbursts in HCG galaxies (Verdes-Montenegro et al., 1998).
Clearly, a robust and consistent understanding of the impact of the compact group environment on galaxy properties has not yet emerged. One possible difficulty to date is the predominant use of optical emission-line studies to identify activity — both star-forming and accretion-dominated. Ground-based studies of bright galaxies can easily obscure low-contrast emission lines through their dilution by a strong stellar contribution (e.g., Ho et al., 1997a); intrinsic absorption can also mask spectroscopic signatures. The clear discrepancy between the AGN fraction in galaxy clusters from optical spectroscopic surveys (e.g., Dressler et al., 1985) compared to the larger fraction ( for luminous galaxies) revealed by X-ray observations (e.g., Martini et al., 2006) is illustrative of this problem. As highlighted by Martini et al. (2007), mismatched sample selection and detection techniques can create apparent (and false) discrepancies in AGN fractions between environments. In this paper, we take an alternate approach, focusing on the mid-infrared spectral energy distributions (SEDs) of individual galaxy nuclei to clearly identify the thermal, hot dust continua that signify neutral gas heated by ionizing photons from either young stars or an AGN. The clear discrepancy between a blue, quiescent galaxy SED where the mid-infrared is dominated by the Raleigh-Jeans tail of stellar photospheres and the red, mid-infrared SED of warm to hot dust emission offers promise for reducing the ambiguity of previous compact group studies.
Johnson et al. (2007, hereafter J07) have presented the first results from a Cycle 1 Spitzer IRAC (3.6–8.0µm) and MIPS (24µm) imaging survey of 46 galaxies in 12 nearby HCGs. In brief, this work revealed trends between the evolutionary states of compact groups (determined from their dynamical and H I masses), and their mid-infrared colors and luminosities. Galaxies in relatively gas-rich groups tend to have colors most indicative of star formation and AGN activity, and galaxies in gas-poor groups predominantly exhibit a narrow range of mid-infrared colors that are consistent with the light from quiescent stellar populations. The galaxies in this sample of 12 compact groups also occupy infrared color space in a distinctly different way than the population of galaxies in the Spitzer First Look Survey (FLS; e.g., Lacy et al. 2004), notably exhibiting a “gap” in their color distribution not found in the FLS sample. All of these results suggest that the environment of a compact group is intimately connected to the mid-infrared activity of the member galaxies. We present additional analysis of the nuclei of these galaxies, focusing in particular on developing diagnostics for identifying quantitative measures of mid-infrared activity with the ultimate goal of exploring the nature of mid-infrared emission, i.e., quiescent, star-forming, and/or accretion-powered. We also explore the connections between mid-infrared nuclear properties and other features of individual galaxies including morphology, optical spectral type, and the host group’s evolutionary stage. Because of their proximity ( km s-1), we can spatially extract nuclear photometry for the HCG galaxies to reduce contamination from the extended galaxy that is inevitable in surveys of more distant galaxies.
Throughout we assume a -CDM cosmology with , , and km s-1 Mpc-1 (e.g., Spergel et al., 2007).
2. Data Reduction and Analysis
2.1. Sample
Target compact galaxy groups for the Spitzer program were selected on the basis of distance, angular extent, and membership (at least three members with accordant redshifts, i.e., within 1000 km s-1 of the group mean). All HCGs were considered at redshifts km s-1, and the sample includes all of the nearest ones with only a few exceptions — three nearby groups are too extended to realistically cover with small-field imagers. The morphologies of the individual galaxies in the groups include tidal arms and tails, polar rings, ellipticals with boxy isophotes and central disks, and disturbed features; typical spiral and elliptical galaxies are also present. In Table 1, we list the groups, average recession velocities, membership by morphology, mass in neutral hydrogen (), a qualitative description of the evolutionary stage of each group based on the scenario proposed by Verdes-Montenegro et al. (2001), and the H I type from J07. Groups are divided into H I types of I (rich; ), II (intermediate; –0.9), and III (poor; ), where is the group dynamical mass (J07 and references therein).
2.2. Nuclear Photometry
The observations and image reduction are described in detail in J07, where the extended source photometry is presented. For this project, we focus on the nuclear regions in particular. The nuclear flux density is obtained using a circular aperture centered on the nucleus (with some exceptions; see below) with a 7″ radius which corresponds to 1.1–1.8 kpc for our groups. Determining the absolute background in these crowded environments is not straightforward. We elected to use a uniform method in which background is taken from an annulus with inner and outer radii of 50″ and 60″, respectively. This annulus is well outside the 3 contour levels of nearly all of the galaxies in the sample with the exception of galaxies in close projected proximity with overlapping contours. However, since the mode of the annulus is used to determine the background level in all cases, partial contamination from a nearby source will not affect the measured background values. For the purposes of comparing photometry at different wavelengths, the IRAC and MIPS images were cross-convolved with their respective point response functions (PRFs) to obtain images with matched spatial resolution. No aperture corrections have been applied. For reference, a 7″ radius aperture corresponds to of the encircled energy of the 24µm PRF.
In most cases, the nuclear aperture is centered on the location of the central flux peak of a galaxy. However, in the case of disrupted/merging/irregular galaxies, some discretion is required. For example, for the galaxies 31a, c, and e in HCG 31, the infrared peak apparently at the galaxy collision interface is designated as the nucleus of the main interacting pair.
The relative errors listed for the nuclear regions in Table 2 are conservatively set at 10%. The main source of relative uncertainty between the bands is the agreement of the relative astrometry; this translates into how well-centered the nuclear region is in each band. Empirically, this is found to be , and usually 2–3%. The formal uncertainties derived from the image statistics are negligible by comparison.
This photometry procedure is different than the method used for the entire galaxies presented in J07, which used isocontour levels. In some cases, the flux density of the entire galaxy (to roughly account for an aperture correction) is actually less than the ‘nuclear’ region, and this is because the isocontour levels used for the extended galaxy photometry fell within the 7″ radius used for the nuclear regions. However, frequently the aperture-corrected flux of the nuclear region is essentially equal to that of the galaxy; this indicates that at this angular resolution the galaxies are pointlike at 24µm. The nuclear photometry from the near-infrared through 24µm is presented in Table 2. SEDs for each galaxy nucleus are plotted in rest-frame units in Figure 1, along with the morphological type and optical spectroscopic classification (as available). Also overplotted is the total galaxy photometry and three SED templates, that of an elliptical galaxy (Silva et al., 1998), a Type 1 (i.e., broad emission-line) AGN (Richards et al., 2006), and the local starburst galaxy M82 (Silva et al., 1998). These three templates encompass the range of expected mid-infrared spectral shapes for galaxies in the local Universe. In general, the shape of the SEDs is comparable for the total galaxy and nuclear photometry.
2.3. Mid-Infrared Diagnostics
To investigate nuclear activity in HCGs further, we calculate several values from the photometry to categorize the galaxies. First, we measure the luminosities at several wavelengths chosen to characterize the contribution from different emission mechanisms. The -band luminosity, , is a measure of the luminosity in stars of a galaxy. Unlike in previous studies (e.g., Verdes-Montenegro et al., 1998) that used a blue luminosity, , ongoing star-formation does not significantly alter . The luminosity at 4.5µm, , measures the stellar continuum plus any contribution from hot ( K) dust. This bandpass has the advantage of containing no significant polycyclic aromatic hydrocarbon (PAH) features. However, the stellar contribution can still be quite significant, and so we also calculate the fraction of 4.5µm emission from hot dust: , where is the light from stars expected from the elliptical galaxy template of Silva et al. (1998) normalized to the and -band photometry. Though not all galaxies in the sample are ellipticals, we use this template to represent the stellar population, as templates from spirals and irregulars will include warm dust emission. The Silva et al. (1998) elliptical template contains a contribution from cooler dust attributed to galactic cirrus, but this component is not significant for µm. Additional fiducial luminosities are measured at 8 and 24µm. The former includes PAH emission (if present), and the latter is sensitive to cooler dust in a frequency regime near the minimum of the elliptical galaxy template. The value, , the fraction of 24µm luminosity not attributed to starlight, is calculated in the same manner as .
Finally, we also calculate the spectral index, , for a power-law model fit to the 4.5–8.0µm data, . The 3.6µm photometry is not included because of the dominant stellar contribution. In addition, an 8 to 24µm spectral index, =0.477 , can reveal cooler dust or dust emission diluted by a strong stellar continuum at shorter wavelengths. All of these values are listed in Table 3.
2.4. Comparison Galaxy Sample
In order to evaluate the role (if any) of the HCG environment on mid-infrared activity, a comparison galaxy sample is required. For this purpose, we use the Spitzer Nearby Galaxy Sample (SINGS) photometry presented in Dale et al. (2007). This is the largest sample of comparable Spitzer data available in the literature for galaxies in the local Universe with known distances. The SINGS sample was chosen to be diverse, covering a large parameter space of optical luminosities, masses, metallicities, star-formation rates, and morphologies. In an attempt to identify a reasonable comparison sample of galaxies within SINGS, we have filtered the SINGS sample to match the values of (gal)111Hereafter, to indicate integrated galaxy as opposed to nuclear properties for the HCGs, ‘(gal)’ will be appended to parameter names. (from J07 for the entire galaxy, not just the nucleus) found in our sample, –30.17 ergs s-1 Hz-1. This leaves 61 out of the total SINGS sample of 75. The majority of those filtered from the SINGS sample are low-luminosity dwarfs; the HCG sample comprises primarily 3–5 bright galaxies per group. The distributions of (gal) for the HCG and SINGS samples are plotted in Figure 2a. For all of the SINGS galaxies, we use the photometry in Tables 2 and 3 of Dale et al. (2007) and calculate the same parameters as for the HCG galaxies detailed in §2.3. The extended source photometry for the HCG galaxies includes aperture corrections to correct for scattered light in the IRAC bands following Eq. 2 of Dale et al. (2007), and therefore the two datasets are directly comparable (see J07 for further details).
3. Results and Discussion
From a visual examination of the near through mid-infrared SEDs (Fig. 1), the close correspondence of the -band through 3.6µm photometric data points with an elliptical galaxy template indicates that stellar emission dominates in this wavelength regime in every galaxy. To account for this, we normalize a 13 Gyr elliptical galaxy template (Silva et al., 1998) to the and band flux densities. With this simple normalization, the elliptical galaxy SED predicts the 3.6–8.0µm flux densities for 21 of the 46 (46%) galaxies remarkably well. These include the entire membership of the evolved and X-ray-bright HCGs 42 and 62. The remaining 25 galaxies (counting HCG 31ace as 3 galaxies), have mid-infrared continua that rise to longer wavelengths. This clear qualitative difference is illustrated quantitatively with the histogram of values shown in Figure 2b. No HCG galaxy nuclei inhabit the parameter space between values of and 0.25; for the integrated HCG galaxy SEDs, the distribution is comparable, with none found in the range of (gal) of to 0.12. This is in stark contrast to the distribution of values of the SINGS galaxies (plotted in the same figure) that shows a significant fraction within the HCG gap. We also point out a noticeable peak near for the SINGS galaxies whereas the HCG galaxies (and nuclei) are more evenly distributed from to . The larger number of HCG objects with compared to SINGs galaxies likely reflects the larger number of early types in the former sample. However, morphological differences do not account for all of the discrepancy, as a direct comparison of the spirals in the two samples finds that while 11 of 47 (23%) of the SINGs spirals have values in the range from –1.3 to 0, none of the 17 HCG spirals do. A Kolmogorov-Smirnov analysis confirms the overall differences in the populations, giving only 0.12% and 0.35% probabilities that the SINGs galaxies are drawn from the same distribution as the HCG nuclei and galaxies, respectively. (The HCG nuclei and galaxies are consistent with eachother at 22.5% probability.) Hereafter, we will utilize the break in the HCG distribution to distinguish “mid-infrared active” () from “mid-infrared quiescent” () nuclei and galaxies.
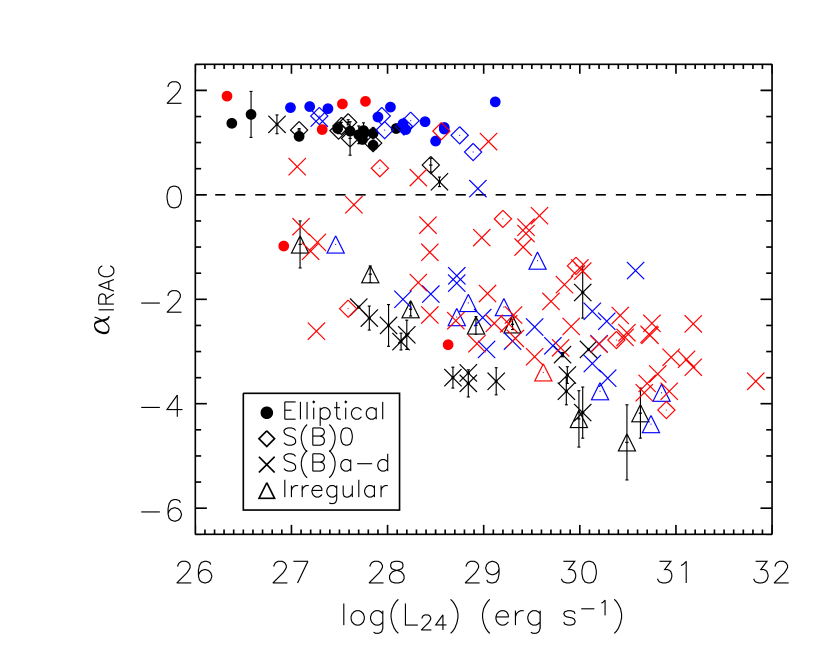
We investigate this difference in more detail by plotting vs. for both the HCG and SINGS galaxies, coded by galaxy morphology in Figure 3. It is perhaps most illuminating to compare the SINGS and HCG spiral galaxies ( symbols in Fig. 3). While the two groups cover a comparable range of , the HCG galaxies are systematically redder in the mid-infrared, i.e., with more negative values of . Within the HCG galaxies, morphology is evidently a strong predictor of , with elliptical and S0 galaxies almost exclusively populating the parameter space of .
We next consider the utility of measuring , the fraction of attributable to non-stellar (i.e., hot dust) emission. A plot of vs. shows a clear positive correlation in the HCG population, with higher values of corresponding to larger values of , as shown in Figure 4a. This correlation is highly significant according to the non-parametric Spearman’s test which gives a probability, , of for that these parameters are uncorrelated. While the HCG nuclei known to have optical absorption-line spectra (filled circles) all have values of consistent with purely stellar emission and ergs s-1 Hz-1, there is no clear separation in this parameter space between galaxies identified as AGNs or star-forming. This is perhaps surprising, as one might expect AGNs to have larger values of than star-forming galaxies because of the typically hotter temperatures of dust emission associated with harder ionizing continua. This is true even for Seyfert 2 galaxies that are typically assumed to have intrinsic absorption that blocks the direct line of sight to the accretion disk (e.g., Buchanan et al., 2006). One source of hot dust emission in star-forming galaxies that may contribute significantly at µm is from dust shells around AGB stars, (e.g., Piovan et al., 2003).
The five known low-ionization nuclear emission region (LINER) galaxies (open squares), which can be powered by either star-formation or accretion (e.g., Eracleous et al., 2002), also do not lie in a distinct region within this parameter space. The recent mid-infrared spectroscopic survey of Sturm et al. (2006) found two distinct LINER populations separable by infrared luminosity; the two populations can be divided at (where is integrated from 8–1000µm). In brief, infrared emission lines, continuum shape, and PAH features indicate that infrared-luminous LINERs are more closely linked to starburst galaxies, while infrared-faint LINERs were identified primarily with AGNs. However, the presence of high ionization lines such as [O IV] seems to indicate that as many as 90% of all LINERs in their sample contain AGNs, though accretion power is not energetically dominant in the majority of cases. The two LINERs in our sample with no evidence for mid-infrared activity, 42a and 62a, are known X-ray sources, and therefore likely do host AGNs. Their low mid-infrared luminosities and weak emission-line signatures in the optical indicate that the AGNs are not particularly powerful. Given that their values of of 4.0 and 6.6 are also the two lowest in the sample, they might be identified with the infrared-faint LINERs of Sturm et al. (2006). The other three (16a, 16d, and 90d) may therefore be star-formation powered, though this remains ambiguous without mid-infrared spectra.
Focusing on longer wavelengths, three galaxies show evidence for dust emission at 24µm that is not evident when only considering the IRAC data. In particular, a plot of vs. reveals a clear separation between galaxies at , see Figure 4b. With only one exception (62d), all known HCG absorption-line galaxies have and . None of the identified star-forming galaxies is in that region, while two LINERs (42a and 62a) and one optical AGN (22a) are. While all of the galaxies identified as mid-infrared-active from their values of have and , an additional three galaxies, the Seyfert 2s 16b and 61a and the absorption-line galaxy 62d, appear as 24µm-excess sources. An examination of their mid-infrared SEDs (Fig. 1) indicates that these galaxies likely include a strong contribution from stellar photospheric emission throughout most of the IRAC bands, and only at 24µm, near a minimum of the elliptical template SED, is there sufficient contrast to see the low-luminosity dust continuum. Hereafter, we designate all sources with and as “24µm-active”.
Combining diagnostics of mid-infrared and 24µm activity, vs. is shown in Figure 5, coded by both H I richness (as listed in column 9 of Table 1) and galaxy morphology. In this plot, it is clear again that all nuclei designated as mid-infrared-active are also 24µm-active, though the converse is not true for three objects. The dashed line represents =, and the elliptical galaxy nuclei (with the exception of 62d) are all tightly clustered near this line. These objects are also typically in H I-poor groups. Nuclei from each of the most H I-rich (Type I) groups, 2, 16, 31, and 61, have the most negative (reddest) values. This implies a connection between the availability of H I and 24µm activity from both AGNs and star formation. However, not all nuclei within an H I-rich group are 24µm-active, though the fraction is quite high ranging from 67 to 100% for the four H I-rich groups (see Table 1). Evaluating the relationship between the fraction of 24µm-active () nuclei and group H I mass as shown in Figure 6a, the non-parametric Spearman’s test gives a probability, , of only for that these parameters are uncorrelated. Considering only mid-infrared-active galaxies, the correlation is less significant (; ), though still present.
Thirty-one of the 46 HCG galaxies have masses (including 14 upper limits) calculated from CO surveys (Verdes-Montenegro et al., 1998). (Of these, 90bd and 31ace were unresolved in the radio images.) In a plot of vs. , the most mid-infrared luminous nuclei have large amounts of , however, there is quite a large scatter as shown in Figure 6b. In fact, not all mid-infrared luminous galaxies have large reservoirs. However, more complete and deeper molecular gas surveys are needed to explore this relationship in further detail.
3.1. Comparing Mid-Infrared Diagnostics for Integrated Galaxy vs. Nuclear Light
Given the proximity of our targets, the Spitzer angular resolution offers a handle on investigating the difference between nuclear and integrated galaxy parameters for identifying potential nuclear activity. This is particularly relevant for survey work, where more distant objects are typically unresolved with Spitzer. Using the criterion that values of indicate mid-infrared activity, the galaxy and nuclear data for the HCG sample are completely consistent (see Figure 2b). At longer wavelengths, however, there are some discrepancies. In particular, as the discriminant for a 24µm excess yields some differences depending on whether the integrated galaxy light or nuclear light is considered. Though all galaxies with also have , four additional galaxies — 7b, 42a, 42b, and 90b — have 24µm excesses in their integrated galaxy light. This is also evident from visual inspection of their SEDs as plotted in Figure 1. The values of of the integrated galaxy vs. nuclear light are shown in Figure 7. The four discrepant galaxies are all early type (SB0, E3, SB0, and E0, respectively); the 24µm excess is thus evidence of low-level star formation occurring outside of the nuclei in these galaxies. If such objects were at a much greater distance such as typical of large area surveys, the corresponding lack of spatial resolution could therefore lead to inaccuracies in the nuclear classification based on mid-infrared data alone. No activity would be missed, but some objects would be classified as 24-µm active (and therefore potentially hosting LLAGNs) where extranuclear star formation is in fact responsible.
4. Summary and Conclusions
Of the complete set of 46 HCG galaxies presented in the Spitzer imaging survey of J07, we have identified 25 with red () mid-infrared continua. All eight known, spectroscopically identified star-forming galaxies (7a, 16c, 19c, 22c, 31ace, and 31b) are within this group. An additional three galaxies (16b, 61a, and 62b — all optically identified AGNs) are apparently quiescent in the IRAC bands but show evidence for a 24µm-excess above a stellar continuum, bringing the total number of 24µm-active HCG galaxies to 61% (as all of the mid-infrared active galaxies are also 24µm-active). This is higher than the fraction of emission-line galaxies (including AGNs and star-forming galaxies) identified in optical spectroscopic surveys of HCGs (Coziol et al., 1998b, a; Shimada et al., 2000), and highlights the utility of multiwavelength studies to capture all activity.
Though the mid-infrared analysis presented here has the advantage of being unambiguous in terms of identifying mid-infrared activity – the distribution of HCG nuclei is clearly bimodal in terms of both and – distinguishing between accretion and star formation as the dominant source of mid-infrared power remains challenging. The evident trend in Figure 3 between and seen in mid-infrared active galaxy nuclei could be interpreted as an increasing contribution from star formation at higher and redder (more negative) values of . Establishing this would be extremely powerful for interpreting photometric data of fainter objects in wide field surveys. However, the significant correlation between and , which might similarly be read to imply a stronger AGN component (because of the greater hot dust contribution at 4.5µm) at larger values of , is not generally consistent with the known nuclear identifications from optical spectroscopy. This implies that simple measures of the steepness of the mid-infrared continuum are not diagnostic – underscoring the difficulty of using mid-infrared photometry alone to categorize objects. Even with high signal-to-noise mid-infrared spectroscopy, the underlying source of mid-infrared power can remain ambiguous in some objects (e.g., Weedman et al., 2005). Furthermore, the strong stellar contamination at 3.6µm in all of these galaxies means that color-color diagnostics that use the ratio of 3.6 to 4.5µm fluxes to isolate AGNs (e.g., Stern et al., 2005) likely miss a large fraction of them, particularly at lower infrared luminosities. Selection criteria with a wider dynamic range in color will be less sensitive to this effect (e.g., Lacy et al., 2004). However, as noted by J07, none of our sample would fulfill the AGN mid-infrared color-color selection criteria of Stern et al. (2005) or Lacy et al. (2004), which were designed to target objects where the AGN dominates the mid-infrared SED. Our entire sample would also fail the power-law AGN selection criterion of Donley et al. (2007) that required a monotonic flux increase from 3.6 to 8.0µm.
A few optically identified LLAGNs – 22a, 42a, and 62a – show no evidence for any excess mid-infrared (including 24µm) emission, indicating that warm to hot dust emission does not always accompany accretion onto a black hole. However, without a reservoir of cold material, an optically detectable AGN may be short-lived. In any case, such a system is unlikely to contribute significantly to the luminous energy budget of its host galaxy. Given their weak emission lines (which would be strongly diluted by host galaxy light at larger distances; Moran et al. 2002), these three galaxies may be identified with the optically dull but X-ray detected AGNs found in clusters (Martini et al., 2006). The evolved nature of their host groups and the X-ray detections of 42a and 62a in particular are consistent with identifying these systems as mini-clusters. In contrast, the less evolved compact groups may be less likely to host X-ray bright, optically quiet galaxies, as found in the loose group survey of Shen et al. (2007). At present, the lack of a complete suite of optical spectroscopy and high quality X-ray observations of our galaxy sample complicates definitively fitting the compact groups in context with the AGN surveys in the loose group and cluster environments done to date.
The striking difference between the distribution of values for the HCG and SINGS galaxies supports the role of environment in affecting HCG galaxies — a conclusion consistent with the marked difference in the mid-infrared color-color distribution of HCG and FLS galaxies noted by J07. In particular, the strongly bimodal nature of HCG nuclear (and galaxy) values as well as the correlation between group H I content and 24µm activity suggests that star formation in a compact group galaxy, likely induced by interactions, occurs in a burst that then exhausts its reservoir of cold gas, as suggested previously from far-infrared (Verdes-Montenegro et al., 1998) and optical spectroscopic (Coziol et al., 1998a) studies. The end result is a group dominated by mid-infrared quiescent galaxies. If local compact galaxy groups are analogous to the building blocks of clusters in the early Universe, this implies that the exhaustion of cold gas through enhanced star-formation occurs as a result of interactions (though not necessarily mergers) prior to cluster infall. Any AGN activity in those galaxies at that point would proceed in a low-luminosity, X-ray bright mode (Shen et al., 2007). However, Tully-Fisher (Mendes de Oliveira et al., 2003) and fundamental plane studies (de la Rosa et al., 2001) of HCG galaxies reveal that they are consistent with control galaxy populations. Therefore, there is no strong evidence for a significant effect of the compact group environment on the current states of galaxy morphology in such a significant way that would alter the end states of galaxy evolution.
From a stellar population study of HCG ellipticals, de la Rosa et al. (2007) concluded that these galaxies showed evidence for truncated star formation in comparison to a (very small) sample of field ellipticals. While this may be the case, the mechanism for star formation truncation is unlikely to be extensive feedback from AGN activity. None of the optically known AGNs in any HCG has sufficient luminosity to clear a galaxy of its interstellar medium. The sole possible exception to this observation is 62a, where X-ray cavities in the intragroup medium suggest that a relativistic jet has ejected a sigificant amount of kinetic energy from a radiatively quiet AGN (e.g., Morita et al., 2006; Gu et al., 2007). However, this ongoing process likely postdates the epoch of star formation in this evolved group.
References
- Baron & White (1987) Baron, E. & White, S. D. M. 1987, ApJ, 322, 585
- Best et al. (2007) Best, P. N., von der Linden, A., Kauffmann, G., Heckman, T. M., & Kaiser, C. R. 2007, MNRAS, 379, 894
- Buchanan et al. (2006) Buchanan, C. L., Gallimore, J. F., O’Dea, C. P., Baum, S. A., Axon, D. J., Robinson, A., Elitzur, M., & Elvis, M. 2006, AJ, 132, 401
- Condon et al. (1998) Condon, J. J., Cotton, W. D., Greisen, E. W., Yin, Q. F., Perley, R. A., Taylor, G. B., & Broderick, J. J. 1998, AJ, 115, 1693
- Coziol et al. (1998a) Coziol, R., de Carvalho, R. R., Capelato, H. V., & Ribeiro, A. L. B. 1998a, ApJ, 506, 545
- Coziol et al. (1998b) Coziol, R., Ribeiro, A. L. B., de Carvalho, R. R., & Capelato, H. V. 1998b, ApJ, 493, 563
- Dale et al. (2007) Dale, D. A., et al. 2007, ApJ, 655, 863
- de Carvalho et al. (1997) de Carvalho, R. R., Ribeiro, A. L. B., Capelato, H. V., & Zepf, S. E. 1997, ApJS, 110, 1
- de la Rosa et al. (2007) de la Rosa, I. G., de Carvalho, R. R., Vazdekis, A., & Barbuy, B. 2007, AJ, 133, 330
- de la Rosa et al. (2001) de la Rosa, I. G., de Carvalho, R. R., & Zepf, S. E. 2001, AJ, 122, 93
- Donley et al. (2007) Donley, J. L., Rieke, G. H., Perez-Gonzalez, P. G., Rigby, J. R., & Alonso-Herrero, A. 2007, ApJ, 660, 167
- Dressler et al. (1985) Dressler, A., Thompson, I. B., & Shectman, S. A. 1985, ApJ, 288, 481
- Eracleous et al. (2002) Eracleous, M., Shields, J. C., Chartas, G., & Moran, E. C. 2002, ApJ, 565, 108
- Gu et al. (2007) Gu, J., Xu, H., Gu, L., An, T., Wang, Y., Zhang, Z., & Wu, X.-P. 2007, ApJ, 659, 275
- Hickson et al. (1989) Hickson, P., Kindl, E., & Auman, J. R. 1989, ApJS, 70, 687
- Ho et al. (1997a) Ho, L. C., Filippenko, A. V., & Sargent, W. L. W. 1997a, ApJS, 112, 315
- Ho et al. (1997b) — 1997b, ApJ, 487, 568
- Johnson et al. (2007) Johnson, K. E., Hibbard, J. E., Gallagher, S. C., Hornschemeier, A. E., & Charlton, J. C. 2007, AJ, 134, 1522
- Lacy et al. (2004) Lacy, M., et al. 2004, ApJS, 154, 166
- Malhotra et al. (2005) Malhotra, S., et al. 2005, ApJ, 626, 666
- Martini et al. (2006) Martini, P., Kelson, D. D., Kim, E., Mulchaey, J. S., & Athey, A. A. 2006, ApJ, 644, 116
- Martini et al. (2007) Martini, P., Mulchaey, J. S., & Kelson, D. D. 2007, ApJ, 664, 761
- Mendes de Oliveira et al. (2003) Mendes de Oliveira, C., Amram, P., Plana, H., & Balkowski, C. 2003, AJ, 126, 2635
- Moran et al. (2002) Moran, E. C., Filippenko, A. V., & Chornock, R. 2002, ApJ, 579, L71
- Morita et al. (2006) Morita, U., Ishisaki, Y., Yamasaki, N. Y., Ota, N., Kawano, N., Fukazawa, Y., & Ohashi, T. 2006, PASJ, 58, 719
- Piovan et al. (2003) Piovan, L., Tantalo, R., & Chiosi, C. 2003, A&A, 408, 559
- Richards et al. (2006) Richards, G. T., et al. 2006, ApJS, 166, 470
- Rubin et al. (1991) Rubin, V. C., Hunter, D. A., & Ford, W. K. J. 1991, ApJS, 76, 153
- Rudick et al. (2006) Rudick, C. S., Mihos, J. C., & McBride, C. 2006, ApJ, 648, 936
- Shen et al. (2007) Shen, Y., Mulchaey, J. S., Raychaudhury, S., Rasmussen, J., & Ponman, T. J. 2007, ApJ, 654, L115
- Shen et al. (2007) Shen, Y., Mulchaey, J. S., Raychaudhury, S., Rasmussen, J., & Ponman, T. J. 2007, ApJ, 654, L115
- Shimada et al. (2000) Shimada, M., Ohyama, Y., Nishiura, S., Murayama, T., & Taniguchi, Y. 2000, AJ, 119, 2664
- Silva et al. (1998) Silva, L., Granato, G. L., Bressan, A., & Danese, L. 1998, ApJ, 509, 103
- Spergel et al. (2007) Spergel, D. N., et al. 2007, ApJS, 170, 377
- Stern et al. (2005) Stern, D., et al. 2005, ApJ, 631, 163
- Sturm et al. (2006) Sturm, E., et al. 2006, ApJ, 653, L13
- Verdes-Montenegro et al. (1998) Verdes-Montenegro, L., Yun, M. S., Perea, J., del Olmo, A., & Ho, P. T. P. 1998, ApJ, 497, 89
- Verdes-Montenegro et al. (2001) Verdes-Montenegro, L., Yun, M. S., Williams, B. A., Huchtmeier, W. K., Del Olmo, A., & Perea, J. 2001, A&A, 377, 812
- Weedman et al. (2005) Weedman, D. W., et al. 2005, ApJ, 633, 706
- White et al. (2003) White, P. M., Bothun, G., Guerrero, M. A., West, M. J., & Barkhouse, W. A. 2003, ApJ, 585, 739
- White et al. (1997) White, R. L., Becker, R. H., Helfand, D. J., & Gregg, M. D. 1997, ApJ, 475, 479
| HCG | aaAverage recession velocity for all of the accordant compact group galaxies. | Gal. MorphbbTaken from Hickson et al. (1989); more detailed morphologies are listed in Table 3. | ccMass ( in ) of neutral hydrogen (Verdes-Montenegro et al., 2001). | Evol. | H I | ||||
|---|---|---|---|---|---|---|---|---|---|
| Name | ( km s-1) | E | S(B)0 | S(B)a–d | Irr | () | StageddA qualitative determination of evolutionary stage based on group galaxy morphologies and X-ray detection of an intragroup medium based on Verdes-Montenegro et al. (2001). | TypeeeH I type as measured and defined by Johnson et al. (2007). Key: (I) = H I rich (); (II) = intermediate (–0.9); (III) H I poor (). | ffFraction of “mid-infared active” () nuclei in each group. Numbers in parentheses refer to “24µm-active” nuclei with and . |
| 2 | 4309 | 0 | 0 | 2 | 1 | 10.53 | early | I | 3/3 |
| 7 | 4233 | 0 | 1 | 3 | 0 | 9.68 | early | II | 3/4 |
| 16 | 3957 | 0 | 0 | 2 | 2 | 10.42 | int | I | 3(1)/4 |
| 19 | 4245 | 1 | 0 | 2 | 0 | 9.31 | early/int | II | 2/3 |
| 22 | 2686 | 1 | 0 | 2 | 0 | 9.13 | early | II | 1/3 |
| 31 | 4094 | 0 | 0 | 4 | 2 | 10.35 | int | I | 6/6 |
| 42 | 3976 | 3 | 1 | 0 | 0 | 9.40 | late | III | 0/4 |
| 48ggBased on the velocities of its four galaxies (2267, 2437, 4381, 4361 km s-1), HCG 48 may be more appropriately characterized as two pairs rather than a proper compact group. | 3162 | 2 | 1 | 1 | 0 | 8.52 | late | III | 1/4 |
| 59 | 4058 | 1 | 0 | 1 | 1 | 9.49 | early/int | II | 3/4 |
| 61 | 3907 | 0 | 2 | 1 | 0 | 9.96 | early/int | I | 1(1)/3 |
| 62 | 4122 | 2 | 2 | 0 | 0 | 9.06 | late | III | 0(1)/4 |
| 90 | 2644 | 2 | 0 | 1 | 1 | 8.60 | int | III | 2/4 |
| HCG | 2MASS | IRAC | MIPS | |||||
|---|---|---|---|---|---|---|---|---|
| Name | 3.6 | 4.5 | 5.7 | 8.0 | 24 | |||
| 2a | ||||||||
| 2b | ||||||||
| 2c | ||||||||
| 7a | ||||||||
| 7b | ||||||||
| 7c | ||||||||
| 7d | ||||||||
| 16a | ||||||||
| 16b | ||||||||
| 16c | ||||||||
| 16d | ||||||||
| 19a | ||||||||
| 19b | ||||||||
| 19c | ||||||||
| 22a | ||||||||
| 22b | ||||||||
| 22c | ||||||||
| 31ace | ||||||||
| 31b | ||||||||
| 31g | ||||||||
| 31q | ||||||||
| 42a | ||||||||
| 42b | ||||||||
| 42c | ||||||||
| 42d | ||||||||
| 48a | ||||||||
| 48b | ||||||||
| 48c | ||||||||
| 48d | ||||||||
| 59a | ||||||||
| 59b | ||||||||
| 59c | ||||||||
| 59d | ||||||||
| 61a | ||||||||
| 61c | ||||||||
| 61d | ||||||||
| 62a | ||||||||
| 62b | ||||||||
| 62c | ||||||||
| 62d | ||||||||
| 90a | ||||||||
| 90b | ||||||||
| 90c | ||||||||
| 90d | ||||||||
| HCG | Gal. | Nuc. | ccValues of are from Table 1 of the CO survey of Verdes-Montenegro et al. (1998). | ( ergs s-1 Hz-1) | ||||||||
|---|---|---|---|---|---|---|---|---|---|---|---|---|
| Name | Morph.aaGalaxy morphologies are taken from the 2-color imaging survey of Hickson et al. (1989). | Class.bbPublished diagnostics of nuclear type, primarily from optical spectroscopy. Key: ABS = absorption-line galaxies; AGN = active galactic nucleus; (d)Sy2 = (dwarf) Seyfert 2; X = X-ray source; R = radio source; (d)LNR = (dwarf) low-ionization nuclear emission region; SBNG = starburst nucleated galaxy; HII = strong H II emitter; ELG = emission-line galaxy; ? = unknown classification. | ( M⊙) | ddThe spectral slope determined from a power-law model fit to the 4.5, 5.7, and 8µm monochromatic luminosities (). | eeThe spectral slope measured between the 8 and 24µm monochromatic luminosities. | ffThe logarithm of the monochromatic luminosities ( ergs s-1 Hz-1) at rest-frame 1.2 (), 4.5, 8, and 24µm. | 4.5ffThe logarithm of the monochromatic luminosities ( ergs s-1 Hz-1) at rest-frame 1.2 (), 4.5, 8, and 24µm. | 8ffThe logarithm of the monochromatic luminosities ( ergs s-1 Hz-1) at rest-frame 1.2 (), 4.5, 8, and 24µm. | 24ffThe logarithm of the monochromatic luminosities ( ergs s-1 Hz-1) at rest-frame 1.2 (), 4.5, 8, and 24µm. | ggFraction of 4.5 and 24µm emission from dust calculated by subtracting the observed flux from that expected from an elliptical galaxy template normalized to the and -band emission. | ggFraction of 4.5 and 24µm emission from dust calculated by subtracting the observed flux from that expected from an elliptical galaxy template normalized to the and -band emission. | ReferenceshhReferences for the nuclear classifications. Key: (1) National Radio Astronomical Observatory Very Large Array Sky Survey (NVSS; Condon et al., 1998); (2) optical spectroscopy (Shimada et al., 2000); (3) optical spectroscopy (Coziol et al., 1998b); (4) optical spectroscopy (de Carvalho et al., 1997); (5) Faint Images of the Radio Sky at 20 cm (FIRST; White et al., 1997); (6) NASA/IPAC Extragalactic Database (NED; nedwww.ipac.caltech.edu). |
| 2a | SBd | R | 28.33 | 28.03 | 28.88 | 29.13 | 1.00 | 1 | ||||
| 2b | cI | R | 28.64 | 28.43 | 29.46 | 29.99 | 1.00 | 1 | ||||
| 2c | SBc | ? | 28.01 | 27.53 | 28.19 | 28.14 | 0.98 | |||||
| 7a | Sb | HII | 29.14 | 28.79 | 29.52 | 29.82 | 0.99 | 2 | ||||
| 7b | SB0 | ? | 28.99 | 28.44 | 28.09 | 27.59 | 0.34 | |||||
| 7c | SBc | ? | 28.31 | 27.92 | 28.73 | 28.84 | 0.99 | |||||
| 7d | SBc | ? | 28.11 | 27.61 | 28.25 | 28.20 | 0.98 | |||||
| 16a | SBab | LNR,X,R | 29.23 | 28.90 | 29.72 | 29.87 | 0.99 | 1, 3, 6 | ||||
| 16b | Sab | Sy2 | 29.11 | 28.57 | 28.52 | 28.54 | 0.90 | 3 | ||||
| 16c | Im | SBNG | 29.04 | 28.98 | 30.12 | 30.49 | 1.00 | 3 | ||||
| 16d | Im | LNR | 28.97 | 28.94 | 29.96 | 30.63 | 1.00 | 3 | ||||
| 19a | E2 | ABS | 28.94 | 28.36 | 28.05 | 27.48 | 0.25 | 3 | ||||
| 19b | Scd | ? | 28.21 | 27.85 | 28.68 | 28.68 | 0.99 | 4 | ||||
| 19c | Sdm | ELG | 27.66 | 27.26 | 27.86 | 28.01 | 0.99 | |||||
| 22a | E2 | dSy2 | 29.01 | 28.47 | 28.21 | 27.74 | 0.50 | 3 | ||||
| 22b | Sa | ABS | 28.05 | 27.52 | 27.19 | 26.85 | 0.57 | 4 | ||||
| 22c | SBcd | ELG | 27.76 | 27.21 | 27.72 | 27.70 | 0.97 | 4 | ||||
| 31ace | Sdm | HII | 28.25 | 28.14 | 29.16 | 30.03 | 1.00 | 2 | ||||
| 31b | Sm | HII | 27.85 | 27.33 | 27.86 | 28.24 | 0.99 | 2 | ||||
| 31g | Im | ? | 28.21 | 27.71 | 28.32 | 28.92 | 1.00 | |||||
| 31q | Im | ? | 27.57 | 27.09 | 27.31 | 27.09 | 0.92 | |||||
| 42a | E3 | dLNR,X | 29.39 | 28.86 | 28.55 | 28.09 | 0.46 | 3, 6 | ||||
| 42b | SB0 | ABS | 28.81 | 28.24 | 27.94 | 27.49 | 0.45 | 4 | ||||
| 42c | E2 | ABS | 28.96 | 28.40 | 28.11 | 27.76 | 0.58 | 4 | ||||
| 42d | E2 | ABS | 28.29 | 27.73 | 27.35 | 26.58 | 0.05 | 4 | ||||
| 48a | E2 | ABS | 29.09 | 28.54 | 28.24 | 27.75 | 0.41 | 4 | ||||
| 48b | Sc | X | 28.39 | 27.97 | 28.83 | 28.84 | 0.99 | |||||
| 48c | S0a | ? | 28.38 | 27.83 | 27.53 | 27.08 | 0.47 | |||||
| 48d | E1 | ? | 28.06 | 27.50 | 27.15 | 26.38 | 0.05 | |||||
| 59a | Sa | ? | 28.63 | 28.37 | 29.10 | 30.09 | 1.00 | |||||
| 59b | E0 | ? | 28.35 | 27.78 | 27.50 | 27.08 | 0.51 | |||||
| 59c | Sc | ? | 27.87 | 27.33 | 27.88 | 27.81 | 0.97 | |||||
| 59d | Im | ? | 27.46 | 27.09 | 27.46 | 27.82 | 0.99 | |||||
| 61a | S0a | Sy2,R | 29.22 | 28.72 | 28.58 | 28.45 | 0.84 | 2, 5 | ||||
| 61c | Sbc | AGN,R | 28.92 | 28.81 | 29.71 | 29.86 | 1.00 | 2, 5 | ||||
| 61d | S0 | ABS | 28.82 | 28.28 | 28.01 | 27.61 | 0.55 | 2, 6 | ||||
| 62a | E3 | dLNR,X | 29.19 | 28.62 | 28.33 | 27.85 | 0.42 | 2, 3 | ||||
| 62b | S0 | ABS,X | 29.07 | 28.49 | 28.24 | 27.85 | 0.56 | 2, 4 | ||||
| 62c | S0 | ABS | 28.81 | 28.21 | 27.89 | 27.52 | 0.49 | 2, 4 | ||||
| 62d | E2 | ABS | 28.42 | 27.85 | 27.58 | 27.70 | 0.87 | 4 | ||||
| 90a | Sa | Sy2,X,R | 28.87 | 29.02 | 29.48 | 30.03 | 1.00 | 3 | ||||
| 90biiBecause the 24µm photometry is not availabel, the values of and for 90a have been determined by extrapolating from the IRAC photometry. | E0 | ABS,X | 29.08 | 28.53 | 28.29 | 27.85 | 0.55 | 4 | ||||
| 90c | E0 | ABS | 28.97 | 28.41 | 28.11 | 27.61 | 0.39 | 4 | ||||
| 90diiBecause the 24µm photometry is not availabel, the values of and for 90a have been determined by extrapolating from the IRAC photometry. | Im | LNR,R | 28.80 | 28.42 | 29.02 | 29.30 | 0.99 | 3 | ||||

![[Uncaptioned image]](/html/0710.0372/assets/x2.png)
Fig. 1. — Continued.
![[Uncaptioned image]](/html/0710.0372/assets/x3.png)
Fig. 1. — Continued.
![[Uncaptioned image]](/html/0710.0372/assets/x4.png)
Fig. 1. — Continued.
![[Uncaptioned image]](/html/0710.0372/assets/x5.png)
Fig. 1. — Continued.
![[Uncaptioned image]](/html/0710.0372/assets/x6.png)
Fig. 1. — Continued.
![[Uncaptioned image]](/html/0710.0372/assets/x7.png)
Fig. 1. — Continued.