COSMIC GAMMA-RAY BURST 060428C DETECTED IN THE FIELDS OF VIEW OF THE IBIS AND SPI TELESCOPES OF THE INTEGRAL OBSERVATORY AND ITS EARLY AFTERGLOW
to be published in Astronomy Letters, v. 33, n. 12, in press (2007)
translated from Pis’ma v Astron. Zhurn., v. 33, n. 12, p. 883 (2007)
Space Research Institute, Russian Academy of
Sciences
Profsoyuznaya 84/32, Moscow 117997, Russia
Submitted on July 10, 2007
Analyzing archival data of the INTEGRAL observatory we discovered and localized a cosmic -ray burst detected within fields of view of the IBIS/ISGRI and SPI telescopes on April 28, 2006. The burst has not been revealed by the INTEGRAL Burst Alert System (IBAS), so the information on its coordinates has not been distributed in time and search for the afterglow has not been carried out. The burst has been also detected by the KONUS/WIND and RHESSI spacecrafts. Its fluence was erg cm-2 in the 20–200 keV energy band, the maximum flux was erg cm-2 s-1 ( phot cm-2 s-1). The burst had a complicated multi-peak profile and was outstanding of the typical bursts by increasing its spectral hardness with time. The emission spectrum near the flux maximum was characterized by the photon index and the peak energy keV. The burst lasted s, then we observed its afterglow at energies 15–45 keV decaying according to a power law with the index . The spectral hardness decreased substantially during the afterglow.
Key words: gamma-ray sources, cosmic -ray bursts
PACS codes: 95.85.Nv, 95.85.Pw, 98.70.Rz
∗ e-mail address sergei@hea.iki.rssi.ru
INTRODUCTION
There were about 50 cosmic -ray bursts detected within fields of view of main telescopes of the INTEGRAL observatory during its 5 years of in-orbit operation. Most of them were discovered and then (within 30–200 s) localized with the IBAS automatic system (Mereghetti et al. 2003) enabling quick reorientation of X-ray, optical and radio telescopes around the world towards sources of the bursts and, in many cases, detection of their afterglow (see table of the detected bursts at http://ibas.iasf-milano.inaf.it).
In this paper we report the discovery in the INTEGRAL archival data of a -ray burst which was not revealed by the IBAS system. The burst was detected on April 28, 2006 at 02h30m35s UT with the IBIS gamma-ray telescope (the ISGRI detector) and SPI gamma-ray spectrometer. We assigned the name GRB 060428C for this burst taking into account that two more bursts were detected later during the same day by the SWIFT orbital observatory (Mangano et al. 2006; Campana et al. 2006), referred in GCN telegrams as GRB 060428A and GRB 060428B.
Apart the INTEGRAL observatory, GRB 060428C was also detected by the RHESSI (http://grb.web.psi.ch/grb list 2006.html) and WIND (its KONUS detector, see event 2730 at http://gcn.gsfc.nasa.gov/konus grbs.html) spacecrafts, with the trigger occurred only at the final stage of the burst in the latter case. These spacecrafts were unable to localize a source of the burst, therefore information on these detections has not been distributed and search for the afterglow has not been carried out.
The results of temporal and spectral analyses of the INTEGRAL data obtained during the observations of GRB 060428C are presented below. The burst was modestly long (lasted less than s) and intense (the fluence has reached in the 20–200 keV band) that allowed us to investigate its early X-ray afterglow in addition to the main event.
INSTRUMENTS AND DATA ANALYSIS
The International Gamma-Ray Astrophysics Laboratory INTEGRAL (Winkler et al. 2003) was placed into a high-apogee orbit by the PROTON launcher on October 17, 2002 (Eismont et al. 2003). There are four instruments on its board designed for simultaneous observations in -ray, X-ray and optical bands. In this paper we use data from the ISGRI detector (Lebrun et al. 2003) of the IBIS gamma-ray telescope (Ubertini et al. 2003) and from the SPI gamma-ray spectrometer (Vedrenne et al. 2003). GRB 060428C occurred away from the target INTEGRAL was pointed to, so it was outside the fields of view of the JEM-X X-ray monitor and the OMC optical monitor which are narrower than the fields of view of the main telescopes.
The IBIS telescope uses the principle of coded aperture to reconstruct images of the sky and study properties of individual sources. The telescope has a field of view of ( of it is fully coded) and an angular resolution of 12′ (FWHM). Such a resolution allows one to determine the position of bright sources with an accuracy better than 2′. The ISGRI detector of this telescope consists of 128128 CdTe semiconductor elements, with maximum sensitivity in the 18–200 keV energy band. The detector’s total area is equal to 2620 cm2, the effective area for sources near the center of the field of view is cm2 (half of the detector is shaded by opaque mask elements).
SPI spectrometer works also using the principle of coded aperture, but has the lower angular resolution (FWHM). The external diameter of the hexagonal field of view is equal to (of the fully coded region — ). The positional sensitivity is provided by 17 cryogenic Germanium detectors with a total area of cm2, detecting photons in the 20 keV – 8 MeV energy band. The instrument’s effective area is times smaller than the geometrical one due to shading by the mask.
We found GRB 060428C in the course of our studies under the project dedicated to searching for X-ray bursts in open (public) IBIS/ISGRI data. Methods of data reduction and analysis used in this project are described in detail by Chelovekov et al. (2006, 2007). They are based on the standard package (OSA) of procedures for scientific analysis of the INTEGRAL data. The comprehensive analysis of burst’s properties presented in this paper is carried out using data reduction procedures developed for IBIS/ISGRI at the Space Research Institute (Moscow). The general description of these procedures can be found in the paper by Revnivtsev et al. (2004). For the spectral analysis we used the standard response matrix of the OSA package (rmf-file of version 12 and arf-file of version 6), which has made good showing being applied to the spectral approximation of the Crab nebula. The spectrum of the nebula was adopted to be phot cm-2 s-1 keV-1, where is energy in keV. To perform spectral analysis we used the XSPEC software package.
The data analysis for the SPI gamma-ray spectrometer has been completely based on the OSA package, but as long as we studied a -ray burst, the background information has been determined from two time intervals immediately before and just after the burst. Reconstructing the broad-band spectrum we first fitted a normalization factor of the SPI data relatively the IBIS/ISGRI data together with parameters of the spectral model, and then frozen it at the obtained value (0.8).
TIME PROFILE OF THE BURST
Figure 1 shows a profile of the burst, measured with the IBIS/ISGRI telescope in the broad 20–200 keV energy band with a time resolution of 0.2 s. Time on the X-axis starts since 2h30m00s UT April 28, 2006. Each point in this figure is obtained by direct reconstruction of the image of the sky in the field of view of the telescope with subtraction of the background and subsequent measurement of the flux from the burst’s source. The count rate was corrected for dead-time effects and efficiency of observations (the effective area corresponding to a source position within the field of view of the telescope). A drop in the light curve at 44–46 s arose due to the overflow of a telemetry buffer (which is downloaded every 8 s).

The burst started at h30m35s UT and lasted s. The figure shows that after the end of this (main) event, the count rate did not returned immediately to the zero level but exceeded it during some period of time. It means that the telescope has detected a weak remaining emission (afterglow). The profile of the main event had a complicated time structure, consisting of many peaks of different amplitude and duration (down to 0.1 s). There are two comparatively long flares, separated by a drop of 1.5 s, clearly distinguished in the profile. The maximum flux, erg cm-2 s-1 (or phot cm-2 s-1) in the 20–200 keV band, was reached at 2h30m426 UT. This value was determined using a 1-s time interval near the maximum.
Time profiles of the burst (time records of the count rate with a resolution of 1 s) obtained by the SPI spectrometer of the INTEGRAL observatory in the 45–100 and 100–200 keV bands, and by the spacecrafts RHESSI and KONUS/WIND in the 25–120 keV and 50–200 keV bands respectively are shown in the left column of Fig. 2. The background count rate was not subtracted here. The similar time records of the IBIS/ISGRI count rate taken in the same energy bands are shown in the right column of the figure, for comparison. Due to different designs of the detectors in these experiments (having different dependences of sensitivity on energy) the usage of the same energy bands does not ensure the complete identity of the measured light curves. Nevertheless the figure shows a good enough qualitative coincidence of the curves obtained by different instruments. In the cases of RHESSI and, especially, KONUS/WIND the figure indicates a notable delay in detection of the burst relatively its detection by IBIS/ISGRI. The delay is connected with large distances between these spacecrafts requiring some extra time for a signal to travel from one spacecraft to another.
Producing the IBIS/ISGRI light curve we reconstructed the drop in the count rate during the interval of 44–46 s connected with the overflow of the telemetry buffer. We used the fact that information from some small parts of the detector has continued to come during the drop. The accuracy of such a procedure is confirming by a comparison of the resulted burst profiles with the data of other instruments. In general, the figure shows that statistical significance of observations of this burst by the IBIS/ISGRI telescope substantially exceeds the abilities of the other instruments. In particular, no one of the instruments has been able to confidently resolve the first long flare in the time profile of the burst relatively the more intense second flare.

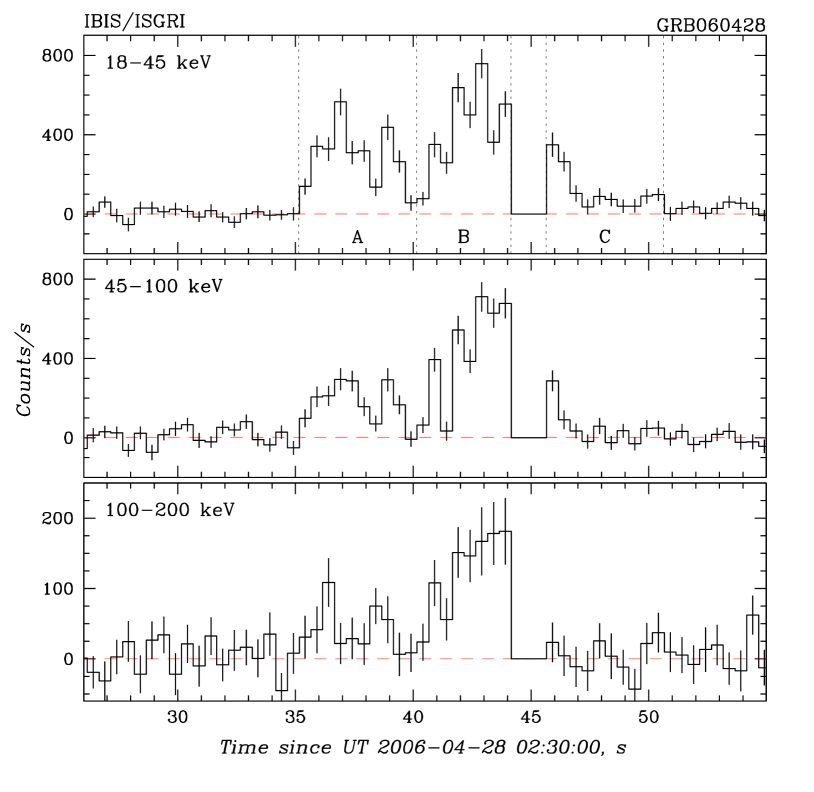
It is obvious from the figure that the second flare was decaying faster in the hard keV energy bands of SPI, IBIS/ISGRI and KONUS/WIND than in the softer ones. In this connection it is interesting to trace the evolution of the burst’s profile with energy. The IBIS/ISGRI profiles measured with a resolution of 0.5 s in the 18–45, 45–100 and 100–200 keV bands are shown in Fig. 3 from top to bottom. These profiles were obtained with the same method as the profile in Fig. 1. The figure confirms the presence of two flares (intervals A and B in the top panel of the figure) in the profile of the main event as well as the presence of weak remaining emission (interval C and the later observations). The spectrum of the first flare was obviously softer than that of the second flare. This means that the emission hardness has been increasing during the main event, which is pretty unusual for -ray bursts. It is likely that the figure indicates also some smoothing of the short term variability in the burst profile during the transition to higher energies. And finally, the figure shows that the emission during the interval C, at the stage of early afterglow, again becomes softer than that of the second flare of the main event, thus the second flare indeed was gading faster at high keV energies than at the low ones.

To demonstrate the fundamental difference of the emission at stage C from that at stages A and B, we show in Fig. 4 the IBIS/ISGRI profiles of the burst in different energy bands in a double logarithmic scale. It is seen that the flux during stage C and right after it (up to s) falls according to a power law with an index in the 15–45 keV energy band and in the 45–100 keV band. The power law like decay is characteristic of the -ray burst afterglow observed at their early stage for example by Burenin et al. (1999a,b), Tkachenko et al. (2000), Barthelmy et al. (2005), Vaughan et al. (2006), Nousek et al. (2006), O’Brien et al. (2006) and other authors.
LOCALIZATION
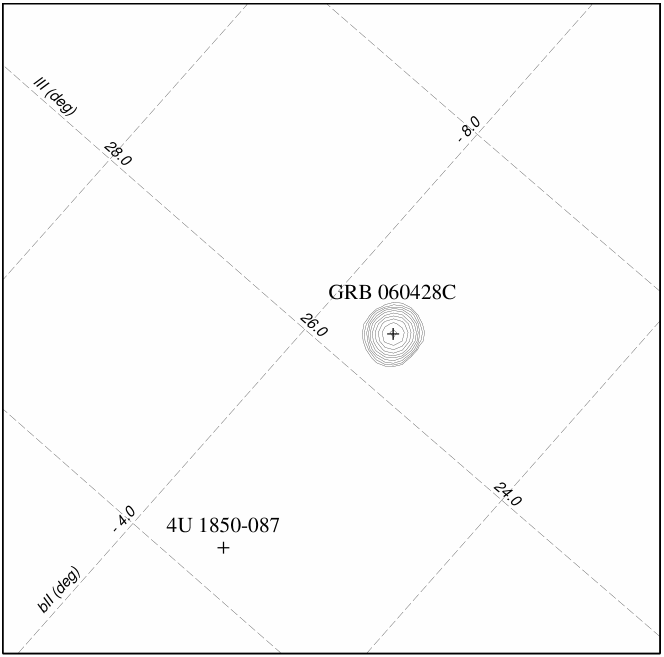
Figure 5 shows an image (a map of the signal to noise ratio ), obtained by the IBIS/ISGRI telescope in the 20–200 keV band during the first 13 s of the burst. Although there are many known X- and -ray sources located in this region of the sky, none was detected at the confident level during these 13 s. GRB 060428C was detected in the given energy band at the level . The position of the burst’s source, , (equinox 2000.0) was determined by the IBIS telescope with an accuracy of better than 2′. This accuracy notably exceeds ability of the triangulation method even if data of the KONUS/WIND instrument are used.
SPECTRUM OF THE BURST

The mean IBIS/ISGRI and SPI spectrum of GRB 060428C accumulated during the first 15.5 s of the burst (during intervals A, B and C indicated in the upper panel of Fig. 3) is shown in Fig. 6. The SPI data allow ones to trace the burst’s spectrum up to keV, although the IBIS/ISGRI data are more confident below keV. Table 1 lists the results of approximation of this spectrum in the 20–400 keV band with simple analytical models: a power law (PL) with a photon index , a power low with an exponential cut-off (CP) defined by an energy , and a double power law model (BM) by Band et al. (1993), which is broadly used in studies of -ray bursts. In Band’s model, the high energy power law index was frozen at the value . It is obvious that the models with a high energy cut-off (CP and BM) describe the observed spectrum much better than a single power law. It is easy to find the position of a maximum in the energy spectrum (spectrum in units of ) for the CP model — this position determines the “peak energy” of the burst keV.
Table 1. Approximation of the GRB 060428C spectrum from the IBIS/ISGRI and SPI data obtained in the 20–400 keV band during the first s of the burst.
| Model | ||||||
| PL | 1.47 (34) | |||||
| CP | 1.00 (33) | |||||
| BM | 0.98 (33) | |||||
| cut-off energy (keV) | ||||||
| photon index | ||||||
| photon index at high energies in the model by Band et al. (1993) | ||||||
| flux in the 20–200 keV band () | ||||||
| flux in the 20–400 keV band () | ||||||
| best-fit value of normalized for ( – number of degrees of freedom) | ||||||
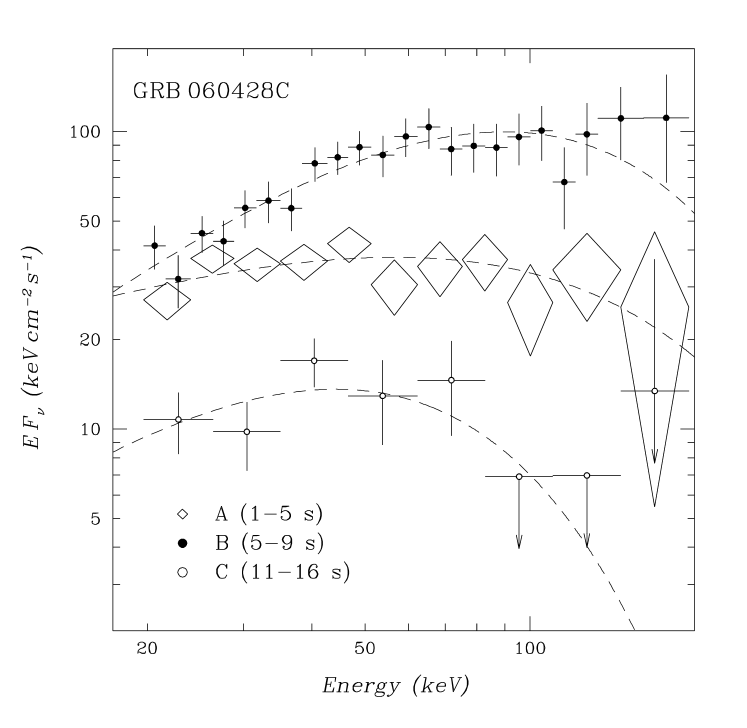
The evolution of the spectrum of GRB 060428C is shown in Fig. 7. The spectra A, B and C were obtained by the IBIS/ISGRI telescope at different stages of the burst (the time intervals corresponding to these stages are shown in Fig. 3). Dashed lines show the best-fit approximations of the spectra by a power law with an exponential cut-off at high energies. The results of approximation of these spectra by models PL and CP are listed in Table 2. It is seen that the emission spectrum was relatively soft (photon index of the model PL ) at the initial stage of the burst (during the first flare), it became to be much harder () at the end of the main event (during the second flare), but softened again during the afterglow ().
DISCUSSION
Although GRB 060428C has much of X- and -ray properties in common with those of the typical -ray bursts (for example, a hard almost power law spectrum extended to keV, a peak energy keV, peak erg cm-2 s-1 and total erg cm-2 fluxes, a duration of the main event s), it demonstrated simultaneously a number of features that made it to be very unusual and extremely interesting. In particular, only a few bursts were known before its discovery which hardness was increasing during the burst. There was of great interest a complicated multi-peak profile indicating of powerful processes of collisions of internal shock waves within the expanding envelope of the burst’s source. The duration of individual peaks s was defined by time lasting between relativistic ejecta responsible for colliding shock waves. But probably the most interesting feature of this burst was its early afterglow, decaying according to a steep power law with the index . Such a steep decay may be explained within the model by Kumar & Panaitesku (2000) of high-latitude emission of the burst occurred in a low density medium (the emission of relativistic shells moving with large angles to the directon to an observer, here is a Lorenz factor of the shell). In this model the law for a decay of the soft X-ray emission is determined by the equation where is a photon index of the hard emission of the main event. The observed afterglow is a combination of the high-latitude emission of all peaks in the profile. At higher energies, relativistic effects lead to the shift of the cut-off in the spectrum towards the softer band (the peak energy depends on time as ). The spectral softening observed with IBIS/ISGRI at the afterglow stage of the burst relatively the main event, the absence (weakening) of the afterglow in the hard energy channels 100–200 and 45–100 keV relatively the soft channel, and even the faster decay of the afterglow in the soft band relatively the theoretical dependency may be a direct consequence of these effects. Note that the peak energy decreases times during the transition from the spectrum B to the spectrum C (see Table 2). The faster decay of the afterglow may take place and in the case of strongly collimated gamma-ray burst.
Table 2. Approximation of the GRB 060428C spectrum at different stages of its evolution.
| Spectrum | Model | ||||
| A | PL | 1.02 (22) | |||
| CP | 0.97 (21) | ||||
| B | PL | 1.06 (22) | |||
| CP | 0.56 (21) | ||||
| C | PL | 0.98 (22) | |||
| CP | 0.80 (22) | ||||
| cut-off energy (keV) | |||||
| photon index | |||||
| flux in the 20–200 keV band () | |||||
| best fit value of normalized for ( – number of degrees of freedom) | |||||
| frozen with the value obtained for the spectrum B | |||||
The authors thank R.A. Burenin, S.Yu. Sazonov, K.A. Postnov and A.S. Pozanenko for valuable discussions. This research was based on data of the INTEGRAL observatory obtained through the Russian and European Science Data Centers for INTEGRAL. The research was supported by the Russian Foundation of Basic Research (through grant 05-02-17454), by the Presidium of the Russian Academy of Sciences (through the program “Origin and evolution of stars and galaxies”) and by the program of support of Russian leading scientific schools (through grant NSh-1100.2006.2).
REFERENCES
1. Band D., Matteson J., Ford L., et al., Astrophys. J. 413, 281 (1993).
2. Barthelmy S.D., Cannizzo J.K., Gehrels N., et al., Astrophys. J. 635, L133 (2005).
3. Burenin R.A., Vikhlinin A.A., Gilfanov M.R., et al., Astron. Astrophys. 344, L53 (1999a).
4. Burenin R.A., Vikhlinin A.A., Terekhov O.V., et al., Astron. Lett. 25, 411 (1999b).
5. Campana S., Barthelmy S.D., Burrows D.N., et al., GCN Circ. 5017 (2006).
6. Chelovekov I.V., Grebenev S.A., Sunyaev R.A., Astron. Lett., 32, 456 (2006).
7. Chelovekov I.V., Grebenev S.A., Sunyaev R.A., in Proc. of the 6th INTEGRAL Workshop “The Obsqured Universe” (Eds. S.A. Grebenev, R.A. Sunyaev, C. Winkler, Moscow, 2006), ESA-SP 622 (2007); astro-ph:0709.2328.
8. Eismont N.A., Ditrikh A.V., Janin G., et al., Astron. Astrophys. 411, L37 (2003).
9. Kumar P., Panaitesku A., Astrophys. J. 541, L51 (2000).
10. Lebrun F., Leray J.P., Lavocat P., et al., Astron. Astrophys. 411, L141 (2003).
11. Mangano V., Barthelmy S.D., Burrows D.N., et al., GCN Circ. 5014 (2006).
12. Mereghetti S., Götz D., Borkowski J., et al., Astron. Astrophys. 411, L291 (2003).
13. Nousek J.A., Kouveliotou C., Grupe D., et al., Astrophys. J. 642, 389 (2006).
14. O’Brien P.T., Willingale R., Osborne J., et al., Astrophys. J. 647 1213 (2006).
15. Revnivtsev M.G., R.A. Sunyaev R.A., Varshalovich D.A., et al., Astron. Lett. 30, 382 (2004).
16. Tkachenko A.Yu., Burenin R.A., Terekhov O.V., et al., Astron. Astrophys. 358, L41 (2000).
17. Ubertini P., Lebrun F., Di Cocco G., et al., Astron. Astrophys. 411, L131 (2003).
18. Vaughan S., Goad M.R., Beardmore A.P., et al., Astrophys. J. 638, 920 (2006).
19. Vedrenne G., Roques J.-P., Schönfelder V., et al., Astron. Astrophys. 411, L63 (2003).
20. Winkler C., Courvoisier T.J.-L., Di Cocco G., et al., Astron. Astrophys. 411, L1 (2003).