Super-resolving distant galaxies with gravitational telescopes: Keck-LGSAO and Hubble imaging of the lens system SDSSJ0737+3216
Abstract
We combine high-resolution images in four optical/infra-red bands, obtained with the laser guide star adaptive optics system on the Keck Telescope and with the Hubble Space Telescope, to study the gravitational lens system SDSSJ0737+3216 (lens redshift 0.3223 , source redshift 0.5812 ). We show that (under favorable observing conditions) ground-based images are comparable to those obtained with HST in terms of precision in the determination of the parameters of both the lens mass distribution and the background source. We also quantify the systematic errors associated with both the incomplete knowledge of the PSF, and the uncertain process of lens galaxy light removal, and find that similar accuracy can be achieved with Keck LGSAO as with HST. We then exploit this well-calibrated combination of optical and gravitational telescopes to perform a multi-wavelength study of the source galaxy at effective resolution.
We find the Sérsic index to be indicative of a disk-like object, but the measured half-light radius ( = ) and stellar mass ( = ) place it more than three sigma away from the local disk size-mass relation. The SDSSJ0737+3216 source has the characteristics of the most compact faint blue galaxies studied, and has comparable size and mass to dwarf early-type galaxies in the local universe. With the aid of gravitational telescopes to measure individual objects’ brightness profiles to 10% accuracy, the study of the high-redshift size-mass relation may be extended by an order of magnitude or more beyond existing surveys at the low-mass end, thus providing a new observational test of galaxy formation models.
Subject headings:
galaxies: fundamental parameters — gravitational lensing — instrumentation: adaptive optics — methods: data analysis — techniques: high angular resolution1. Introduction
Galaxies do not appear in arbitrary combinations of luminosity, mass and shape, but instead obey empirical scaling relations (such as the Fundamental Plane for early-type galaxies). Explaining the origin, and cosmic evolution, of the scaling relations is a fundamental goal of galaxy formation theories.
As far as disk galaxies are concerned, the hierarchical structure formation scenario predicts a correlation between size and stellar mass, with width depending on the distribution of the initial spin of the dark halos (Fall & Efstathiou 1980). At any given mass, the expected distribution of sizes is well-approximated by a log-normal distribution. Qualitatively, this prediction is quite robust, although the exact forms of the correlation and the distribution depend on the details of baryonic processes such as energy feedback from star formation and bulge instability (Mo et al. 1998; Shen et al. 2003; Tonini et al. 2006; Dutton et al. 2007; Stringer & Benson 2007). Therefore, measuring the shape and width of the correlation provides not only a test of the standard paradigm, but also valuable information on the poorly-understood baryonic processes happening at sub-galactic scales.
From an empirical point of view, the relation between size, luminosity (or equivalently surface brightness) and stellar mass is well established for disk galaxies in the local Universe (e.g. Shen et al. 2003; Driver et al. 2005). Analysis of suitable objects in the Sloan Digital Sky Survey shows that at any given mass (luminosity) the distribution of galaxies is indeed well-approximated as log-normal, although the scaling with mass of the characteristic size and the width of the distribution are non-trivial. Defining disk galaxies as those being well-fit by a single Sérsic component with index , Shen et al. (2003) find that above a characteristic stellar mass ( corresponding to approximately M), size scales rapidly with stellar mass () and the scatter is relatively small (). Below the characteristic stellar mass the correlation flattens () and the scatter increases significantly ().
At intermediate redshift () the nature and interpretation of the size-luminosity or size-mass relation is more uncertain. Several authors (e.g. Ferguson et al. 2004; Barden et al. 2005; Trujillo et al. 2006; Melbourne et al. 2006) have used Hubble Space Telescope images to determine the sizes of intermediate and high () redshift galaxies, down to the resolution and completeness limits of HST (roughly equivalent to 1 kpc and 10). Recent studies conclude, taking selection effects into account, that there is significant evolution in the size-luminosity relation (Barden et al. 2005; Trujillo et al. 2006; Melbourne et al. 2006). However, it is hard to disentangle luminosity evolution from size evolution, to ensure that samples at different redshifts are directly comparable, and to compare results from different studies, as the selection criteria are often similar but not identical (e.g. color vs. morphology; morphology determined via Sérsic index vs. bulge to disk decomposition vs. concentration parameter vs. visual classification). Overall, it appears that disk galaxy evolution cannot be explained by pure luminosity or pure size evolution, but requires a combination of both. In contrast, the relation between size and stellar mass appears to have changed very little since (Barden et al. 2005), much less than would be expected in the naive model where stellar mass and size are proportional to the virial mass and radius (and hence size is expected to scale as , where is the Hubble parameter). Rather, galaxies appear to be growing “inside-out” in scale radius as their stellar mass increases such that the size-mass relation is preserved over cosmic time (Barden et al. 2005). It has been suggested that galaxy evolution models that take into account the ever-increasing concentration of dark matter halos, and the further effect of baryons via adiabatic contraction could provide the physics required to reproduce the observed trend (Somerville et al. 2006), although this may make it more difficult to reproduce simultaneously other scaling laws, for example the Tully-Fisher (Tully & Fisher 1977) relation (Dutton et al. 2007).
Lower mass () galaxies are even less well understood. While the local size-mass relations of Shen et al. (2003) for low () and high () Sérsic index objects diverge, the interpretation of Sérsic index as a morphological galaxy classifier becomes more uncertain at lower masses (e.g. Capaccioli et al. 1992; Trujillo et al. 2004). At the same time, the measurement of the structural parameters themselves becomes harder as the galaxy size decreases. Nevertheless, such small galaxies are important objects to understand: the luminous compact blue galaxies first noted by Koo & Kron (1988) appear in large numbers at intermediate redshifts in deep HST images (e.g. Noeske et al. 2006; Rawat et al. 2007), but evolve very rapidly to vanishing abundance in the local universe. What becomes of these objects, which represent sites of small-scale but vigorous star formation, is a topic of some debate, with dwarf spheroids (e.g. Koo et al. 1994; Noeske et al. 2006) and the bulges of disk galaxies (e.g. Hammer et al. 2001; Rawat et al. 2007) the principle candidates.
Gravitational lensing is a powerful tool with which to extend the investigation of scaling laws over cosmic time (e.g. Treu 2007). On the one hand, the lensing geometry provides a precise and almost model-independent measure of total mass of the lens galaxy. Since the lens galaxies are mostly early-type galaxies (or the bulges of spirals), this gives a new handle on the mass profile of these systems (Treu & Koopmans 2004; Koopmans et al. 2006) and hence, for example, on the relationship between stellar and total mass (Bolton et al. 2007). On the other hand, the background source is typically magnified by a factor of 10, mostly in the form of a stretch along the azimuthal direction. While lensing preserves surface brightness, the increase in apparent size of the lensed source means that the number of pixels at any one surface brightness also increases, such that the isophotes are observed at higher signal-to-noise. Thus, gravitational lenses act as natural telescopes, allowing one to gain a factor of in sensitivity and spatial resolution, and thus improve markedly our ability to study the size and dynamical mass (through rotation curves) of intermediate and high redshift galaxies. For example, studies of the internal structure of faint blue galaxies (Ellis 1997), and in particular the most compact of these (Koo et al. 1994), are currently limited by the resolution of HST (Phillips et al. 1997). When magnified by a gravitational lens, such objects become well-resolved. Thanks to the dedicated efforts of several groups, the number of known gravitational lenses is increasing dramatically: it is now possible to envision statistical studies of relatively large sample of lensing or lensed galaxies in the near future.
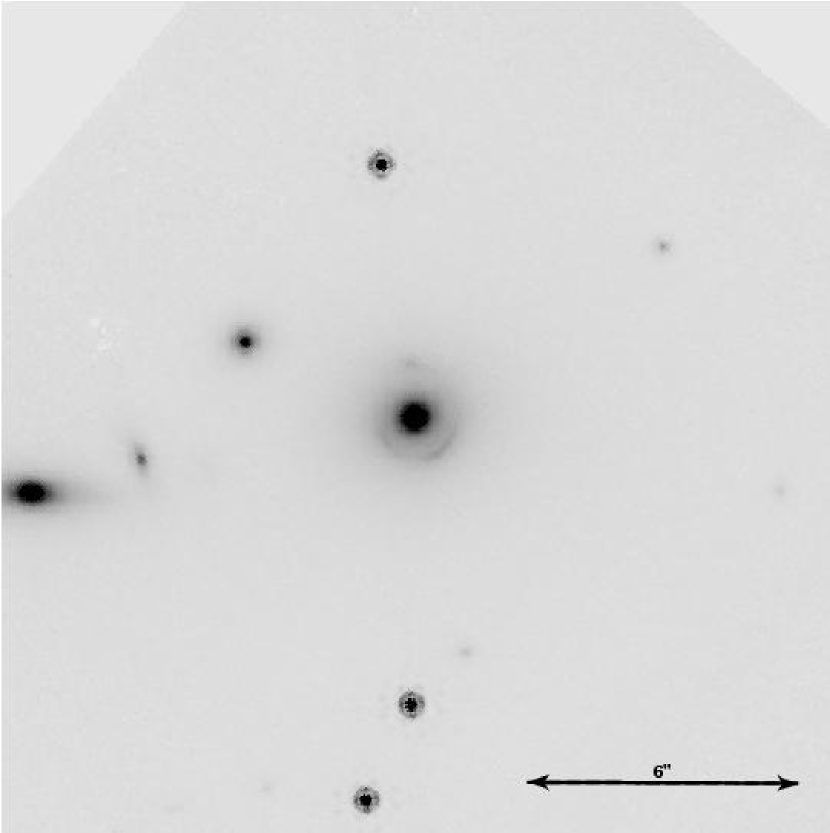
In this paper we present multi-color high-resolution images of the gravitational lens system SDSSJ0737+3216 (Bolton et al. 2006), obtained with both the Hubble Space Telescope and with the Laser Guide Star Adaptive Optics (LGSAO) System on Keck II. The scientific goal of the analysis of this case study is two-fold. First, we perform a detailed comparison of the results of the lens modeling across bands, showing that – when a bright nearby star is available for tip-tilt correction and conditions are favorable – the most important parameters can be measured with comparable accuracy with HST and Keck-LGSAO. Second, we exploit this particular cosmic telescope to achieve super-resolution of the source galaxy. (See McKean et al. 2007, for Keck LGSAO observations of a lens with a point-like source.) With a lens magnification of , the resolution of the HST and Keck images ( FWHM) corresponds to a physical scale of () at the redshift of the source = 0.5812 , comparable to the resolution attainable from the ground when studying galaxies in the Virgo Cluster in arcsec seeing. We derive the Sérsic index, size, and stellar mass of the source, and show that using gravitational telescopes the size-mass relation may be extended by an order of magnitude in size with respect to current studies, thus allowing one to probe, for example, whether the change in slope and intrinsic scatter below the characteristic mass persists to higher redshifts.
This paper is organized as follows. After describing the observations in section 2, we outline in sections 3 and 4 two sources of systematic error and our strategies for dealing with them, before explaining our modeling methodology in section 5. In sections 6 and 7 we present our results, which are then discussed (section 9) before we draw conclusions in section 10. Throughout this paper magnitudes are given in the AB system. We assume a concordance cosmology with matter and dark energy density , , and Hubble constant H0=70 kms-1Mpc-1.
2. Description of the observations

2.1. NIRC2 on Keck
On December 11, 2006, we imaged SDSSJ0737+3216 with the LGSAO system on the Keck II telescope. The images were taken in the K’ -band with the near-infrared camera (NIRC2) in the wide field () of view. The pixel scale for this configuration is pix-1. A total of 3120 seconds of exposure was obtained. To avoid saturating stars in the field, individual exposures were 1 minute in duration (divided into two 30-second co-adds). A dither was executed after every set of 2 exposures to improve the sky sampling. Dithers were randomly chosen using a script with a circular dither pattern of radius . The laser was positioned at the center of each frame, rather than fixed on the central galaxy. Steinbring et al. (2007, submitted) demonstrate that this method provides a more uniform AO correction over a larger area, in comparison with the fixed laser method. Observing conditions during the run were good.
The observations were made as part of the Center for Adaptive Optics Treasury Survey (CATS, Larkin et al. 2007, in prep), which aims to image distant galaxies with Keck adaptive optics. The images were processed with the CATS reduction procedure described in Melbourne et al. (2005). A sky frame and a sky flat were created from the individual science exposures after masking objects. Frames were then flat-fielded and sky-subtracted. The images were de-warped to correct for known camera distortions. The frames were aligned by centroiding on objects in the field, and finally co-added to produce the final image.
The final processed image shows three unsaturated stars lying within of the lens position. Two of these stars are between the tip-tilt star and the lens. The third lies on the opposite side of lens from the tip-tilt star. These stars provide a very strong constraint on the point-spread-function (PSF), which is often difficult to track for AO observations. A further constraint on the PSF comes from observations of a PSF star-pair. The star-pair observations were made immediately following the lens observations. We picked a star pair that had a tip-tilt/PSF orientation and separation similar to the tip-tilt/lens system. As a result, the lens observation has one of the best constrained PSFs ever obtained for an extragalactic AO observation.
A visual inspection of the stars in the field reveals an approximate double Gaussian profile, as used in simple models of adaptive optics PSFs (e.g. Law et al. 2006). The small-scale component of this profile was observed to have a FWHM of pixels, or arcsec. This is significantly larger than the diffraction limit of Keck in the K-band (), but is primarily the result of using the wide-field camera which slightly under-samples the PSF. The large-scale Gaussian component has a FWHM of arcsec, indicating very good seeing. From this simple PSF picture we estimate the Strehl ratio to be approximately 0.35 for all the PSF stars, demonstrating consistently good AO performance in these observations.
2.2. ACS/NICMOS on HST
The lens system was observed with the Advanced Camera for Surveys (ACS) and with the Near Infrared Camera and Multi Object Spectrograph (NICMOS) on board HST on November 5 2006, as part of HST program 10494 (PI: Koopmans). One-orbit integrations were obtained through filters F555W (2200s) and F814W (2272s) with the Wide Field Camera centering the lens on the WFC1 aperture, i.e. in the center of the second CCD. 111Prior to the taking of these deep images, shallow (420s) integrations were obtained with ACS in both the F435W and F814W filters (Bolton et al. 2006), as part of the initial SLACS snapshot program. These data are not used here due to the low signal-to-noise and significant cosmic ray contamination, both of which prevent detailed study of the faint ring. Four sub-exposures were obtained with a half-integer pixel offset (acs-wfc-dither-box) to ensure proper cosmic ray removal and sampling of the point spread function. A one orbit integration with the NIC2 camera through filter F160W was obtained with NICMOS in multiaccum mode for a total exposure time of 2560s. As with ACS, the integration was split in four sub-exposures with a semi-integer pixel offset to ensure proper cosmic ray/defect removal and improve sampling of the point spread function.
The ACS data were reduced using multidrizzle (Koekemoer et al. 2002) as described in Gavazzi et al. (2007). The NICMOS data were reduced using a set of iraf scripts based on the dither package (Fruchter & Hook 2002), as described in Treu & Koopmans (2004). The output pixel size was set to match that of NIRC2 () to facilitate comparison between the HST and reduced NIRC2 images.
3. PSF characterization
In order to predict accurately the data given a model lens image, we must convolve it with the point spread function (PSF) of the telescope. For the instruments on HST the PSF is calculable from the engineering parameters that characterize the optics and detectors, using the TinyTim package (Krist & Hook 1997). However, the PSF varies over time, both as a result of the “breathing” of the telescope over the course of an orbit, but also monotonically as the system ages: the Tiny Tim approximation is not always sufficient.
Somewhat similarly, the PSF derived from first principles for an adaptive optics system is the sum of a Moffat profile for the seeing disk, and the diffraction pattern due to the telescope itself. In practice, the seeing, and the Strehl ratio, vary over the course of a set of observations, making a priori predictions of the PSF of limited use.
In principle, one could include some variable parameters to describe the model PSFs introduced above, and then fit for them simultaneously with the lens model parameters. We show in Section 6 that there is indeed enough information in our data to constrain the PSF, thanks to the multiple-images produced by the lens, but defer the investigation of model PSF parameters to further work. Here we take a pragmatic approach and use nearby unsaturated stars as estimates of the PSF at the position of the lens. For the case of SDSSJ0737+3216 there are three suitable stars within arcsec from the lens; we excised small cutout images of these stars from the images from each instrument/filter combination. The properties of these stars (henceforth referred to as PSF1 , PSF2 , and PSF3 ) are given in Table 1. In addition, for the NIRC2 observations we used a fourth star as described in section 2.1. The use of any given one of these stellar model PSFs constitutes an assumption which we can test using a statistical model selection procedure we describe below.
| ID | RA | Dec. | |||
|---|---|---|---|---|---|
| (J2000) | (J2000) | (arcsec) | (arcsec) | (AB) | |
| PSF0 | 07:03:11.84 | -08:20:51.8 | 0.0 | 17.8 | 15.0 |
| PSF1 | 07:37:28.54 | +32:16:10.2 | 8.5 | 14.7 | 18.2 |
| PSF2 | 07:37:28.46 | +32:16:12.3 | 6.3 | 16.4 | 18.1 |
| PSF3 | 07:37:28.51 | +32:16:24.2 | 5.6 | 28.4 | 18.3 |
This phenomenological model has the advantage that it takes into account the time-variability of the PSF as well as possible, providing a simultaneous estimate of the PSF with the actual data. It also takes into account the details of the image combination procedure in a natural way – whatever was done to the pixels of the lens image was also done to the PSF. One disadvantage of our approach is the introduction of additional noise – however, the stars are significantly brighter than the lens system and the pixel noise in the PSF images can, we believe, be safely neglected. Three other disadvantages of our approach are that the stellar spectra will not exactly match the spectra of the lens or source galaxies within a given filter, nor will the position of the PSF stars within a pixel exactly match the intra-pixel centroiding of the lens or source galaxies, and nor will the PSF at the position of the stars exactly match that at the lens position. In the absence of a suitable interpolation scheme to solve these problems, we resign ourselves to having just three models to choose from, and attempt to infer the most appropriate one of the three from the data. Following this procedure will give us an indication of the relative importance of accurately knowing the PSF. In other words, the variation of the results as a function of adopted PSF will give us an indication of the systematic error introduced by our approximate PSF. As we will show in the next sections the parameters that we are interested in are fairly insensitive to the choice of the PSF, and that our ignorance of the the PSF is not the dominant source of error in our analysis.
4. Lens galaxy subtraction
As can be seen in Figure 1, the lens galaxy is much brighter than the (lensed) source galaxy, and is a significant source of contamination at the arc positions. The usual approach to this profile is to subtract a smooth intensity distribution fitted to the lens galaxy light. Bolton et al. (2006) found it necessary to use a flexible B-spline model, combined with careful manual masking of the multiple images, in order to obtain a satisfactory removal of the lens light. The problem is that it is fundamentally very difficult to disentangle the light coming from the lens galaxy from that coming from the source. Moustakas et al. (2006) used the simpler elliptically-symmetric Moffat profile; a Sérsic profile fit could also have been performed. To quantify this source of systematic uncertainty we investigate both lens galaxy subtraction methods found in the literature, test them as best we can using the data, and compare the results in terms of relevant lens and source parameters.
In subtraction scheme sub we used a SExtractor segmentation map to mask out the detected pixels associated with the lensed images, and then fitted an elliptically symmetric B-spline model with two angular modes (see the appendix of Bolton et al. 2006, for details). In this scheme, there is a danger that the tangentially-stretched images will be truncated, leading to an overly-compact inferred source. The Moffat profile fit (henceforth referred to as subtraction scheme msub ) was performed as in (Moustakas et al. 2006), with no masking of the image. This model has the benefit of being somewhat more robust, but must be expected to provide a much poorer quality of fit, leaving more lens galaxy flux in the residual image and leading to a brighter, larger inferred source. Based on these considerations, we expect that the two schemes will bracket the ideal solution and thus provide an estimate of the systematic uncertainty. A Sérsic profile fit may well provide a better fit to the lens galaxy light than the Moffat profile: we use the Moffat profile in order to make our systematic error estimate a conservative one.
5. Lens modeling methodology
Modeling of the images of extended sources lensed by galaxy-scale lenses has been the subject of some considerable research in the last few years (see e.g. Warren & Dye 2003; Treu & Koopmans 2004; Dye & Warren 2005; Koopmans 2005; Suyu et al. 2006; Brewer & Lewis 2006; Barnabe’ & Koopmans 2007). The differences between these works revolve around the choice of regularization scheme for the reconstructed source plane image, while the lens models are largely consistent between the methods and reflect the simplicity and consistency observed in gravitational lens potentials (Koopmans et al. 2006). The regularization is important due to the very large numbers of parameters employed to describe the source plane intensity.
In this work, and in a previous article (Moustakas et al. 2006), we choose to model the source galaxy using simply-parametrized elliptically-symmetric Sérsic profile components. We pursue this approach for two reasons. Firstly, images of intermediate and high redshift galaxies very often show morphologies representable by collections of simply-parameterized components (bulges, disks, star-forming regions etc.). The second reason is that we seek a quantitative understanding of galaxy luminosity, mass, size and shape as a function of redshift, and this is best achieved by analyzing the image data within the context of a sensible phenomenological model (the Sérsic profile). The resulting inferences will of course be model-dependent (by design), and we should expect the corresponding precision to be high as a result of the additional information used in the fit. Most importantly, our results will be directly comparable to other photometric and morphological studies. After all, a pixel based reconstruction will have to be fit by a parameterized Sérsic model in order to derive shape and luminosity parameters that can be compared with the literature.
For our lens models we follow previous authors and use the singular isothermal ellipsoid (SIE) model (e.g., Kormann et al. 1994). A number of authors (e.g., Treu & Koopmans 2004; Rusin & Kochanek 2005; Koopmans et al. 2006) have shown the SIE model to provide a very good approximation of the lens potential on galaxy scales. The basic lens equations describing the deflection of light by this model can be found readily elsewhere Kormann et al. (e.g. 1994); Evans & Wilkinson (e.g. 1998); Evans & Witt (e.g. 2001); Schneider (e.g. 2006) and are not repeated here. Suffice to say that given the deflection angle as a function of lens plane position, the corresponding source plane position can be rapidly calculated, using the formulae in Evans & Witt (e.g. , 2001). The price we pay for this high computation speed is a significant systematic error in the source parameters as inferred through the lens. The intrinsic spread of logarithmic density slopes (where the SIE profile has slope ) is approximately 0.12, based on the large sample of strong lenses analysed by Koopmans et al. (2006); in the appendix we show that this gives rise to a fractional uncertainty in source size of about 12%, and an error in the inferred source magnitude of 0.26. Implementing a more flexible lens model would translate this systematic error into a statistical one – while this is beyond the scope of this paper we note that a reasonable goal is to reduce all other systematic errors to below the level set by the lens mass profile.
Since our source surface brightness distribution is the analytic Sérsic profile, we can compute the source intensity at each desired source plane position, and assign it to the original image plane pixel value – we do this on a twice sub-sampled grid to reduce rounding errors. (This simple but effective “poor man’s ray-tracing” is described further in Schneider et al. 1992). In this way a predicted image can be calculated for any given set of lens and source parameters. Before comparison with the data image we convolve the model image with a PSF image (derived from the image of a nearby star, as described in Section 3 above). With the PSF image grid being much smaller than the data image grid the speed of the computation is greatly increased.
The -pixel model image and data image are compared via the likelihood function:
| (1) | |||||
| (2) | |||||
| (3) |
This form contains an implicit assumption of uncorrelated Gaussian pixel noise, which is well-justified for the background-limited Keck data. When using the HST images, we note that the counts are always such that the Gaussian approximation to the Poisson distribution is always valid, and compute the uncertainties from the square root of the image itself. We account for the correlated noise introduced by the drizzling procedure by computing the equivalent single pixel noise (Casertano et al. 2000), essentially by reducing the uncertainties by a factor close to the fourth power of the ratio between the output and input pixel scales. This has the effect of making the reduced chi-squared approximately equal to unity in the case of a good fit. In principle one could estimate the pixel covariance matrix and use that in the calculation of , at greater computational expense. We leave this to future work, and note that the correlated errors are unlikely to affect our statistical error bars by more than a factor of two. As we shall see, systematic errors are of greater concern.
Our simple lens model has 5 parameters: position ( and ), velocity dispersion ,222While the strong lensing image separation is a direct measurement of the mass enclosed by the Einstein radius, when working with the SIE model the overall normalisation is more conveniently described by the single parameter . This has the added benefit of being (more or less) straightforwardly connected to dynamical mass estimates from spectroscopic velocity dispersions (e.g. Treu & Koopmans 2002) mass distribution ellipticity (defined as where is the axis ratio), and orientation angle. We assign uniform prior PDFs on the latter three; for the lens centroid we take the center of the lens light as our best guess, and assert a Gaussian prior PDF of width one pixel centered on this position. Similarly, for the source position we assign a Gaussian prior PDF of width 0.1 arcsec centered on the lens position. (Since we know that the source is lensed, and into a almost circular ring at that, we know that the source position must be very close to the optical axis. The Gaussian prior does allow for putative source positions at larger radii, but has the effect of sensibly down-weighting those models which are unlikely to provide a good fit. The value of comes purely from experience with looking at lens models and simulated lenses.) However, we assign uninformative uniform priors for the orientation , Sérsic index , effective radius , and source magnitude (where the logarithmic nature of this quantity captures our even greater prior ignorance). For the ellipticity we assume the standard weak lensing intrinsic ellipticity distribution, a Rayleigh distribution of mean 0.25. (Note that the relation between the effective radius , effective semi-major axis and axis ratio is , so that our effective radii may be compared directly with the “circularised” radii of e.g. Shen et al. 2003). We shall see in sections 6.1 and 7.1 that our choices of prior PDF have very little influence on the posterior inferences. These are defined by the joint posterior PDF:
| (4) |
is the product of the individual prior PDFs referred to above. We sample the unnormalized numerator of equation 4 using the multi-purpose Markov Chain Monte-Carlo code BayeSys (Skilling 2004), a robust package used in a number of other cosmology and lensing analyses (e.g. Odman et al. 2004; Marshall 2006; Limousin et al. 2006, and Jullo et al 2007, in prep.).
The symbol in equation 4 represents the set of assumptions that go into the inference of the parameters via the MCMC analysis. Such models can be compared quantitatively using the evidence, . This statistic is calculated during the initial “burn-in” period of the sampler, and, while dominated by the goodness of fit, does take into account the different prior PDFs that might be employed. For further reading about evidence analysis we recommend MacKay (2003).
In this work, the prior PDFs are kept fixed while different PSF models and lens galaxy subtraction schemes are tried, an approach also followed by Suyu et al (2007, in prep.). A simple ranking could be achieved by using some different monotonic function of the chi-squared statistic; we note here though that the correct weights to use when combining parameter estimates from different analyses are exactly the evidence values (provided all models are deemed equally probable a priori). This can be seen by marginalizing the parameter posterior PDF over the models – each individual model’s posterior gets multiplied by its (renormalized) evidence during the summation:
| (5) |
In practice, one model often has much higher evidence than the others on offer, meaning that the sum can be approximated by this single term: this is model selection.
6. Lens modeling results
Figure 2 shows the fits to the four imaging datasets introduced above. For subtraction scheme sub (see section 4, shown in the Figure) the residuals are close to zero, with little significant structure in the residual images (especially in the infra-red filters). We show the results of the statistical model selection analysis in Table 2, for all datasets.
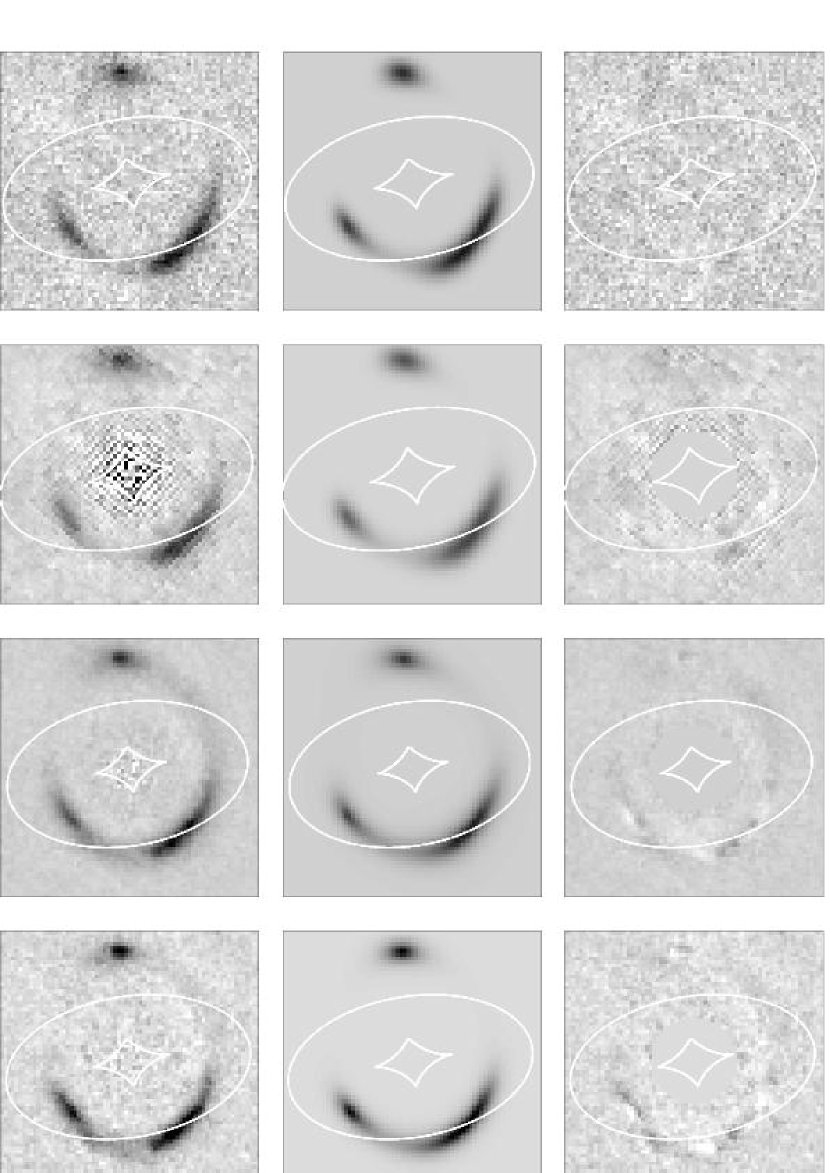
We find that the different PSF models are easily differentiated (top half of the table), with typical evidence ratios of a few tens. This is reflected in the chi-squared statistic,which is not surprising given that the parameter space volumes are identical between the different PSF models. The relative evidence is determined almost entirely by the goodness of fit, which is significantly better for PSF0 in the case of the NIRC2 data. 333We put the reduced chi-squared values in context by computing the number of sigma, , by which the unreduced chi-squared deviates from the mean of its distribution. We do this using Fisher’s approximation, that is Gaussian-distributed with mean and unit variance, where is the number of degrees of freedom, assumed to be large. This may be due to the shape of the PSF at the lens being better matched by a stellar image at the same position relative to the laser spot (which PSF0 provides). For the HST datasets, the most appropriate PSF star to use varies between filters, as we might expect.
The situation with the lens galaxy subtraction schemes is less clear: here the goodness of fit is dominated by the lens galaxy model such that we cannot use the evidence straightforwardly to select the most appropriate model for the source galaxy. The limiting case would be a lens galaxy model so flexible that all the flux was subtracted, leaving a zero-flux inferred source and a chi-squared of zero. What we can take from Table 2 is that the low goodness of fit associated with subtraction scheme msub indicates that a significant amount of lens galaxy flux is being left un-subtracted, a conclusion vindicated by inspection of the residual images (not shown). The different schemes provide us with a rough estimate of the contribution of lens galaxy subtraction to our systematic error budget.
A side effect of the domination of the lens galaxy subtraction problem is that the reduced chi-squared values from the lens modeling are often not close to unity. However, this need not affect our conclusions about the PSF model for fixed subtraction scheme: a good PSF is required at all 4 image positions, but the galaxy subtraction residuals vary between these points.
| Dataset | Subtraction | PSF | Relative | ||
| scheme | model | evidence | |||
| NIRC2+LGSAO | sub | PSF0 | 1.219 | 10.6 | 1.0 |
| K’ | sub | PSF1 | 1.220 | 10.7 | 0.03 |
| sub | PSF2 | 1.222 | 10.8 | 0.001 | |
| HST NICMOS | sub | PSF1 | 0.991 | -0.46 | 1.0 |
| F160W | sub | PSF2 | 0.990 | -0.52 | 193 |
| sub | PSF3 | 0.991 | -0.43 | 0.2 | |
| HST ACS | sub | PSF1 | 6.276 | 153.3 | 1.0 |
| F814W | sub | PSF2 | 6.259 | 153.0 | |
| sub | PSF3 | 6.277 | 153.4 | 0.4 | |
| HST ACS | sub | PSF1 | 1.083 | 4.16 | 1.0 |
| F555W | sub | PSF2 | 1.084 | 4.18 | 0.07 |
| sub | PSF3 | 1.084 | 4.20 | 0.01 | |
| NIRC2+LGSAO | sub | PSF0 | 1.219 | 10.6 | 1.0 |
| K’ | msub | PSF0 | 2.704 | 65.7 | |
| HST NICMOS | sub | PSF2 | 0.989 | -0.52 | 1.0 |
| F160W | msub | PSF2 | 2.596 | 62.3 | |
| HST ACS | sub | PSF2 | 6.259 | 153 | 1.0 |
| F814W | msub | PSF2 | 297 | 2650 | |
| HST ACS | sub | PSF1 | 1.083 | 4.2 | 1.0 |
| F555W | msub | PSF1 | 1.666 | 29.6 |
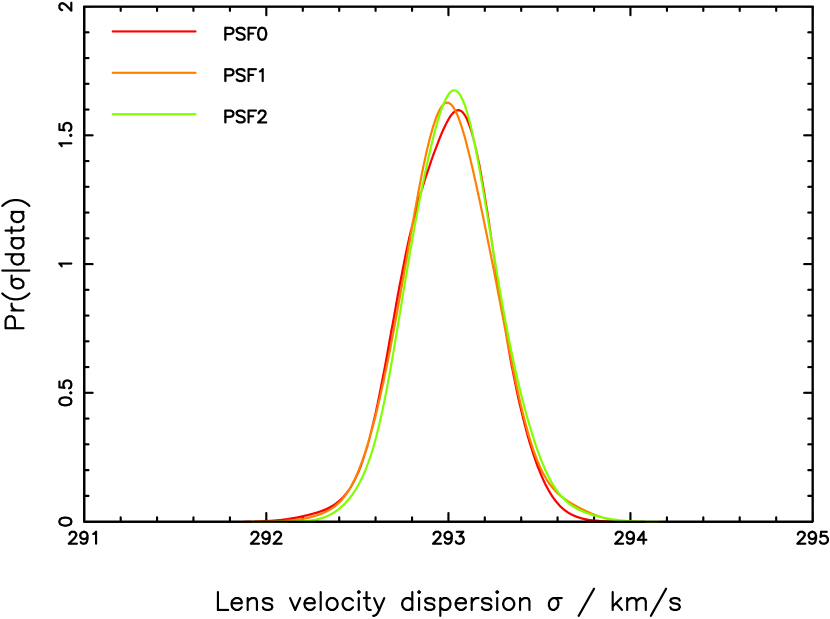
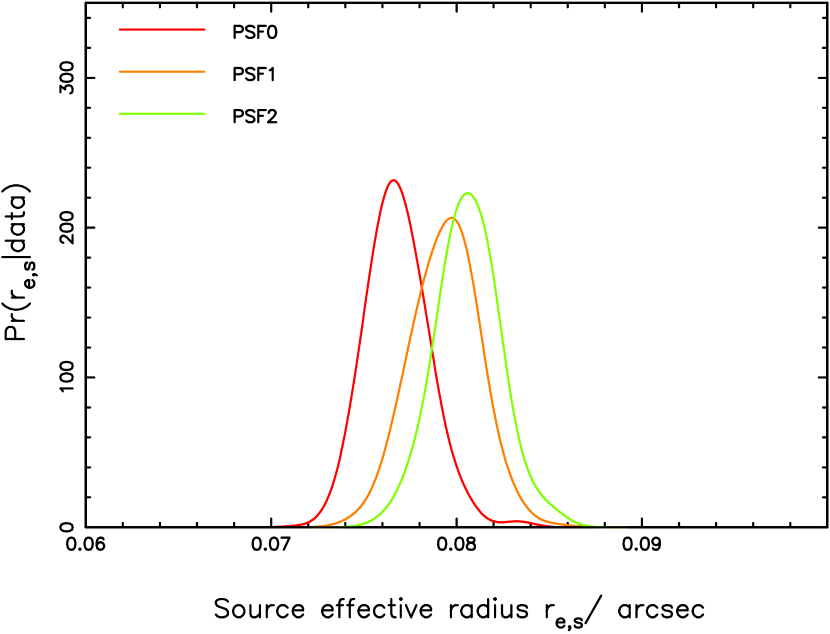
Figure 3 shows the 1-d marginalized probability distributions for a selection of lens and source model parameters, given the NIRC2+LGSAO infra-red imaging dataset, in order to illustrate the effect of the different PSF models and the different lens galaxy subtraction schemes on the inferences. Similar results were obtained from the other filters’ data, and are not shown here for the sake of clarity.
This figure shows that the choice of PSF model is not critical in determining the available accuracy on the model parameters: in all cases the parameter estimates agree within the statistical precision. The choice of lens galaxy subtraction scheme has a more significant effect on the model parameters; in particular, the two schemes investigated give rise to a difference of magnitudes in source brightness.
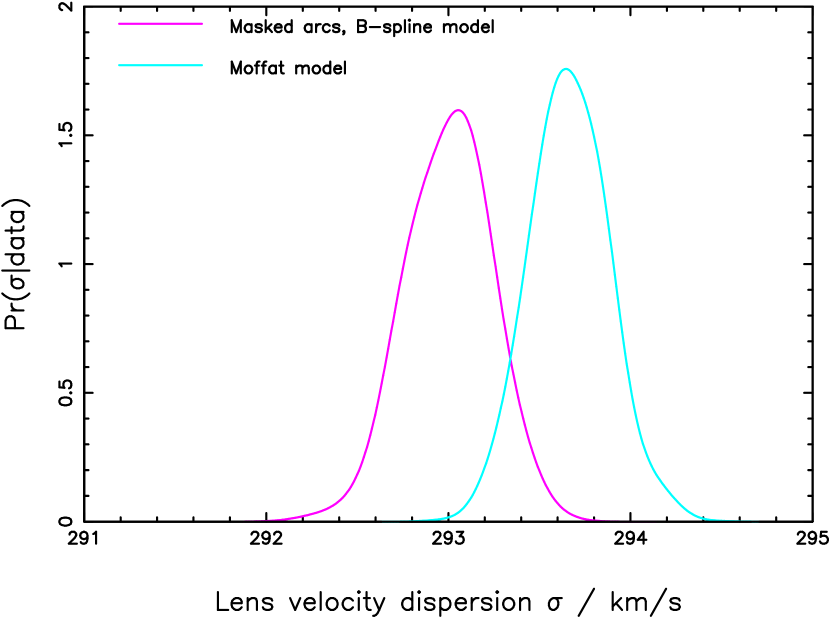
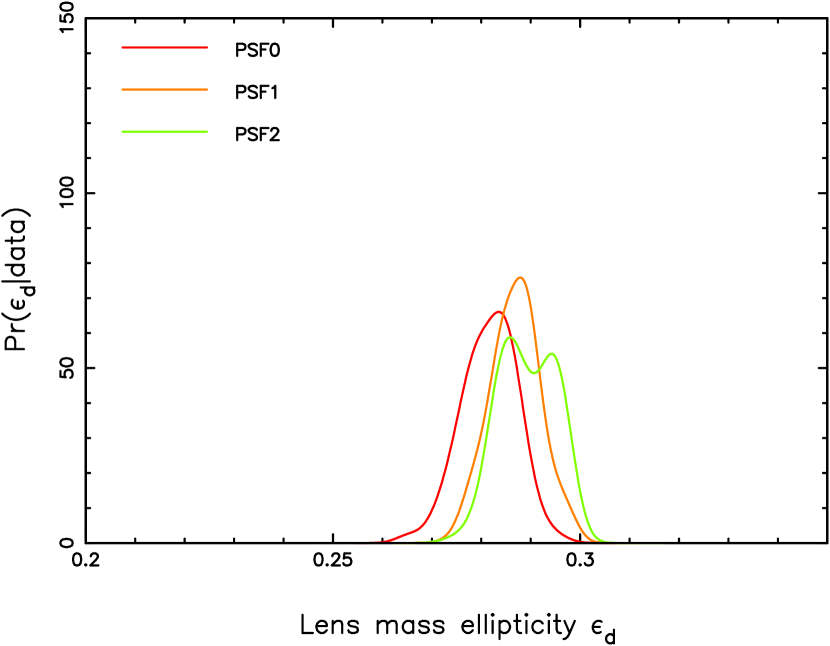
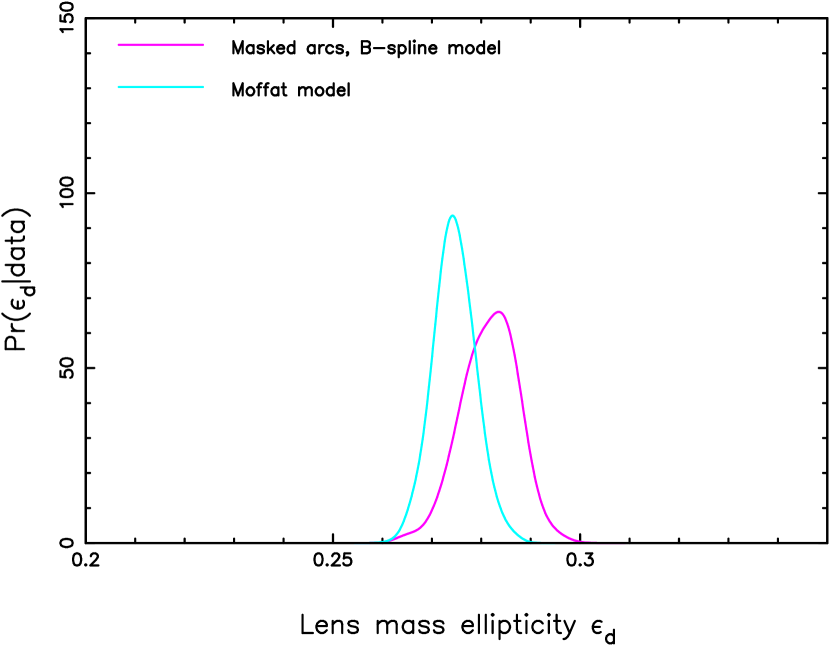
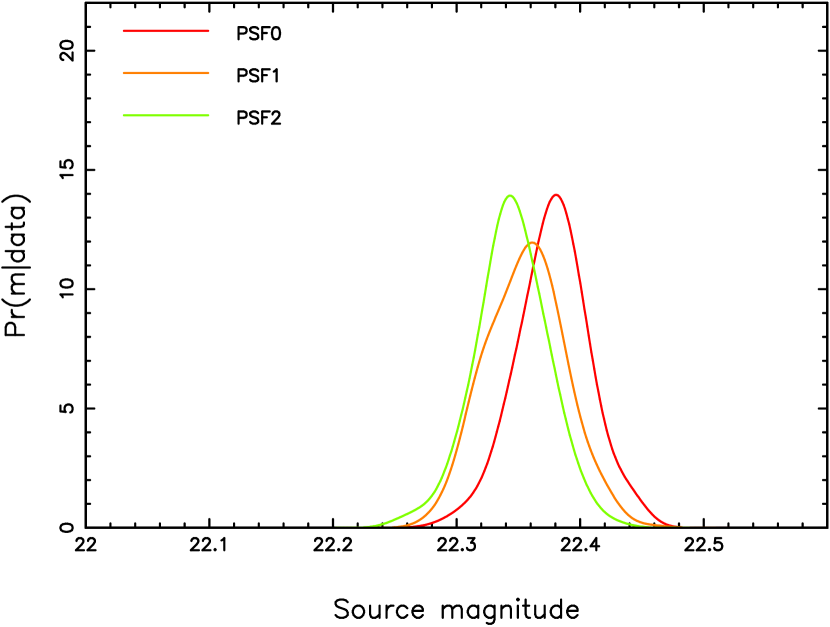
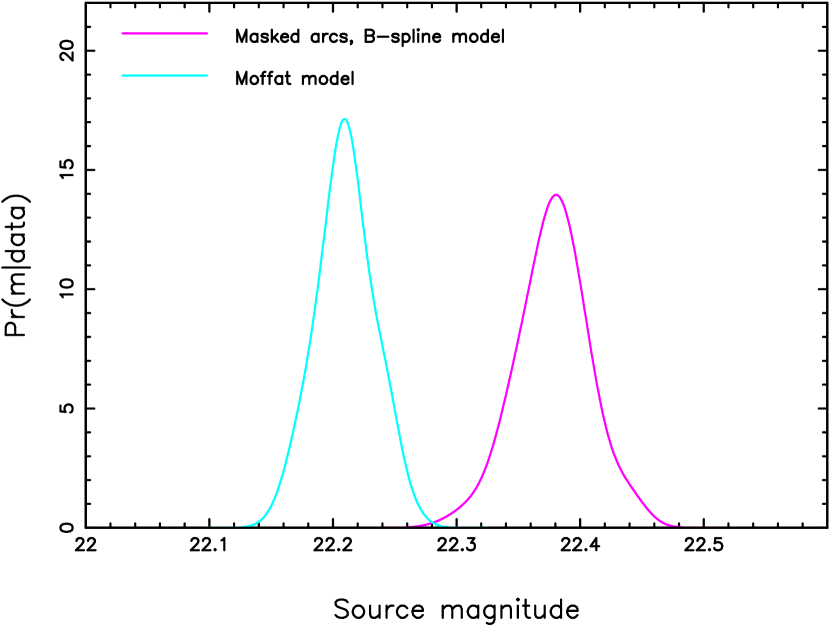
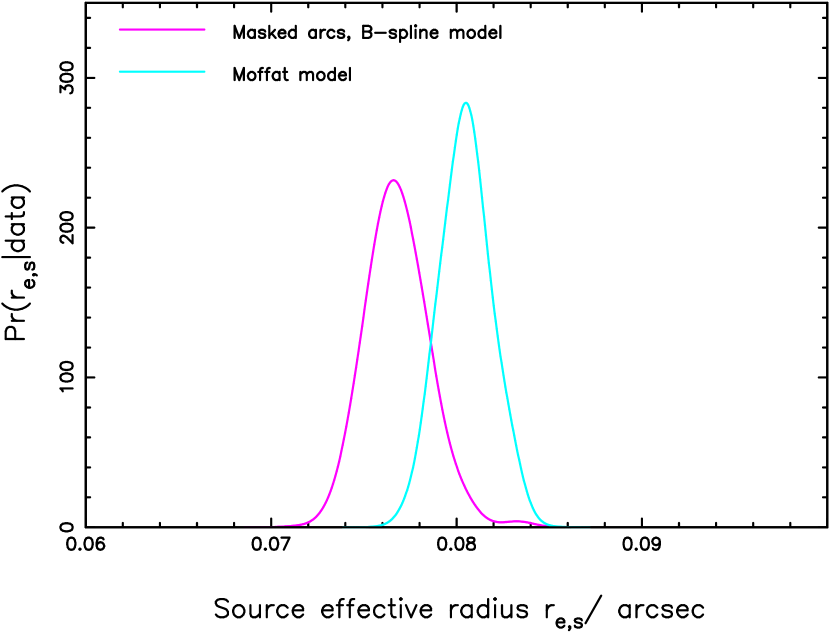
To marginalize over the range of PSF models one would use the relative evidence values to weight the different posterior PDFs (as shown in equation 5); however, since the evidence ratios in the top half of Table 2 are typically significantly different from unity we approximate this procedure by simply selecting the PSF model with the highest evidence. For the rest of this paper, we use the optimal PSF models for each dataset (from the maximum evidence values given in Table 2), and assert the SExtractor detected object mask subtraction scheme sub : the alternative msub distributions given in Figure 4 (and those for the other model parameters) provide estimates of the systematic errors we expect for each parameter. We now compare parameter estimates in the four different filters to compute the properties of the lens and the source.
6.1. Lens properties
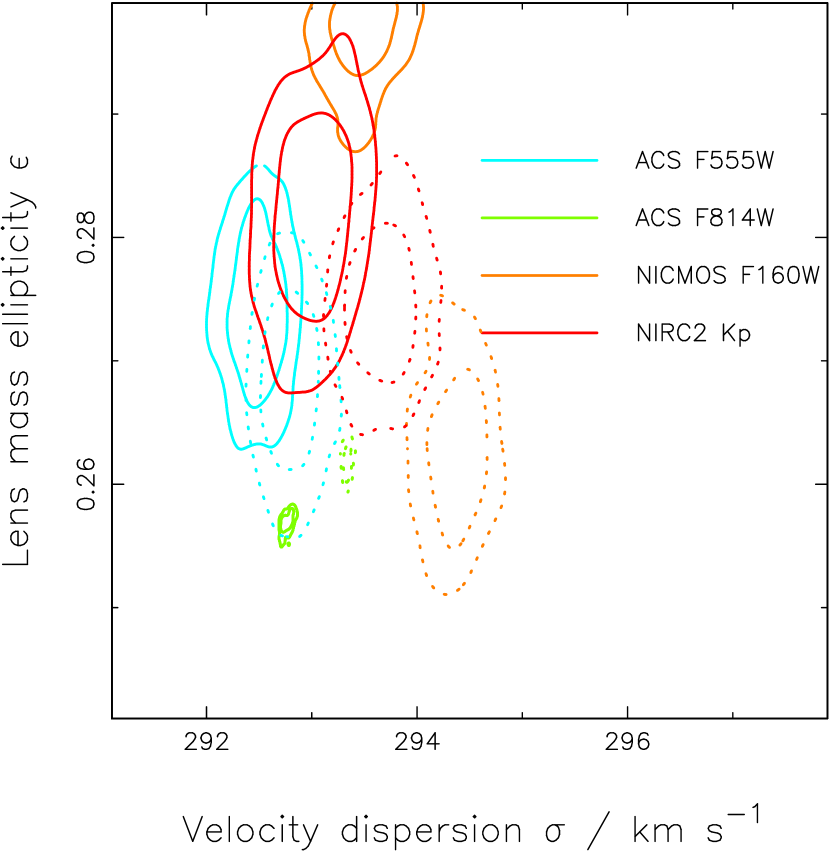
Figure 4 shows the inferred SIE velocity dispersion and mass distribution ellipticity for the SDSSJ0737+3216 lens. These parameters (along with the mass orientation, not shown) agree reasonably well across the filters, as they should given the achromaticity of the lensing effect. The largest discrepancies come from the deeper HST ACS F814W image. The likelihood function for this data is steeper, making it both harder for an MCMC sampler to explore the parameter space, and for a simple model to provide a good fit. In this case the inferred parameter uncertainties should be accepted with caution. Still, the inferred SIE velocity dispersion is in good agreement with that found by Koopmans et al. (2006) from their shallower HST/ACS snapshot data.
We note that an offset of km/s in the velocity dispersion is equivalent to one of 3.4 milliarcsec in the Einstein radius, a fractional error of . We assume that the reported image platescales are known to better than this, but this may not be the case. The truncation of the posterior pdf for lens ellipticity is a direct result of our assumption of a prior on this parameter that was uniform between 0.0 and 0.3. The lack of strong degeneracy between ellipticity and any other parameter indicates that this truncation is not a problem in this case – but it serves as a warning for future analyses.
7. Source properties

Having calibrated the optics of our cosmic telescope we turn our attention to the target of the observation: the lensed source at redshift . Figure 5 shows the multi-color reconstruction of this object, which shows the presence of a red, compact core centered on a more extended blue light distribution. The ellipticity and orientation of the source are a good match with those found from shallower data by Koopmans et al. (2006). We note that the alignment of the different filters’ reconstructions is very good, and that qualitatively we seem to be recovering the large-scale stellar component rather than being dominated by any smaller-scale features.
7.1. Source photometry and morphology results
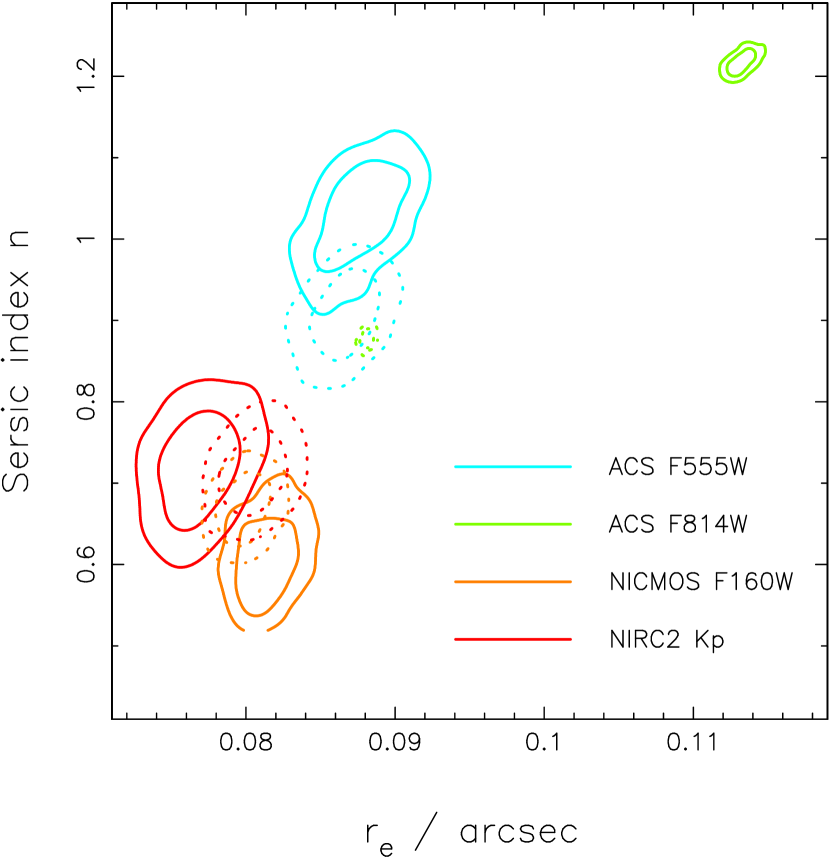
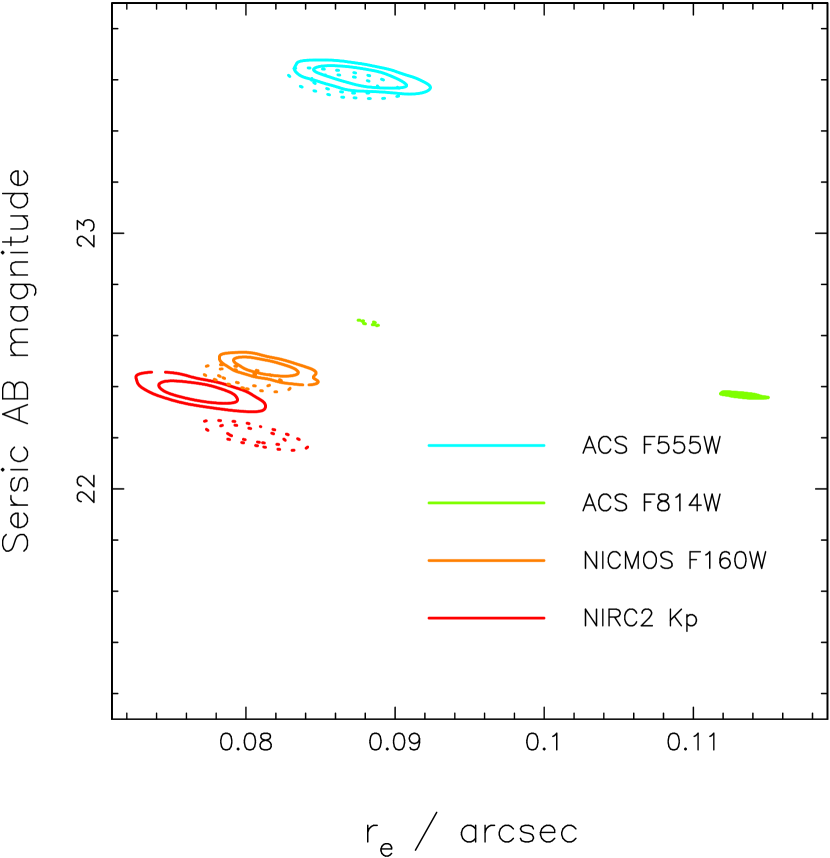
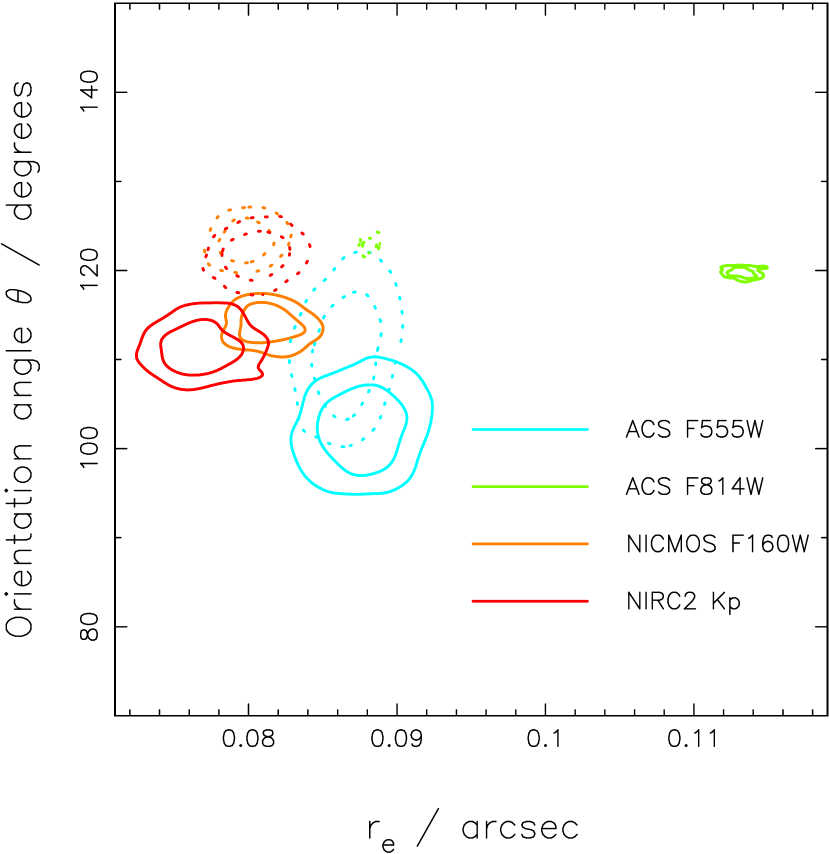
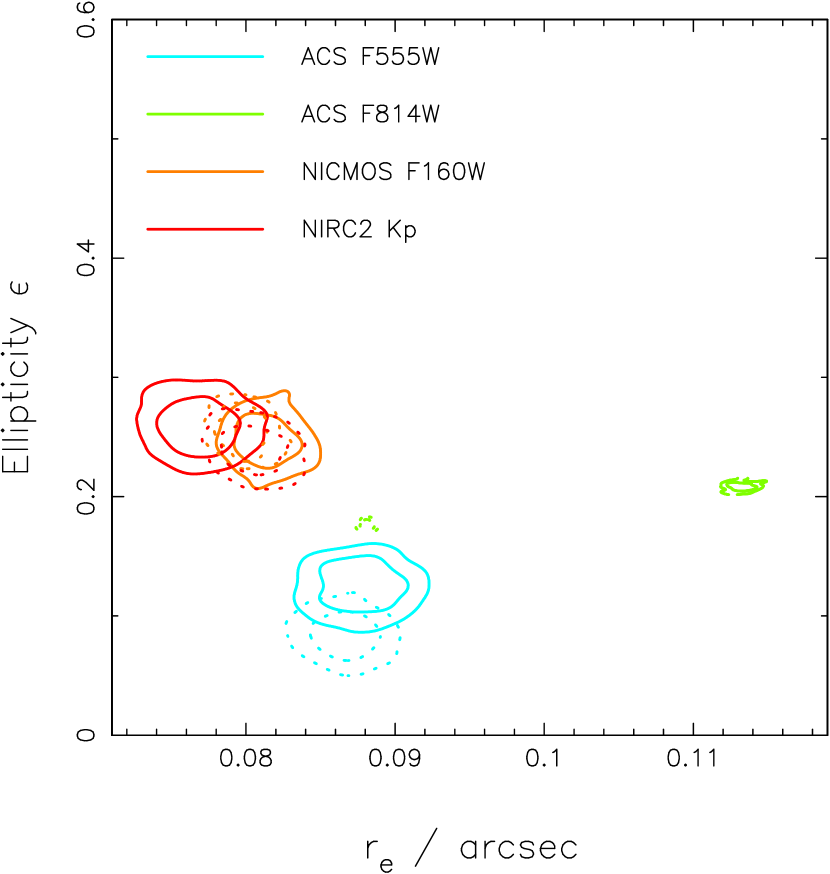
The top left-hand panel of Figure 6 shows the 2-d marginalized probability distributions for two source model morphology parameters, the effective radius and Sérsic index , given each of the datasets. We again note that the precision available for each parameter is much higher for the deep HST ACS F814W image, and very similar across the other three datasets. Likewise, the lower panels in this figure show the inferred source orientation and ellipticity, which are reasonably constant through the bandpasses.
We infer a small, compact source galaxy across the whole wavelength range. The differences in morphology between the filters are not large, but there is a suggestion that in the redder bands the profile is slightly more compact, approaching the Gaussian distribution ( ). However, the degeneracy between and can be clearly seen, warning us not to over-interpret the inferences: a robust conclusion is that the inferred Sérsic index is low in all filters. Likewise, the two different linestyle PDFs plotted also showing the effects of the different lens galaxy subtraction schemes on the inferred source morphology. In particular, the deep HST ACS F814W data can be seen, as expected, to be generally more systematics-dominated than the other filters’, with significant (if small) differences in inferred effective radius and magnitude between different analyses. It is in this filter that the sensitivity to the different model assumptions is highest, and the limitations of our simply-parameterized model are made most clear.
7.2. Spectral energy distribution and stellar mass of the source galaxy
Armed with photometry from HST ACS (F555W and F814W ), HST NICMOS (F160W ) and NIRC2+LGSAO (K’ ), we now reconstruct the spectral energy distribution (SED) of the source. To account for uncertainty in the zero points and filter transmission curves, we assert statistical errors of 0.1 and 0.05 respectively and add these in quadrature to the statistical errors from the MCMC inferences.
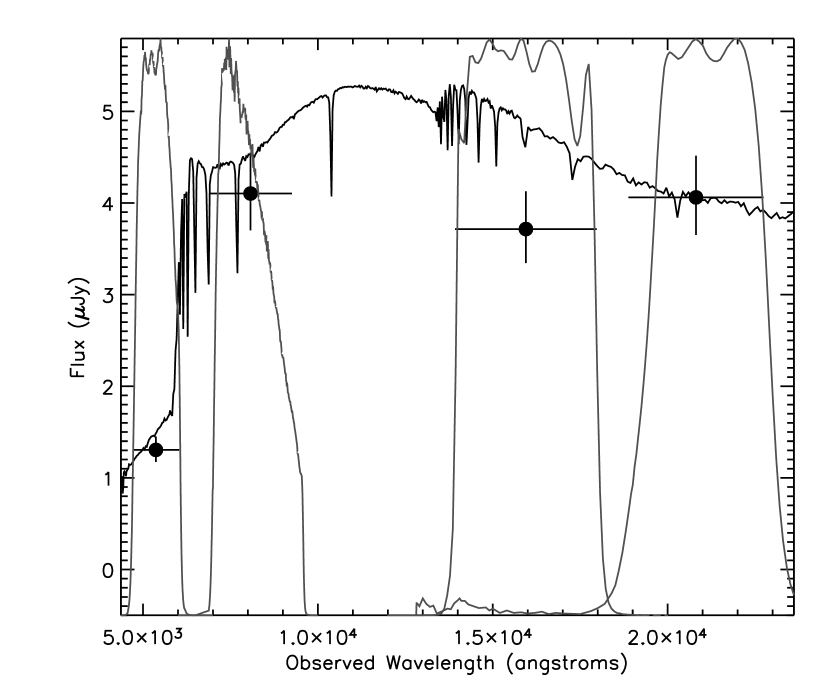
Given the known redshift, we estimate the stellar mass by fitting the observed colors to a variety of SED templates (Bundy et al. 2006). The best fit model is obtained for a exponential star-formation rate with short characteristic timescale Gyr and young age ( Gyr), and corresponds to a stellar mass of = ( ) assuming Chabrier IMF, where the error bar is obtained by marginalizing the posterior over the stellar populations’ parameters. In other words, the system appears to have undergone a very recent burst of star formation, consistent with its selection via emission lines. This inferred star formation history is consistent with the SED-fitting performed by Guzmán et al. (2003) on a sample of luminous compact blue galaxies taken from the sample of Phillips et al. (1997).
Figure 7 shows the fluxes (and uncertainties) used in the fit plotted as a function of wavelength, with the best-fitting galaxy template—normalized to the observed K’ luminosity—overlaid. For reference, the absolute AB magnitude in the F555W -band is . We note that choice of IMF is the single largest source of systematic uncertainty (0.2-0.3 dex, Bundy et al. 2006) in the absolute stellar mass. However, when comparing stellar masses with other surveys we must compute the same model-dependent masses. Both Shen et al. (2003) and Barden et al. (2005) assume a Kroupa IMF, which results in stellar masses different from those assuming a Chabrier IMF by just 0.05 dex.
Likewise, we note that the stellar masses of less well-resolved galaxies in the literature typically also come from a global modeling of the object photometry (rather than a joint morphological and photometric analysis), justifying our approach to modelling the SED here. The Sérsic indices measured in section 7.1 are also sufficiently similar to justify the assumption of a single stellar population when estimating the stellar mass. We do not, in any case, expect the systematic error in the absolute stellar mass introduced to be greater than that from the IMF uncertainty. Furthermore, the consistency between the filters (all the way out to the K’ -band ) suggests that we are not dominated by small-scale star-forming regions in either the mass or size measurements.
8. Systematic errors
Photometry with AO imaging has the reputation of being at best difficult and at worst inaccurate. In this work we have looked carefully at several systematic errors associated with photometric and morphological of small extended objects viewed through galaxy-scale gravitational lenses, and now discuss these errors in a little more detail.
8.1. Model-dependent LGSAO photometry
The basic problem of measuring the total flux of an object, and the radius within which half of this total flux is contained, is partially solved by the assumption of a sensible model intensity distribution, allowing the light profile to be extrapolated beyond the data region. This solution is of course only as good as the model assumption, but at least leads to a set of well-defined quantities (e.g. “Sérsic magnitudes”). The underlying assumption is that high resolution imaging data provides enough constraints on the inner part of the profile that the extrapolated quantities can be accurately inferred.
One could argue that imposing a model in this way “biases” the results – distant galaxies are not necessarily expected to have pure Sérsic profiles. The system studied here at least appears to be simple, in that a single image component provides a reasonable fit in the infra-red, but there are suggestions in the bluer filters that the galaxy has a more complex morphology. This is perhaps to be expected given that this system was selected for its emission line spectrum, indicating ongoing star-formation and consequent likely clumpy morphology. However, if we are to quantify galaxies like the source behind SDSSJ0737+3216 in a way that permits comparison with other datasets and/or with a physical theory then the Sérsic profile appears to be the most natural choice, given its widespread use. The galaxy itself may not be well-fit by a Sérsic profile – but that does not mean that knowing its Sérsic parameters is not useful. The fitting of a lensed Sérsic profile is an appropriate way of measuring the average properties of the source light distribution, even in the blue filters. We note that the residual features in the bluer images are smaller still than the inferred Sérsic component, suggesting that we are measuring the principal stellar structure, and not a smaller, brighter, peripheral star-forming region, even at the shorter wavelengths.
8.2. PSF model selection and truncation
Assuming a model galaxy profile, and having 4 predictable copies of the same image, means that the PSF structure can be inferred concurrently with the source itself. Indeed, we have shown that PSF selection via the Bayesian evidence is possible: there is information in all the imaging data analyzed on the most appropriate PSF. We noted that, since the number of model parameters is unchanged between the different PSF models, the evidence is being dominated by the goodness of fit. However, the PSF suitability is related to the choice of source galaxy model and its parameter prior PDFs. This leads to the evidence being a sharper tool for PSF selection than the reduced chi-squared values, as can be seen in Table 2. In the case studied here, the PSF selection is interesting but not critical, as we clearly see that there are larger systematic effects at play.
Our treatment of the PSF with a small cutout star image is cause for more concern. Our (internally-normalized) PSF postage stamps, at 16 pixels width, only span 1.5 times the seeing disk FWHM ( arcsec ). To quantify the effect of this on the inferred model parameters, we simulated NIRC2+LGSAO observations of a gravitational lens having the same properties as SDSSJ0737+3216 (i.e. the parameter values found in sections 6.1 and 7.1). For the PSF we used a concentric sum of two Gaussians (representing the seeing disk wings and the Airy pattern core, with relative weights given by the Strehl ratio), following Law et al. (2006). The simulated data were generated with a large 72-pixel PSF cutout, while the MCMC sampler was provided with a posterior PDF assuming a small, renormalized 16-pixel PSF cutout. Investigating input Strehl ratios of 0.2, 0.3, and 0.4 (and assuming FWHM values of 0.10 and 0.40 arcsec for the K’ -band Keck diffraction pattern core and seeing disk respectively), we found that from a choice of model double Gaussian PSFs with the true seeing and core size and Strehl ratios of 0.2, 0.3, and 0.4 the evidence selected the correct (input) PSF each time, by about the same margin as seen with the real data. Using the maximal evidence PSF, we then found that the magnitude of the source was underestimated by 0.03 mags comparable to the statistical uncertainty. This is significantly smaller than the other estimated errors (that were used in the stellar mass calculation), but comparable to the error introduced by the lens galaxy subtraction. The effective radius was found to be over-estimated by 0.005 arcsec, a small but statistically significant increase; the Sérsic index was also overestimated by 0.1 or so. These shifts, while contributing to the overall systematic error budget, do not affect our conclusion about the unusual size of this source, which we discuss below.
We conclude that LGSAO photometry of faint extra-galactic extended sources at the 0.05 magnitude accuracy level (not including zero point and filter curve calibration) is perfectly possible using techniques such as those used in this work. However, we caution that the conditions of observations were exceptionally good, both in terms of seeing and stability of the PSF. This is supported by the fact that the specially-observed star PSF0 gave the best results, and by the consistency between the results obtained with this star and with the serendipitous stars observed in the object field itself. This consistency is not guaranteed in general, since the PSF can be expected to change significantly on timescales like the time interval between our observations of the lens field and of PSF0 (J. Graham, priv. comm.), and that spatial variations of the PSF can be significant (Steinbring et al, in prep.). However, it bodes well for the future that our results would be essentially unchanged had we only used the stars in the field of the target.
8.3. Overall systematic error budget
In sections 6.1 and 7.1 we identified the lens galaxy subtraction as a serious issue leading to the dominant systematic error when inferring the model parameters from well-calibrated data and assuming an isothermal density profile lens. A better approach would be to fit the lens and source simultaneously, making use of the quadruple-imaging to constrain the two intensity distributions with minimal degeneracy. From the Moffat profile fit residuals (scheme msub , Table 2) we see that such a procedure would require a flexible model (such as the B-splines used here) for the lens galaxy light, in order to get a good fit. This is not computationally feasible within the current framework, but should be possible in the semi-linear formalisms of Warren & Dye (2003) and others.
Comparison of the parameter estimates between subtraction schemes does give a quantitative feel for the systematic errors introduced by the lens galaxy subtraction. These are compared with the other errors identified in this work in Table 3. We see that even the largest image analysis systematic error, that due to the lens galaxy subtraction, is still smaller than that introduced by the assumption of an isothermal density profile lens mass distribution. Conservatively combining all the systematic errors by simple addition, the resultant systematic errors on the size and stellar mass are approximately kpc and ; these may be compared with the statistical uncertainties shown in Figure 7.
For the Sérsic index we read off the systematic errors from Figure 6 as 0.2 for the optical filters, and 0.1 for the infra-red filters, and assume that this is unaffected by the lens density profile (which simply changes the magnification of the source).
| Description | |||
|---|---|---|---|
| (kpc) | (dex) | ||
| Incorrect stellar PSF model | 0.01 | 0.01 | 0.005 |
| Truncated PSF image | 0.005 | 0.03 | 0.015 |
| Lens galaxy subtraction | 0.01 | 0.10 | 0.04 |
| Stellar mass IMF choice | N/A | N/A | 0.05 |
| Lens model density slope | 0.07 | 0.26 | 0.11 |
| Total (approximate) | 0.10 | 0.40 | 0.17 |
9. Discussion: the size-mass relation at
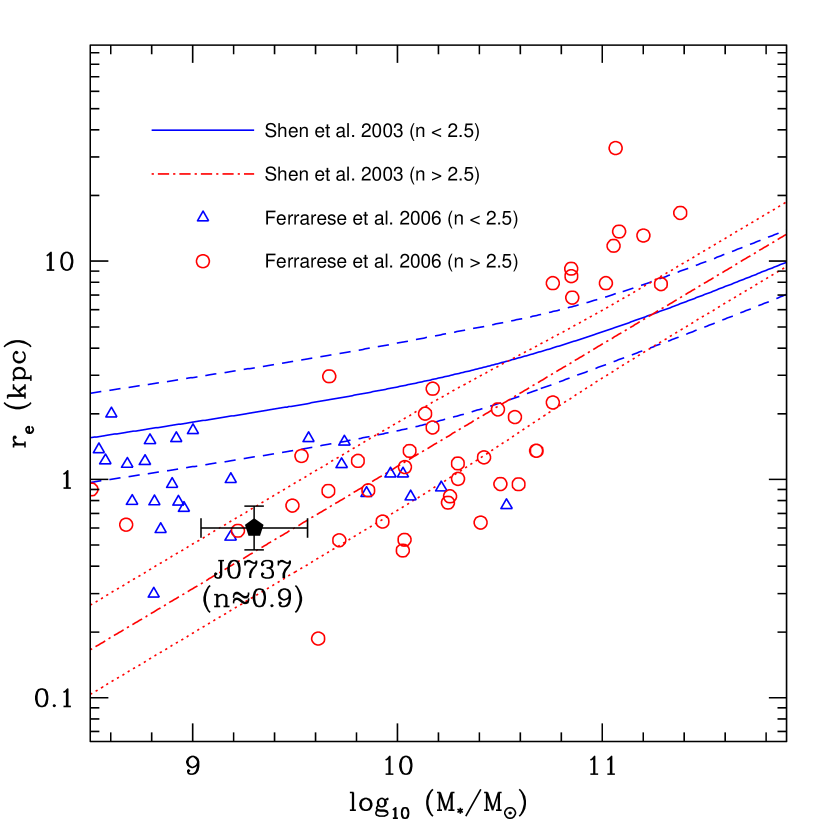
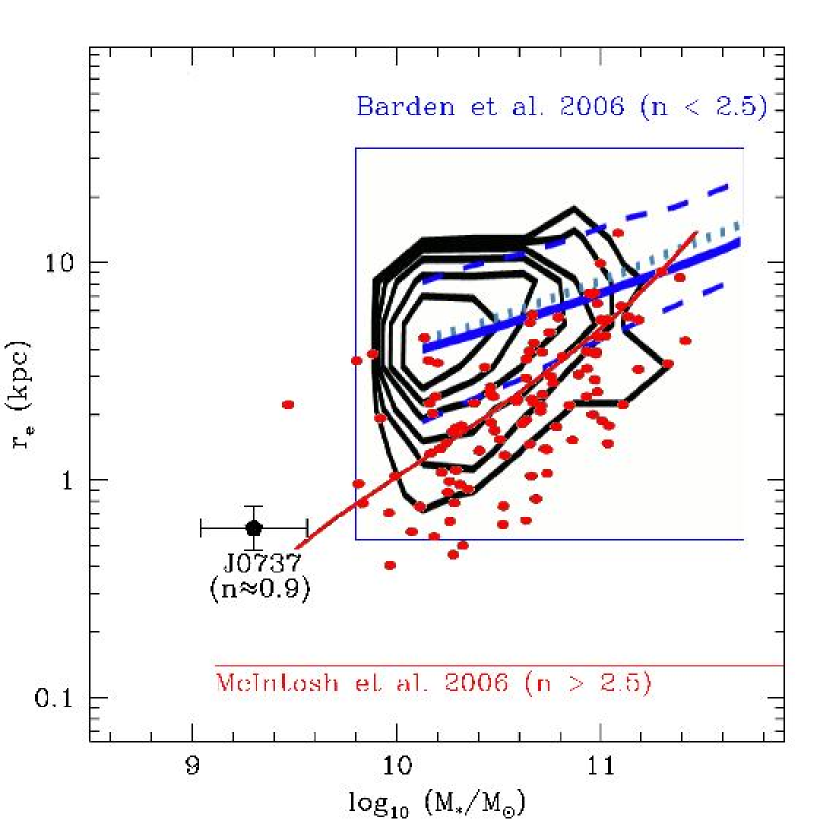
From the analysis presented above we obtain the final result that = ( ), = ( ) and = () for the size, stellar mass, and Sérsic index of the SDSSJ0737+3216 source galaxy, where these numbers are global estimates based on all the filters’ data: the plots in Figure 6, and the systematic error analysis of the previous section indicate that the small differences between the different bands are not significant. 444We note that the SDSS size estimates were made in the r-band, such that the effective rest-frame wavelength is about 5700 angstroms. At redshift 0.6, this falls in the i-band, as used (approximately) in GEMS. Our corresponding F814W -band measurement is the one most affected by systematic errors – however, the global size estimate we use can be seen (Figure 6) to be representative of the size in this filter. We overlay these values on the local relation for “disk” galaxies (i.e. those with Sérsic index ) derived from SDSS by Shen et al. (2003), and the corresponding relation derived from GEMS by Barden et al. (2005) (and interpreted by Somerville et al. 2006) in Figure 8. For its stellar mass (which is a factor of 5 smaller than the GEMS completeness limit), the source behind SDSSJ0737+3216 appears to be about a factor of smaller than the average local galaxy (Shen et al. 2003), putting it approximately 3- below the local size-mass relation for galaxies with low Sérsic index.
The distant GEMS data do not extend to small enough masses to allow for a direct comparison with our measurement. However, bringing our point into agreement with the typical galaxy from GEMS would require a somewhat marked flattening of the size-magnitude relation at masses lower than since redshift 0.6, which appears unlikely given the very modest evolution observed at masses above : Barden et al. (2005) find a constant size-mass relation; Trujillo et al. (2006) measure for disk-like galaxies, predicting that the mean object at is only about times the size of the mean local disk-like galaxy. Even comparing with the incomplete GEMS data at (Barden et al. 2005, Figure 10) we see that our object is unusually small. Thus we conclude that the source galaxy behind SDSSJ0737+3216 is, relative to existing surveys, somewhat extreme in terms of mass and size, if it is indeed a disk galaxy.
Such compact galaxies have, however, been well-studied. Koo et al. (1994) identified a sample of compact, narrow emission-line galaxies in the Hubble Deep field at redshift , having luminosities () and sizes ( kpc). These objects comprise a small fraction of the ubiquitous faint blue galaxies reviewed by Ellis (1997). Extending the sample to intermediate redshift and focusing on the higher luminosity members (), Koo et al. (1995) found using high resolution spectroscopy that these objects appear more similar to local HII galaxies (dwarf galaxies showing violent star formation activity), and suggested that these systems will evolve into today’s dwarf spheroids. This conclusion was also reached by Phillips et al. (1997) in an extension of that work, although they note that the number densities are such that not all compact galaxies at intermediate redshift can be progenitors of spheroids. However, Hammer et al. (2001) argue that the observed narrow emission line widths may not represent the depth of the whole galaxy potential, and instead argue on the basis of the stellar masses they infer from their spectra and photometry that the more luminous, compact galaxies are more likely the progenitors of the bulges of present-day massive spiral galaxies. At the stellar mass scale inferred in this work (), the source behind SDSSJ0737+3216 appears closer to the low-luminosity end of the samples of Koo et al. (1995) and Phillips et al. (1997), but is almost a factor of two smaller than the limiting size of their sample () and is fully resolved. Indeed, our physical resolution is comparable to that reachable for galaxies in the Virgo cluster with ground-based seeing; we find that the SDSSJ0737+3216 source is comparable to the smallest dwarf ellipticals seen in the Virgo cluster (Capaccioli et al. 1992; Ferrarese et al. 2006, Figure 8), and is typical of the objects in the smallest size bin of the Sérsic -selected “elliptical” galaxies in the GEMS survey (McIntosh et al. 2005).
Can we interpret our super-resolved source morphology as being that of a forming spheroid? The low Sérsic index measured would suggest not, placing it firmly in the disk-like samples of the literature. However, at low masses there is evidence that elliptical galaxies can have Sérsic indices of one and below (e.g. Trujillo et al. 2004). The consistency in morphology between the observation filters is indicative of a regular spheroid (although the residual structure in the bluer filters would argue against a highly-evolved, smooth stellar distribution. Perhaps the strongest indicator is the position of the source in the size-mass plane. In Figure 8 we show the local, and , size-mass relations for “elliptical” () galaxies from SDSS and GEMS (Shen et al. 2003; McIntosh et al. 2005), and can see that the source behind SDSSJ0737+3216 sits rather more comfortably with these relations, albeit at significantly (a factor of 2 – 4) lower mass.
Our results demonstrate that, using a gravitational telescope to super-resolve the source, it is possible to study in considerable detail atypical sources that may well be missed or excluded by non-lensed surveys. In fact, size-mass studies at redshift 0.5 and above have necessarily focused on the high luminosity end, and have inevitably included a size cut to remove stars from the catalogs, before a further completeness cut that discards the least massive galaxies. It is not clear just how many small galaxies are being overlooked in this way. The higher resolution afforded by our gravitational telescope allows us to study the structure and surface brightness profiles of the compact blue galaxies in much greater detail and with higher precision, and to extend the investigation to smaller sizes still. For comparison, the total magnification provided by SDSSJ0737+3216 is , indicating an angular resolution in the source plane of approximately 0.01 arcsec. The accuracy we obtain on our size measurement indicates that we are still some way from the limit imposed by the resolution of our optics. Indeed we note that this accuracy can be improved by a further factor of 2 by simply using a more flexible lens model.
Having demonstrated the power of this method, a larger sample of objects is needed in order to infer statistically meaningful conclusions about the low mass/size tail of the mass-size relation. As clearly discussed by Barden et al. (2005), to achieve this goal it is crucial to understand the selection function of the objects being used in the size-mass relation study. Due to a form of the so-called magnification bias, gravitational lens surveys such as SLACS tend to favor compact sources. SLACS lenses were selected from (spectroscopic) observations where the system is essentially unresolved, meaning that lens systems with high total magnification are preferentially detected. This bias is strongest when the source is point-like, i.e. much smaller than the size of the fiber and the Einstein Radius ( arcsec). Thus, it is not so surprising that the first source to be studied is compact. This realization implies that when performing statistical analyses of the size-mass relation of lensed galaxies it will be necessary to use Monte Carlo simulations to understand and quantify the selection function of multiple image systems. Applying our methodology to other lens systems, will, once the selection effects are quantified, extend this study to join the existing statistical analyses of higher-mass disks, to probe the small size (i.e. low angular momentum) regime.
The SLACS lenses are well-suited to this task: the efficiency of the survey is such that some 100 high-magnification systems like SDSSJ0737+3216 are expected to be found by the end of the program. (The number of systems currently confirmed using high resolution imaging is already close to this figure.) Extending the study to sources at even higher redshifts requires more lenses to be discovered at greater distances: the SL2S survey (Cabanac et al. 2007) is expected to discover suitable systems, with sources at redshifts of 1.0 and higher. However, the detection of these systems (via a ground-based imaging survey in the - and -bands) will lead to different selection effects than those present in the SLACS survey, and will again require Monte Carlo simulations in order to understand them.
The different identification schemes of the SLACS and SL2S survey introduce also a different selection effect in terms of stellar population, which will have to be modeled and taken into account when interpreting the results. SLACS sources are emission line selected and will therefore be representative of actively star-forming galaxies, directly comparable with galaxies selected in narrow band surveys. SL2S sources are continuum-selected and contain a mix of actively star-forming, post-starburst and quiescent stellar populations, directly comparable with the galaxy population studied by wide field HST surveys in similar broad bandpasses.
An additional implication of the lensing selection effect is that the magnification bias in some sense increases the power of a galaxy survey, by picking out the smallest objects and then making them measurable. With current technology, gravitational telescopes are the only way of accurately measuring such tiny objects.
10. Conclusions
We find that high quality images from NIRC2+LGSAO are capable of providing very similar precision on simple lens and source model parameters to typical datasets from HST ACS and HST NICMOS . The data themselves contain information about the most appropriate PSF model to use, to the extent that a set of nearby unsaturated stars can be fruitfully compared using suitable statistics that are sensitive to the goodness-of-fit. We estimate that even for the LGSAO imaging this way of modeling the PSF allows a photometric precision of 0.05 mag. However, the calibration of isothermal However, the calibration of isothermal galaxy-scale gravitational lenses as cosmic telescopes is very likely limited by the subtraction of the lens galaxy light. We estimate that this procedure introduces up to 0.1 magnitudes of systematic error into the source galaxy photometry. However, this is still smaller than the error introduced by the assumption of an isothermal density profile for the lens itself.
With this in mind we draw the following conclusions about the source behind SDSSJ0737+3216 :
-
•
Our photometry is robust enough to permit a reconstruction of the SED, and we find a stellar mass of ( ). This is a factor of 5 smaller than the completeness limit of the GEMS disk galaxy analysis of Barden et al. (2005), and also smaller than the least massive spheroid at this redshift studied by (McIntosh et al. 2005).
-
•
The Sérsic profile parameters of the source can be measured to high accuracy. We find an effective radius of ( ) ( arcsec with % accuracy), and a Sérsic index of () in the F814W -band ( rest-frame B), and that these values change little over the rest-frame optical range.
-
•
This very small galaxy lies approximately 3-sigma below the local size-mass relation for disks. However, it shares the properties of the smallest of the compact narrow emission line galaxies of Koo et al. (1994), and, despite its low Sérsic index, is more typical of the dwarf early-type galaxies observed in the Virgo cluster (Ferrarese et al. 2006) and the “elliptical” galaxies studied by McIntosh et al. (2005) at high redshift.
While the planned statistical analysis of a large sample of lensed galaxies will rely on the detailed understanding of the selection function, it is clear that the magnifying effect of gravitational lenses allows us to extend current size-mass studies to smaller sizes and lower masses than would otherwise be available, posing fresh challenges to models of galaxy formation and evolution.
References
- Barden et al. (2005) Barden, M., Rix, H.-W., Somerville, R. S., Bell, E. F., Häußler, B., Peng, C. Y., Borch, A., Beckwith, S. V. W., Caldwell, J. A. R., Heymans, C., Jahnke, K., Jogee, S., McIntosh, D. H., Meisenheimer, K., Sánchez, S. F., Wisotzki, L., & Wolf, C. 2005, ApJ, 635, 959
- Barnabe’ & Koopmans (2007) Barnabe’, M., & Koopmans, L. V. E. 2007, ArXiv Astrophysics e-prints
- Bolton et al. (2006) Bolton, A. S., Burles, S., Koopmans, L. V. E., Treu, T., & Moustakas, L. A. 2006, ApJ, 638, 703
- Bolton et al. (2007) Bolton, A. S., Burles, S., Treu, T., Koopmans, L. V. E., & Moustakas, L. A. 2007, ArXiv Astrophysics e-prints
- Brewer & Lewis (2006) Brewer, B. J., & Lewis, G. F. 2006, ApJ, 637, 608
- Bundy et al. (2006) Bundy, K., Ellis, R. S., Conselice, C. J., Taylor, J. E., Cooper, M. C., Willmer, C. N. A., Weiner, B. J., Coil, A. L., Noeske, K. G., & Eisenhardt, P. R. M. 2006, ApJ, 651, 120
- Cabanac et al. (2007) Cabanac, R. A., Alard, C., Dantel-Fort, M., Fort, B., Gavazzi, R., Gomez, P., Kneib, J. P., Le Fèvre, O., Mellier, Y., Pello, R., Soucail, G., Sygnet, J. F., & Valls-Gabaud, D. 2007, A&A, 461, 813
- Capaccioli et al. (1992) Capaccioli, M., Caon, N., & D’Onofrio, M. 1992, MNRAS, 259, 323
- Casertano et al. (2000) Casertano, S., de Mello, D., Dickinson, M., Ferguson, H. C., Fruchter, A. S., Gonzalez-Lopezlira, R. A., Heyer, I., Hook, R. N., Levay, Z., Lucas, R. A., Mack, J., Makidon, R. B., Mutchler, M., Smith, T. E., Stiavelli, M., Wiggs, M. S., & Williams, R. E. 2000, AJ, 120, 2747
- Driver et al. (2005) Driver, S. P., Liske, J., Cross, N. J. G., De Propris, R., & Allen, P. D. 2005, MNRAS, 360, 81
- Dutton et al. (2007) Dutton, A. A., van den Bosch, F. C., Dekel, A., & Courteau, S. 2007, ApJ, 654, 27
- Dye & Warren (2005) Dye, S., & Warren, S. J. 2005, ApJ, 623, 31
- Ellis (1997) Ellis, R. S. 1997, ARA&A, 35, 389
- Evans & Wilkinson (1998) Evans, N. W., & Wilkinson, M. I. 1998, MNRAS, 296, 800
- Evans & Witt (2001) Evans, N. W., & Witt, H. J. 2001, MNRAS, 327, 1260
- Fall & Efstathiou (1980) Fall, S. M., & Efstathiou, G. 1980, MNRAS, 193, 189
- Ferguson et al. (2004) Ferguson, H. C., Dickinson, M., Giavalisco, M., Kretchmer, C., Ravindranath, S., Idzi, R., Taylor, E., Conselice, C. J., Fall, S. M., Gardner, J. P., Livio, M., Madau, P., Moustakas, L. A., Papovich, C. M., Somerville, R. S., Spinrad, H., & Stern, D. 2004, ApJ, 600, L107
- Ferrarese et al. (2006) Ferrarese, L., Côté, P., Jordán, A., Peng, E. W., Blakeslee, J. P., Piatek, S., Mei, S., Merritt, D., Milosavljević, M., Tonry, J. L., & West, M. J. 2006, ApJS, 164, 334
- Fruchter & Hook (2002) Fruchter, A. S., & Hook, R. N. 2002, PASP, 114, 144
- Gavazzi et al. (2007) Gavazzi, R., Treu, T., Rhodes, J. D., Koopmans, L. V., Bolton, A. S., Burles, S., Massey, R., & Moustakas, L. A. 2007, ArXiv Astrophysics e-prints
- Guzmán et al. (2003) Guzmán, R., Östlin, G., Kunth, D., Bershady, M. A., Koo, D. C., & Pahre, M. A. 2003, ApJ, 586, L45
- Hammer et al. (2001) Hammer, F., Gruel, N., Thuan, T. X., Flores, H., & Infante, L. 2001, ApJ, 550, 570
- Knudson et al. (2001) Knudson, A., Ratnatunga, K. U., & Griffiths, R. E. 2001, AJ, 122, 103
- Koekemoer et al. (2002) Koekemoer, A. M., Fruchter, A. S., Hook, R. N., & Hack, W. 2002, 337
- Koo et al. (1994) Koo, D. C., Bershady, M. A., Wirth, G. D., Stanford, S. A., & Majewski, S. R. 1994, ApJ, 427, L9
- Koo et al. (1995) Koo, D. C., Guzman, R., Faber, S. M., Illingworth, G. D., Bershady, M. A., Kron, R. G., & Takamiya, M. 1995, ApJ, 440, L49
- Koo & Kron (1988) Koo, D. C., & Kron, R. G. 1988, ApJ, 325, 92
- Koopmans (2005) Koopmans, L. V. E. 2005, MNRAS, 363, 1136
- Koopmans et al. (2006) Koopmans, L. V. E., Treu, T., Bolton, A. S., Burles, S., & Moustakas, L. A. 2006, ApJ, 649, 599
- Kormann et al. (1994) Kormann, R., Schneider, P., & Bartelmann, M. 1994, A&A, 284, 285
- Krist & Hook (1997) Krist, J. E., & Hook, R. N. 1997, 192
- Law et al. (2006) Law, D. R., Steidel, C. C., & Erb, D. K. 2006, AJ, 131, 70
- Limousin et al. (2006) Limousin, M., Richard, J., Jullo, E., Kneib, J. ., Fort, B., Soucail, G., Elíasdóttir, A., Natarajan, P., Ellis, R. S., Smail, I., Czoske, O., Smith, G. P., Hudelot, P., Bardeau, S., Ebeling, H., Egami, E., & Knudsen, K. K. 2006, ArXiv Astrophysics e-prints
- MacKay (2003) MacKay, D. J. C. 2003, Information Theory, Inference and Learning Algorithms (Cambridge: CUP)
- Marshall (2006) Marshall, P. 2006, MNRAS, 372, 1289
- McIntosh et al. (2005) McIntosh, D. H., Bell, E. F., Rix, H.-W., Wolf, C., Heymans, C., Peng, C. Y., Somerville, R. S., Barden, M., Beckwith, S. V. W., Borch, A., Caldwell, J. A. R., Häußler, B., Jahnke, K., Jogee, S., Meisenheimer, K., Sánchez, S. F., & Wisotzki, L. 2005, ApJ, 632, 191
- McKean et al. (2007) McKean, J. P., Koopmans, L. V. E., Flack, C. E., Fassnacht, C. D., Thompson, D., Matthews, K., Blandford, R. D., Readhead, A. C. S., & Soifer, B. T. 2007, MNRAS, 349
- Melbourne et al. (2006) Melbourne, J., Phillips, A. C., Harker, J., Novak, G., Koo, D. C., & Faber, S. M. 2006, ArXiv Astrophysics e-prints
- Melbourne et al. (2005) Melbourne, J., Wright, S. A., Barczys, M., Bouchez, A. H., Chin, J., van Dam, M. A., Hartman, S., Johansson, E., Koo, D. C., Lafon, R., Larkin, J., Le Mignant, D., Lotz, J., Max, C. E., Pennington, D. M., Stomski, P. J., Summers, D., & Wizinowich, P. L. 2005, ApJ, 625, L27
- Mo et al. (1998) Mo, H. J., Mao, S., & White, S. D. M. 1998, MNRAS, 295, 319
- Moustakas et al. (2006) Moustakas, L. A., Marshall, P. J., Newman, J. A., Coil, A. L., Cooper, M. C., Davis, M., Fassnacht, C. D., Guhathakurta, P., Hopkins, A., Koekemoer, A., Konidaris, N. P., Lotz, J. M., & Willmer, C. N. A. 2006, ArXiv Astrophysics e-prints
- Noeske et al. (2006) Noeske, K. G., Koo, D. C., Phillips, A. C., Willmer, C. N. A., Melbourne, J., Gil de Paz, A., & Papaderos, P. 2006, ApJ, 640, L143
- Odman et al. (2004) Odman, C. J., Hobson, M., Lasenby, A., & Melchiorri, A. 2004, International Journal of Modern Physics D, 13, 1661
- Phillips et al. (1997) Phillips, A. C., Guzman, R., Gallego, J., Koo, D. C., Lowenthal, J. D., Vogt, N. P., Faber, S. M., & Illingworth, G. D. 1997, ApJ, 489, 543
- Rawat et al. (2007) Rawat, A., Kembhavi, A. K., Hammer, F., Flores, H., & Barway, S. 2007, A&A, 469, 483
- Rusin & Kochanek (2005) Rusin, D., & Kochanek, C. S. 2005, ApJ, 623, 666
- Schneider (2006) Schneider, P. 2006, in Gravitational Lensing: Strong, Weak & Micro, ed. G. Meylan, P. Jetzer, & P. North, Lecture Notes of the 33rd Saas-Fee Advanced Course (Springer-Verlag: Berlin)
- Schneider et al. (1992) Schneider, P., Ehlers, J., & Falco, E. 1992, Gravitational Lenses (Berlin: Springer-Verlag)
- Shen et al. (2003) Shen, S., Mo, H. J., White, S. D. M., Blanton, M. R., Kauffmann, G., Voges, W., Brinkmann, J., & Csabai, I. 2003, MNRAS, 343, 978
- Skilling (2004) Skilling, J. 2004, BayeSys3 and MassInf, MaxEnt Data Consultants, http://www.maxent.co.uk
- Somerville et al. (2006) Somerville, R. S., Barden, M., Rix, H.-W., Bell, E. F., Borch, A., Beckwith, S. V. W., Caldwell, J. A. R., Haeussler, B., Heymans, C., Jahnke, K., Jogee, S., McIntosh, D. H., Meisenheimer, K., Peng, C. Y., Sanchez, S. F., Wisotzki, L., & Wolf, C. 2006, ArXiv Astrophysics e-prints
- Stringer & Benson (2007) Stringer, M. J., & Benson, A. J. 2007, ArXiv Astrophysics e-prints
- Suyu et al. (2006) Suyu, S. H., Marshall, P. J., Hobson, M. P., & Blandford, R. D. 2006, MNRAS, 371, 983
- Tonini et al. (2006) Tonini, C., Lapi, A., Shankar, F., & Salucci, P. 2006, ApJ, 638, L13
- Treu (2007) Treu, T. 2007, 235, 12
- Treu & Koopmans (2002) Treu, T., & Koopmans, L. V. E. 2002, ApJ, 575, 87
- Treu & Koopmans (2004) —. 2004, ApJ, 611, 739
- Trujillo et al. (2004) Trujillo, I., Burkert, A., & Bell, E. F. 2004, ApJ, 600, L39
- Trujillo et al. (2006) Trujillo, I., Förster Schreiber, N. M., Rudnick, G., Barden, M., Franx, M., Rix, H.-W., Caldwell, J. A. R., McIntosh, D. H., Toft, S., Häussler, B., Zirm, A., van Dokkum, P. G., Labbé, I., Moorwood, A., Röttgering, H., van der Wel, A., van der Werf, P., & van Starkenburg, L. 2006, ApJ, 650, 18
- Tully & Fisher (1977) Tully, R. B., & Fisher, J. R. 1977, A&A, 54, 661
- Warren & Dye (2003) Warren, S. J., & Dye, S. 2003, ApJ, 590, 673
Appendix A The Effect of the Lens Mass Density Slope on the Inferred Source Size and Magnitude
The local magnifying and distorting effect of a gravitational lens (seee.g. Schneider 2006) can be summarized by the (inverse) amplification matrix, :
| (A1) |
where and are two combinations of the spatial second derivatives of the projected gravitational potential – is proportional to the projected (surface) mass density – in a Cartesian coordinate system aligned with the radial and tangential directions. To first order, a source of width and length (also aligned with these axes) is distorted into an image of width and according to
| (A2) |
The component describes the radial stretching of the source, while the component describes the tangential stretching. The factor by which the solid angle subtended is increased due to the lensing effect is the magnification .
In terms of the Einstein radius (, the radius at which the magnification is formally infinite), the quantities and are given by
| (A3) |
for a simple spherically-symmetric lens with power-law density profile. for a simple, spherically-symmetric, power-law density profile lens (with logarithmic slope ). Two images form at positions that solve the lens equation,
| (A4) |
If the source position , as is the case when the images are highly magnified and are close to forming an Einstein ring, we find the images at
| (A5) |
The offset is well-constrained by the data, and so we proceed treating as a small () constant. At this point we note that the image positions and distortions do contain some information on the density slope , allowing this parameter to be fitted. What we are working towards here is a quantification of the effect of perturbing the slope away from the isothermal value ().
Evaluating and at the image postions, substituting into equation A1 and expanding to first order in we find that
| (A6) |
and that the inverse magnification is (also to first order) .
We can now use this result to estimate the uncertainty on the inferred source size (denoted by ) given by a systematic error in the model slope . We first note that the inferred source plane solid angle is given by
| (A7) |
where is the solid angle subtended by each image, and . A small change in the density slope away from a fiducial value of 1 gives rise to an error in source area according to
| (A8) | |||||
| (A9) |
From this, and the result above, we get that
| (A10) | |||||
| (A11) |
Since gravitational lensing conserves surface brightness, the inferred source flux is simply proportional to the inferred source solid angle : consequently, the error in the AB magnitude due to uncertainty in the density profile slope is .
Koopmans et al. (2006) give for the intrinsic spread of power-law indices, where the profile is constrained at two radii, the Einstein radius and the (smaller) effective radius. (Note that this small scatter was not appreciated by e.g. Knudson et al. (2001) in their analysis of magnification errors.) While the power law index they quote is not quite the local slope at the Einstein radius that we require here, the range of radii they consider brackets the Einstein radius of SDSSJ0737+3216 and therefore their value for provides an approximate quantification of the size of the density slope systematic error.