Interactive Visualization Package for 4D Lattice Field Theories
Abstract:
Recent interest in exploring local vacuum structure of QCD through the properties of the eigenmodes of the lattice Dirac operators rises again the challenge to visualize four-dimensional objects and structures which appear in lattice field theories. In spite of complex and powerful commercial visualization software packages on the market, there are reasons to develop Interactive Visualization Package (IVP). We believe that an apprehension of the complex structures is possible only through the interactive approach, with the user being able to manipulate data representations and slices through the lattice in real-time. Further insight should also be gained by an interactive parallel examination of different physical quantities, e.g. eigenmode density with topological charge or action densities. Finally, thanks to constantly falling hardware prices, IVP makes it possible to use almost any Linux PC as a visualization tool for research in lattice field theory.


1 Introduction
The momentum given to the exploration of local vacuum structure of QCD through the properties of the eigenmodes of the lattice Dirac operators by Horvath et al. [1] does not decrease. In recent work Gattringer, Ilgenfritz and their collaborators [2, 3, 4] use eigenmodes to compare filtering methods and properties of topological excitations. Anna Hasenfratz et al. [5] draw the attention to the role played by the localized eigenmodes. All these current investigations rose again the challenge to visualize and compare four-dimensional objects and structures which appear in lattice field theories.
There was a lot of effort to visualize topological objects on the lattice with the aim to study their interplay and to gain better insight into the cooling process. In the second half of the 1990s the Viennese group [6] paid special attention to the visualization of these phenomena. Visually very effective and well-known are the visualizations by Leinweber [7] and some of the most sophisticated visualization schemes were proposed by Gutbrod [8]. Although all of these visualization schemes use animation, none is really interactive in the immersive virtual reality sense which is implemented by Interactive Visualisation Package (IVP) as it is presented in this paper. IVP allows the user to move interactively through the data, to compare the data by showing data sets side by side or to identify peaks and possible other artifacts by using clipping planes and coloring effects.
2 Concept
It is a lasting challenge how to present a four-dimensional data set to be easily percepted by the human brain. Of course, one of the four dimensions can be treated as time and we are left with a problem to express the changes of a three-dimensional function by animation. But still, there is again no simple way to present values of the function defined in three-dimensional space on a two-dimensional computer screen because the interior points are inevitably screened. The usual way out is to render only some subsets of the points, e.g. isosurfaces, where the function has identical values.
A clean way to present every function value in every point is to render just two-dimensional slices with function values shown on the third axis. In the case of four-dimensional lattice that means to fix two of the lattice coordinates (e.g. and ) and to handle the values of the lattice function for every coordinate pair as height. Four such values (vertices) define quadrilaterals (four sided polygons) which are easy to plot and they define two-dimensional surface which presents the function behavior on the lattice slice under consideration. However, we are left with (for simplicity we assume a cubic lattice with size ) such surfaces and they often look rather similar to each other, which makes it tedious to examine them one by one. An obvious way to get some insight into the whole lattice volume is to plot such independent surfaces in a rectangular array. But, individual surfaces become too small and there is no real insight until separate plots are joined together to form a common virtual plane. Perspective projection of this plane enhanced by color and lighting effects can be rendered on a computer screen and by enabling interactive walking through this scenery we get a new essential quality: instead of a hardly imaginable four-dimensional world, we immerse in a landscape with mountains and valleys familiar to our eyes and everyday experience. In such a situation the superb abilities of human brain for orientation in space and pattern recognition can come to their full advantage. Now it is much easier to identify some characteristic shapes and to remember the position in the landscape (i.e. lattice) where such artifacts have been observed.
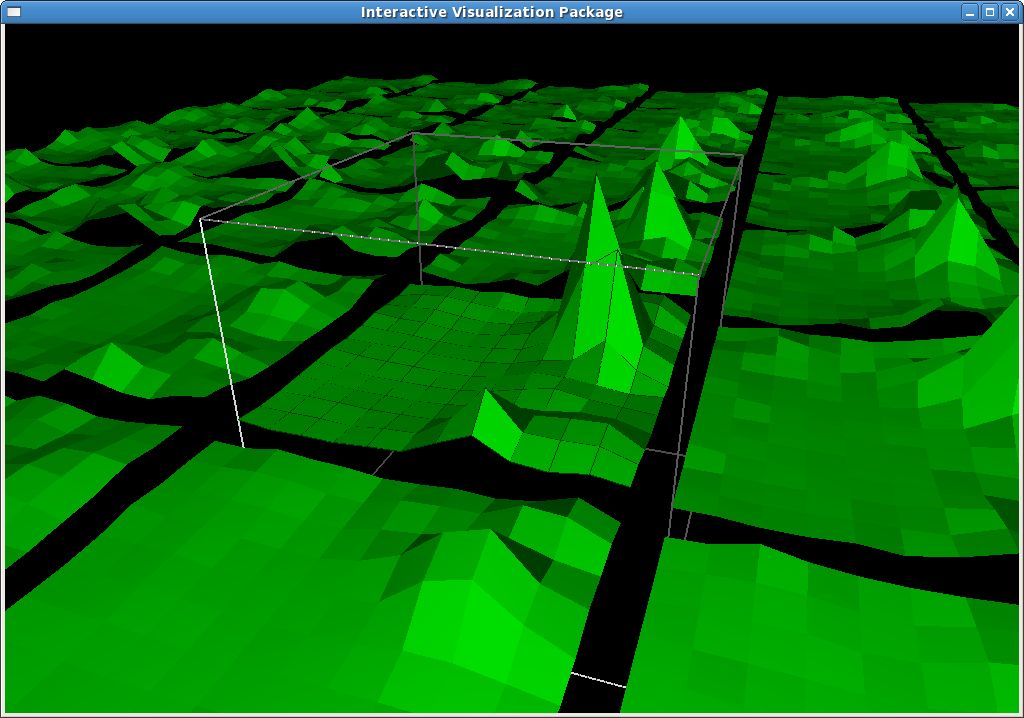
Fig. 1 illustrates the concept: just by pressing the arrow keys one can fly above an array of two-dimensional slices. Moving up or down means to change the -coordinate, and moving left or right -coordinate of the slices in the four-dimensional lattice.
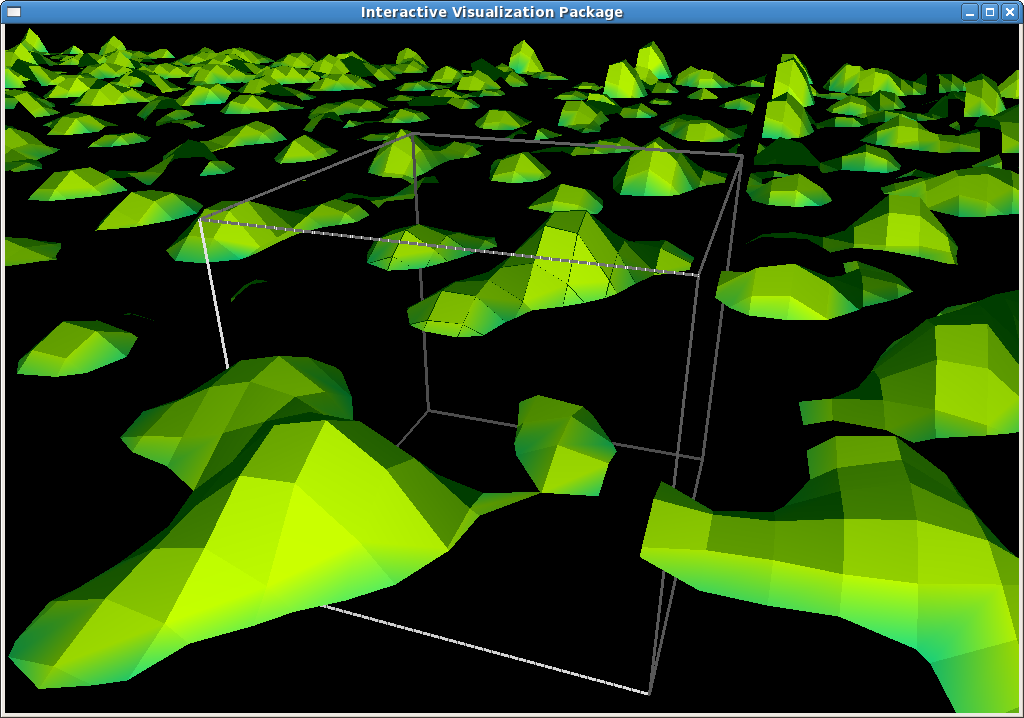
The color can be coded dependent on the data values to emphasize peaks or lakes (Fig. 2). The position of the color threshold can be changed interactively. Another, but similar, visual aid is implemented by a clipping plane. By rising a clipping plane, the surfaces bellow the plane become invisible, and only the peaks above some threshold are left in the scenery (Fig. 3). Again, the position of the clipping plane can be adjusted interactively.
Further insight is provided by an interactive simultaneous examination of two different configurations, eigenmodes or even two different physical quantities (e.g. eigenmode density vs. topological charge or action densities) at the same position on the lattice. IVP reads two four-dimensional data sets and allows to switch between them by pressing ’1’ or ’2’, or even to split the screen vertically (Fig. 4) or horizontally (Fig. 5) — just by pressing ’v’ or ’h’ on the keyboard.
Finally, if one wishes to compare two slices in more detail, one can apply simultaneous parallel rotation of the slices illustrated in Fig. 6.
3 Coding
IVP relies on technologies used for implementation of modern computer games with complex real-time three-dimensional graphics rendering. Thanks to the power of the OpenGL graphics library enhanced with OpenGL Utility Libraries (GLUT) only a few hundred lines of standard C code were enough to provide optimal functionality and amazing visual effects. OpenGL is one of the two (another is DirectX) computer graphics industry standards which is widely supported by graphics cards manufacturers. Many OpenGL routines are performed directly by graphics hardware and that, combined with the coding in C programming language, makes IVP fast and efficient on almost any PC or even laptop. For a simple introduction to OpenGL and GLUT libraries see [9].
IVP was successfully tested on Fedora and Debian Linux and should be easily ported to any platform with OpenGL and GLUT libraries available. If you are interested to test or apply IVP, please write to ivan.hip@gmail.com.
Acknowledgments.
I would like to thank Christof Gattringer and Christian B. Lang for providing me with gauge configurations and eigenmodes, to Krešimir Kumerički who tested the IVP on Debian Linux and to Mario Zidar who helped with the design of the poster.References
- [1] I. Horvath, N. Isgur, J. McCune and H. B. Thacker, Phys. Rev. D 65 (2002) 014502 [arXiv:hep-lat/0102003].
- [2] C. Gattringer, E. M. Ilgenfritz and S. Solbrig, arXiv:hep-lat/0601015.
- [3] F. Bruckmann, C. Gattringer, E. M. Ilgenfritz, M. Müller-Preussker, A. Schäfer and S. Solbrig, arXiv:hep-lat/0612024.
- [4] E. M. Ilgenfritz, K. Koller, Y. Koma, G. Schierholz, T. Streuer and V. Weinberg, Phys. Rev. D 76 (2007) 034506 [arXiv:0705.0018 [hep-lat]].
- [5] A. Hasenfratz, R. Hoffmann and S. Schaefer, arXiv:0709.0932 [hep-lat].
- [6] M. Feurstein, H. Markum and S. Thurner, Nucl. Phys. Proc. Suppl. 53, 553 (1997) [arXiv:hep-lat/9608037]; Nucl. Phys. Proc. Suppl. 63 (1998) 477 [arXiv:hep-lat/9709155]; Nucl. Phys. Proc. Suppl. 64 (1998) 502 [arXiv:hep-lat/9709153].
- [7] D. B. Leinweber, arXiv:hep-lat/0004025. See also: http://www.physics.adelaide.edu.au/~dleinweb/
- [8] F. Gutbrod, Eur. Phys. J. direct C 3 (2001) 1 [arXiv:hep-lat/0011046].
- [9] M. P. Baker and D. Hearn: Computer Graphics with OpenGL, 3rd Edition, Prentice Hall, 2003