A Micro Molecular Bipolar Outflow From HL Tau111 Based on observations obtained at the Gemini Observatory, which is operated by the Association of Universities for Research in Astronomy, Inc., under a cooperative agreement with the NSF on behalf of the Gemini partnership: the National Science Foundation (United States), the Particle Physics and Astronomy Research Council (United Kingdom), the National Research Council (Canada), CONICYT (Chile), the Australian Research Council (Australia), CNPq (Brazil) and CONICET (Argentina).
Abstract
We present detailed geometry and kinematics of the inner outflow toward HL Tau observed using Near Infrared Integral Field Spectograph (NIFS) at the Gemini-North 8-m Observatory. We analyzed H2 2.122 emission and [Fe II] 1.644 line emission as well as the adjacent continuum observed at a 02 resolution. The H2 emission shows (1) a bubble-like geometry to the northeast of the star, as briefly reported in the previous paper, and (2) faint emission in the southwest counterflow, which has been revealed through careful analysis. The emission on both sides of the star show an arc 10 away from the star, exhibiting a bipolar symmetry. Different brightness and morphologies in the northeast and southwest flows are attributed to absorption and obscuration of the latter by a flattened envelope and a circumstellar disk. The H2 emission shows a remarkably different morphology from the collimated jet seen in [Fe II] emission. The positions of some features coincide with scattering continuum, indicating that these are associated with cavities in the dusty envelope. Such properties are similar to millimeter CO outflows, although the spatial scale of the H2 outflow in our image (150 AU) is strikingly smaller than the mm outflows, which often extend over 1000–10000 AU scales. The position-velocity diagram of the H2 and [Fe II] emission do not show any evidence for kinematic interaction between these flows. All results described above support the scenario that the jet is surrounded by an unseen wide-angled wind, which interacts with the ambient gas and produce the bipolar cavity and shocked H2 emission.
1 Introduction
Jets or outflows are associated with young stellar objects (YSOs) at a variety of masses and evolutionary stages. There is growing evidence that these are powered by mass accretion, although the details of the flow launching mechanism are not yet clear. Understanding this issue is hampered by the angular resolution of the telescopes and interferometers, which is not yet high enough to resolve the central engine of the driving source. Instead, investigating flow geometry and kinematics close to the driving source provides useful information for understanding the relation between stellar mass accretion and outflows.
In particular, recent observations of near-infrared H2 emission have provided new clues to understand the activities of mass ejection close to (300 AU) low-mass protostars. Pioneering work includes echelle spectroscopy and Fabry-Perot imaging of several Class I protostars by Davis et. al. (2001, 2002). Davis et al. (2001) revealed the presence of two blueshifted components at high (50–150 km s-1) and low velocities (5–20 km s-1). Such a kinematic structure in H2 emission is similar to the forbidden emission line regions close to T Tauri stars (see e.g., Hartigan et al. 1995). While the high-velocity component is clearly associated with a collimated jet, the nature of the low velocity component is less clear. This low velocity component could be either a magnetohydrodynamically driven gas (e.g., Pyo et al. 2003, 2004; Takami et al. 2004) or a component entrained by an unseen wide-angled wind (e.g., Pyo et al. 2006; Takami et al. 2006). Davis et al. (2002) revealed H2 emission associated with a collimated jet and cavity walls toward some YSOs. Such emission is excited by shocks at a temperature of 2000 (Takami et al. 2004, 2006; Beck et al. 2007).
Beck et al. (2007, hereafter Paper I) present the morphology and excitation of the near-infrared H2 emission toward six T Tauri stars using NIFS (Near Infrared Integral Field Spectograph) at the Gemini North Telescope on Mauna Kea. NIFS is an image slicing IFU fed by Gemini’s near-infrared adaptive optics system, Altair, to obtain integral field spectroscopy with a resolving power of . These observations revealed a variety of morphological distribution within 200 AU of T Tauri stars, and showed that H2 molecules are presumably excited by shocks. The study we present shows a detailed analysis of the emission associated with one of the best studied YSOs, HL Tau. The YSO is in transient phase from a Class I protostar to T Tauri star (see Pyo et al. 2006, and references therein), and is known to host an extended collimated jet (Mundt et al. 1990), millimeter CO outflow (Monin et al. 1996; Cabrit et al. 1996), circumstellar disk (e.g., Wilner et al. 1996; Kitamura et al. 2002), and also a flattened gas envelope (Sargent & Beckwith 1990) which may be infalling toward the star (Hayashi et al. 1993). Paper I revealed the presence of a bubble-like morphology in H2 emission extending toward the northeast.
In this paper we analyze the results for H2 1-0 S(1) emission (2.122 ) together with the [Fe II] 1.644 line and also adjacent continuum. Our results suggest the presence of an unseen wide-angled wind, interacting with the ambient gas and produce a bipolar cavity and shocked H2 emission. Throughout the paper, we adopt the distance to the target of 140 pc (Elias 1978).
2 Observations and Results
Observations were made using NIFS at the Gemini North Telescope on February 8 and 11 2006. NIFS provides integral field spectroscopy with a resolving power of at 2.2 . The NIFS field is 3”3” in size and the individual IFU pixels are 01004 on the sky. The standard - and -band settings provided the spectral ranges of 2.00–2.45 and 1.48–1.80 , respectively. This allowed us to observe H2 1-0 S(1) 2.122 and [Fe II] 1.644 lines together with the adjacent continuum. Our spectra also cover several other H2 (see Paper I) and [Fe II] lines. The star was occulted using a 02- mask to provide long exposures (900 s for both - and -bands), thereby observing the target lines with high signal-to-noise. The total on-source integration were 3600 s for each band. In addition to the target, a nearby sky field was observed for the background subtraction, and A0 stars (HIP 15760 and HIP 25736) were observed before and after the target for telluric correction. The Gemini facility calibration unit, GCAL, was used with the IR continuum (-band) and Quartz Halogen (-band) lamps to obtain flatfields (see Paper I for details).
Observations of HL Tau were acquired using the Gemini Adaptive Optics system, Altair,using the nearby bright star XZ Tau for wavefront reference ( 20” distant). The ambient weather was stable at 05–06 natural seeing conditions, but the data were acquired through thin, sparse cirrus. The -band and -band acquisition images of HL Tau showed that the central source had an AO-corrected FWHM of 017–018. HL Tau may not be a point source, hence these values provide upper limits of the spatial resolution.
The raw IFU frames were reduced into datacubes using the NIFS tasks in the Gemini IRAF package. After dark-subtraction, flat fielding, field cosmetics, sky-background subtraction, 1-D traditional long-slit spectra were extracted, and wavelength calibration and telluric correction were made. Then these were combined into 3-D data cubes (, , and ). See Paper I for more details.
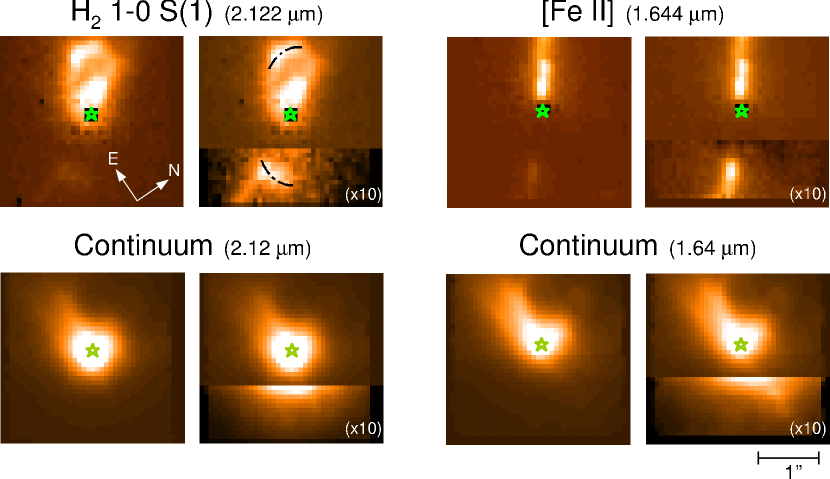
Figure 1 shows the spatial distribution of H2 2.122 , [Fe II] 1.644 , and the adjacent continuum. As briefly reported in Paper I, the H2 emission shows a bright bubble-like morphology in the northeast of the star. The angular scale of this structure is 12 and 08 (170 and 110 AU) in length and width, respectively. The direction of this feature roughly coincides with a blueshifted collimated jet observed by Mundt et al. (1990) and Ray et al. (1996). The structure of the bubble is in some extent axisymmetric about the jet axis: the peak position at 03 and 10 away from the star is offset from the axis toward the right and left, respectively. In addition to the northeast bubble, shown in Paper I, we find a faint component seen in the opposite direction. This southwest feature consists of (1) a relatively bright arc 10 away from the star, slightly elongated in the east-west direction; and (2) a faint filamentary structure further away toward the south. The position and morphology of the arc is similar to the peak emission at the top of the northeast bubble. These north-west and south-east emission structures represent the blueshifted and redshifted flows, respectively, as shown later in detail.
The [Fe II] 1.644 shows a collimated morphology with an angular width of 02–03, the width basically increases with distance, except the base of the northeast jet, which shows a width of 03. The morphology in the northeast is similar to the H emission observed using the Hubble Space Telescope (Ray et al. 1996). The emission shows peaks at 04 and 07 away from the star, and faint emission extends further away. Analogous to the H2 emission, the southwest emission is much fainter than the northeast, typically by a factor of 10. The jet in this side exhibits a peak 12 away from the star, and fainter emission extends to further distances. These results agree with the previous echelle spectroscopy by Pyo et al. (2006). Their position-velocity diagram confirms that these small-scale jets are the inner regions of the flows that extend over an arcminute scale observed by Mundt et al. (1990).
In Figure 1, both H2 and [Fe II] emission show bipolarity, in both cases the emission in the southwest is fainter than the northeast by a factor of 10. Furthermore, the southwest emission is absent within 07–10 of the star. These characteristics are attributed to absorption of the southeast (redshifted) flow by a flattened envelope extending over 1000 AU (e.g., Sargent & Beckwith 1990; Hayashi et al. 1993) and an optically thick circumstellar disk with a radius of 100 AU (see Pyo et al. 2006, and references therein). Hayashi et al. (1993) measured the radius and mass of the envelope of 1400 AU and 0.03 , respectively. These values yield an average column density of 31022 cm-2 assuming an inclination angle of 45∘ (see Pyo et al. 2006, and references therein), thereby causing 3. This should reduce the H2 2.122 m flux from the southwest flow by a factor of 15, agreeing with the observed flux ratio between the northeast and southwest flows. The circumstellar disk is optically much thicker: the radius and mass of the disk of 100 AU and 0.05 (Wilner et al. 1996; Kitamura et al. 2002) yield . This should thus completely obscure the southwest flow at least within 0.5 AU of the star, as is observed.
The continuum emission at 2.12 and 1.64 shows a triangular morphology to the north-east due to scattering in a cavity in the dusty envelope (e.g., Weintraub et al. 1995; Close et al. 1997; Lucas et al. 1994). This nebulosity is more clearly seen at 1.64 presumably due to the following two facts: (1) the flux from the star is more affected by extinction, thereby relatively faint; (2) the scattering efficiency is higher at shorter wavelengths. The 1.64 continuum also shows a marginal extension toward the west (see the bottom-right of the image in Figure 1). Unlike the H2 and [Fe II] emission, the continuum emission does not seem to show any other remarkable structures in the southwest.
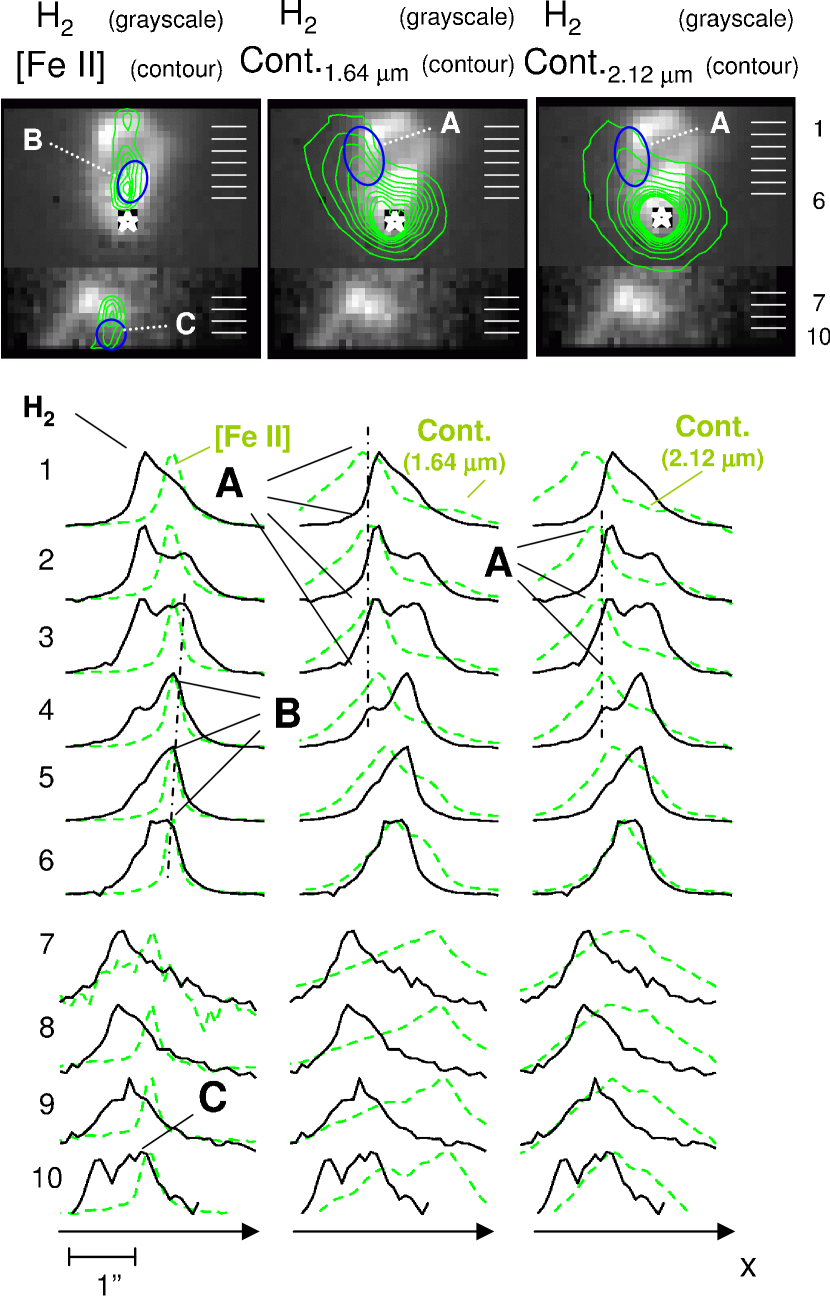
We perform detailed comparison of the H2, [Fe II] and continuum images in Figure 2. Included in the bottom region of Figure 2 are 1-D slices of the spacial flux distribution across the axis of the jet. The grayscale H2 images together with the contour of the continuum emission show that the H2 flows are bracketed by a cavity in the dusty envelope. Indeed, the position of the left side of the northeast bubble (position A in the figure) matches well with the ridge in the continuum image. In the 1-D strips, the position of H2 and [Fe II] emission also match each other at positions B and C.
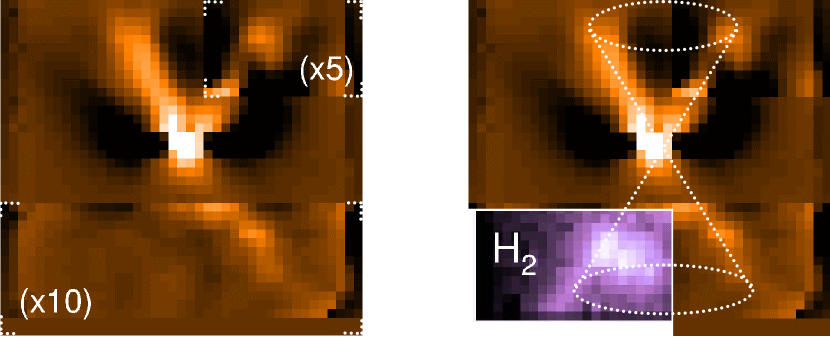
Figure 3 shows an unsharp-masked image of the 1.64 continuum. For this image processing, the original image is smoothed using a rectangular point-spread function with a size of 151 pixel2 (12008), and subtracted from the original image. This enhances the morphology of the ridges, which are seen in the profiles in Figure 2. Figure 3 clearly shows a V-shape morphology in the northeast with an opening angle of 60∘. The axis of the V-shape structure matches well with the jet axis seen in the [Fe II] image in Figure 1. Although the possible bias introduced by unsharp masking may not be clear, we believe this structure in Figure 3 outlines the shape of the inner cavity walls. As shown by Figure 1 and also previous observations (e.g., Lucas et al. 2004), the brightness distribution of the continuum shows asymmetry about the flow/cavity axis. The northeast emission is much brighter at the left side of the axis. Similar asymmetry in the scattering nebulae is also seen toward some other YSOs (e.g., HH 30 — Cotera et al. 2001; HH 46/47 — Heathcote et al. 1996), and this could result from non-uniform brightness distribution of the stellar surface due to the presence of hot spots (e.g., Cotera et al. 2001). In the southwest, the scattered light continuum emission is seen only in the bottom-right of the image in Figure 3, and the emission associated with the bottom-left side of the cavity appears to be missing. Instead, the position of the faint filamentary structure seen in the H2 emission corresponds to the inner cavity wall that is not seen in continuum emission (overplotted to the right in Figure 3).
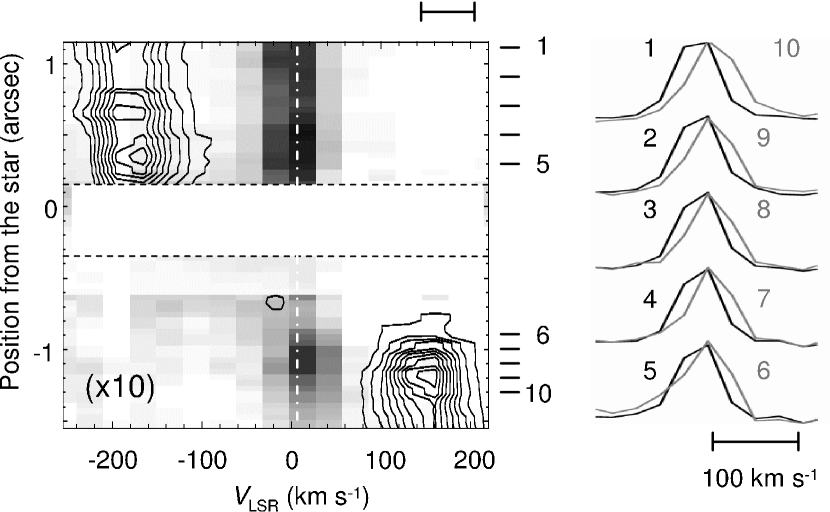
Figure 4 shows the position-velocity diagram of the H2 and [Fe II] emission along the top-bottom direction of Figure 1. The H2 emission shows velocities nearly the same as the systemic velocity, and the northeast flow appears slightly blueshifted than the southwest flow (by 15 km s-1). Thus, it is likely that each side of the H2 flow are moving toward or away from us with a radial velocity of 5–10 km s-1 compared with the systemic velocity. Such a velocity is comparable to the expanding velocity of the cavity measured by low-order adaptive optics imaging in different years (30 km s-1, Close et al. 1997). The velocity of the H2 outflow would be remarkably larger than the molecular bipolar outflow extending over 20” scales (1–1.5 km s-1, Monin et al. 1996; Cabrit et al. 1996).
Such velocities seen in the H2 emission contrast with the velocity of the collimated jet seen in the [Fe II] emission. In Figure 4, the [Fe II] emission shows LSR velocities of –180 and 150 km s-1 at the northeast and southwest, respectively. These agree with the previous measurements by echelle spectroscopy at Subaru (Pyo et al. 2006). The figure shows that the velocity of the H2 and [Fe II] emission is constant over each side of the star at a spectral resolution of NIFS. Their line widths coincide with the resolving power (70 km s-1), revealing that the velocity dispersion of each flow component is spectrally unresolved.
3 Discussion
Mass ejection from low-mass YSOs is often observed in two different manners: (1) collimated jets often seen in optical-IR wavelengths, or millimeter wavelengths in some cases (see e.g., Bally et al. 2007 for review) (2) molecular bipolar outflows, which show a variety of morphologies in millimeter CO lines (see e.g., Arce et al. 2007 for review). The relation between these types of flows remain unclear. In particular, two major scenarios have been discussed over decades for driving of the molecular outflows. These are: (1) jet-driven scenario, for which the molecular outflow results from interaction between a collimated jet and ambient material (e.g., Raga & Cabrit 1993); and (2) wind-driven scenario, for which the molecular outflow results from an unseen wide-angled wind (e.g., Shu et al. 1991). Studies to date suggest that neither the jet-driven nor wind-driven models can explain a wide range of morphologies and kinematic properties observed in all outflows (see Cabrit et al. 1997; Arce et al. 2007).
The observed morphology and kinematics in H2 emission from HL Tau are similar to millimeter CO outflows. It is striking that the H2 flow observed in HL Tau is smaller than a typical spatial scale of the millimeter CO outflows. While the CO outflows often extend over 1000–10000 AU scales (see e.g., Lee et al. 2000, 2002), including HL Tau itself (Monin et al. 1996; Cabrit et al. 1996), the H2 flow in HL Tau shows a spatial scale of only 150 AU.
The H2 emission shows a remarkably different geometry and kinematics from the [Fe II] emission associated with the collimated jet. Furthermore, there is no evidence for kinematic interaction between the H2 flow and the collimated jet: i.e., there is no clear evidence of acceleration of deceleration of the H2 and [Fe II] flows where these are overlapped in Figure 2. These results support the scenario that the jet is surrounded by an unseen wide-angled wind, which interacts with the ambient gas and produces the bipolar cavity and also shocked H2 emission. The presence of such a wide-angled wind indeed agrees with proposed magneto-hydrodynamically driven wind models (see e.g., Brandford & Payne 1982; Uchida & Shibata 1985; Shang et al. 2006). Alternatively, Close et al. (1997) suggests that the cavities associated with HL Tau could be produced by a precessing jet. However, we emphasize that our results do not show any evidence for kinematic interaction between the [Fe II] emission associated with the collimated jet and the H2 emission at the cavity walls. Furthermore, a typical cooling time scale of the near-infrared H2 emission line regions is less than a year (see e.g.,Takami et al. 2004), and the gas associated with the jet would move only 02 in such a period (Mundt et al. 1990). Thus, the jet would have to be spatially located much closer to the H2 emission line regions if it was responsible for the H2 line excitation.
The arcs in H2 emission 1”.0 away from the star suggests that the ejection activity is time-variable. Assuming a flow velocity of 10 km s-1 inclination angle of 34∘ from the plane of the sky (Mundt et al. 1990), we estimate the dynamical age of these arcs of 70 yrs. Periodic monitoring observations spread over year-long timescales are necessary to measure their proposer motions and determine the accurate dynamical age. Such a time-variable wind may be a rather common activity associated with low-mass YSOs. Indeed, a wind bubble similar to the northwest H2 emission is also observed in the neighboring YSO XZ Tau in optical emission lines (Krist et al. 1997, 1999; Coffey et al. 2004). Furthermore, some millimeter CO outflows show multiple shell structures extending over 1000–10000 AU scales (see e.g., Lee et al. 2002). Arce & Goodman (2001) show that episodic outflows well explain the presence of “Hubble wedges” (i.e., a jagged profile) in the position-velocity diagram, and also steep power-low slopes of mass-velocity relation (, ) observed toward some outflows.
Time-variable mass mass ejection may be related to episodic mass accretion, observed in extreme cases, as FU Orionis (FUor) or EX Orionis (EXor) outbursts (see e.g., Hartmann & Kenyon 1996; Herbig 1989). Indeed, optical-IR absorption lines of FUors suggest the presence of an energetic disk wind (e.g., Calvet et al. 1993). Furthermore, spectroscopic monitoring of CO overtone absorption suggests that one of the FUors ejected an expanding shell of dense, low-temperature material within a few decades ago (Hartmann et al. 2004). Such a link between episodic mass ejection and accretion has also been proposed to explain the morphology of the collimated jet associated with YSOs (e.g., Dopita 1978; Reipurth 1989; Zinnecker et al. 1998).
References
- Arce et al. (2007) Arce, H. G., Shepherd, D., Gueth, F., Lee, C.-F., Bachiller,R., Rosen, A. & Beuther, H. (2007), Protostars and Planets V, in press
- Arce & Goodman (2001) Arce, H. G., & Goodman, A. A. 2001, ApJ, 551, L171
- Arce & Sargent (2004) Arce, H. G., & Sargent, A. I. 2004, ApJ, 612, 342
- Bacciotti et al. (2000) Bacciotti, F., Mundt, R., Ray, T. P., Eislöffel, J., Solf, J., & Camezind, M. 2000, ApJ, 537, L49
- Bachiller et al. (1995) Bachiller, R., Guilloteau, S., Dutrey, A., Planesas, P., & Martin-Pintado, J. 1995, A&A, 299, 857
- Beck et al. (2009) Bally, J., Reipurth, B., Davis, C.J. 2007, Protostars and Planets V, in press
- Beck et al. (2007) Beck, T.L., McGregor, P. , Takami, M., & Pyo, T.-S. 2007, ApJ, (Paper I)
- Blandford & Payne (1982) Blandford, R. D., & Payne, D. G. 1982, MNRAS, 199, 883
- Cabrit et al. (1996) Cabrit, S., Guilloteau, S., Andre, P., Bertout, C., Montmerle, T., & Schuster, K. 1996, A&A, 305, 527
- Cabrit et al. (1997) Cabrit, S., Raga, A., & Gueth, F. 1997, IAU Symp. 182: Herbig-Haro Flows and the Birth of Stars, 182, 163
- Calvet et al. (1993) Calvet, R. J., O’Brien, J. F., & Neat, G. W. 1993, Proc. SPIE, 1947, 126
- Close et al. (1997) Close, L. M., et al. 1997, ApJ, 489, 210
- Coffey et al. (2004) Coffey, D., Downes, T. P., & Ray, T. P. 2004, A&A, 419, 593
- Cotera et al. (2001) Cotera, A. S., et al. 2001, ApJ, 556, 958
- Davis et al. (2001) Davis, C. J., Ray, T. P., Desroches, L., & Aspin, C. 2001, MNRAS, 326, 524
- Davis et al. (2002) Davis, C. J., Stern, L., Ray, T. P., & Chrysostomou, A. 2002, A&A, 382, 1021
- Dopita (1978) Dopita, M. A. 1978, ApJS, 37, 117
- Elias (1978) Elias, J. H. 1978, ApJ, 224, 857
- Hartigan et al. (1995) Hartigan, P., Edwards, S., & Ghandour, L. 1995, ApJ, 452, 736
- Hartmann & Kenyon (1996) Hartmann, L., & Kenyon, S. J. 1996, ARA&A, 34, 207
- Heathcote et al. (1996) Heathcote, S., Morse, J. A., Hartigan, P., Reipurth, B., Schwartz, R. D., Bally, J., & Stone, J. M. 1996, AJ, 112, 1141
- Herbig (1989) Herbig, G. H. 1989, Low Mass Star Formation and Pre-main Sequence Objects, 233
- Krist et al. (1999) Krist, J. E., et al. 1999, ApJ, 515, L35
- Krist et al. (1997) Krist, J. E., et al. 1997, ApJ, 481, 447
- Kwan & Tademaru (1988) Kwan, J., & Tademaru, E. 1988, ApJ, 332, L41
- Lee et al. (2002) Lee, C.-F., Mundy, L. G., Stone, J. M., & Ostriker, E. C. 2002, ApJ, 576, 294
- Lee et al. (2000) Lee, C.-F., Mundy, L. G., Reipurth, B., Ostriker, E. C., & Stone, J. M. 2000, ApJ, 542, 925
- Monin et al. (1996) Monin, J.-L., Pudritz, R. E., & Lazareff, B. 1996, A&A, 305, 572
- Mundt et al. (1990) Mundt, R., Buehrke, T., Solf, J., Ray, T. P., & Raga, A. C. 1990, A&A, 232, 37
- Pyo et al. (2006) Pyo, T.-S., et al. 2006, ApJ, 649, 836
- Raga & Cabrit (1993) Raga, A., & Cabrit, S. 1993, A&A, 278, 267
- Ray et al. (1996) Ray, T. P., Mundt, R., Dyson, J. E., Falle, S. A. E. G., & Raga, A. C. 1996, ApJ, 468, L103
- Reipurth (1989) Reipurth, B. 1989, Nature, 340, 42
- Shang et al. (2006) Shang, H., Allen, A., Li, Z.-Y., Liu, C.-F., Chou, M.-Y., & Anderson, J. 2006, ApJ, 649, 845
- Shu et al. (1991) Shu, F. H., Ruden, S. P., Lada, C. J., & Lizano, S. 1991, ApJ, 370, L31
- Takami et al. (2006) Takami, M., et al. 2006, ApJ, 641, 357
- Takami et al. (2004) Takami, M., Chrysostomou, A., Ray, T. P., Davis, C., Dent, W. R. F., Bailey, J., Tamura, M., & Terada, H. 2004, A&A, 416, 213
- Wilner et al. (1996) Wilner, D. J., Ho, P. T. P., & Rodriguez, L. F. 1996, ApJ, 470, L117
- Uchida & Shibata (1985) Uchida, Y., & Shibata, K. 1985, PASJ, 37, 515
- Zinnecker et al. (1998) Zinnecker, H., McCaughrean, M. J., & Rayner, J. T. 1998, Nature, 394, 862