Electroformation in a flow chamber with solution exchange as a means of preparation of flaccid giant vesicles
Abstract
A recently described technique (Estes and Mayer, Biochim. Biophys. Acta 1712 (2005) 152–160) for the preparation of giant unilamellar vesicles (GUVs) in solutions with high ionic strength is examined. By observing a series of osmotic swellings followed by vesicle bursts upon a micropipette transfer of a single POPC GUV from a sucrose solution into an iso-osmolar glycerol solution, a value for the permeability of POPC membrane for glycerol, , has been obtained. Based on this result, an alternative mechanism is proposed for the observed exchange of vesicle interior. With modifications, the method of Estes and Mayer is then applied to preparation of flaccid GUVs.
keywords:
giant vesicle , electroformation , conductive solution , membrane permeability , glycerol,
1 Introduction
Since being introduced over 20 years ago by Angelova and Dimitrov [1], the electroformation method has became an indispensible tool for preparing giant unilamellar vesicles (GUVs) with a diameter exceeding 10 m, which constitute useful model systems for biological cells [2]. Being first developed with a DC electric field [1], the method was subsequently improved by replacing the DC electric field with a very low-frequency (1–10 Hz) AC electric field [3]. Two experimental setups were established: in the first one a pair of parallel platinum wires constituted the electrodes [4], while the other used plan-parallel electrodes instead: microscope slides, coated with an optically transparent layer of indium tin oxide (ITO) [5]. An overview of the development is available in [6]. Recently, a number of techniques have been developed which combine electroformation with other techniques, including micropatterning of ITO glass [7], microfluidic channels [8, 9], and electroformation on non-conductive substrates [10].
While the electroformation method is appreciated for its superior homogeneity of vesicle sizes [11] and is widely recognized as a simple and reproducible technique which appears to be efficient for many types of different lipid mixtures [12], its key disadvantage is that it cannot be applied if the salt concentration exceeds 10 mM [13], or when the membrane is composed of charged amphiphiles [14]. Methods based on spontaneous swelling [15, 16] were used for the preparation of GUVs in physiological conditions [17, 18, 19]. Recently, however, Estes and Mayer proposed a technique where electroformation is conducted in a flow chamber [20]: in the first step, electroformation is performed as usual, and in the second step the solution in the electroformation chamber is exchanged while the vesicles are still attached to the electrodes. In this way, the authors report to be able to produce GUVs (10–100 m in diameter) in solutions with high ionic strength (up to 2 mol/L KCl). Employing phase contrast and fluorescence techniques, they report that within 30 minutes, the solution inside the vesicles has also been replaced, and propose a diffusion mechanism through lipid tubules to explain this phenomenon.
In this paper, we examine the technique of Estes and Mayer with different pairs of internal/external solutions. We estimate the permeability of POPC membrane for glycerol with an experiment, where a single POPC GUV is transferred with a micropipette from a sucrose solution into an iso-osmolar glycerol solution. Based on this relatively high permeability, we provide an alternative explanation for the solution exchange inside the vesicles. We also extend the work of Estes and Mayer and apply their method to demonstrate the possibility of its use for the preparation of flaccid GUVs.
2 Materials and methods
2.1 Materials
Trizma base, Trizma HCl, and L--phosphatidylcholine from egg yolk (eggPC) were purchased from Sigma-Aldrich (St. Louis, USA); D-(+)-glucose, D-(+)-sucrose and glycerol were from Fluka (Buchs, Switzerland). Methanol and chloroform were purchased from Kemika (Zagreb, Croatia). 1-palmitoyl-2-oleoyl-sn-glycero-3-phosphocholine (POPC) was purchased from Avanti Polar Lipids (Alabaster, USA). 2-(12-(7-nitrobenz-2-oxa-1,3-diazol-4-yl)amino)dodecanoyl-1-hexadecanoyl-sn-glycero-3-phosphocholine (NBD C12-HPC) was purchased from Invitrogen (Eugene, USA). All the solutions were prepared in double-distilled and sterile water.
2.2 Electroformation chamber and procedure
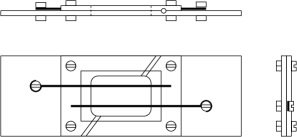
The electroformation chamber was machined from two plates of 2.5 mm acrylic glass (polymethyl methacrylate, PMMA), mounted together with four M3 screws. A mm opening was cut through both plates, yielding an observation chamber with a volume of 1.2 . A channel 1.5 mm deep and 2.5 mm wide was milled into the inner face of both plates from two diagonally opposite corners of the observation chamber to the edge, allowing for mounting the inlet and the outlet tube (PVC perfusor tube, outside diameter 2 mm; Tik, Kobarid, Slovenia). Another channel 1 mm deep and 1.5 mm wide was milled into the inner face of the smaller plate to allow for the access of electrodes made of 1 mm Pt wire, which were also mounted with M3 screws. The distance between the electrodes is 5 mm. The observation chamber is covered with a mm glass cover slip on the upper and the lower side, mounted with a vacuum grease (Baysilone; Bayer, Leverkusen, Germany); vacuum grease is also used to seal the contact surface between the two plates and the openings for tubing and the electrodes.
A suspension of POPC GUVs (e.g, in 0.2 mol/L sucrose/glucose solution, 1:1, or in mixtures of other iso-osmolar solutions) was prepared using an electroformation method described by Angelova [4] with modifications [21, 22]. The lipids were dissolved in a mixture of chloroform/methanol (2:1, v/v) to a concentration 1 mg/mL. 25 L of the lipid solution was spread onto two Pt electrodes and dried under the reduced pressure (water aspirator; mmHg) for 2 hours. The electrodes were then placed into an electroformation chamber, which was filled with 0.2 mol/L sucrose. AC current (8 V, 10 Hz) was then applied. After 2 hours the voltage and the frequency were reduced in steps, first to 4 V/5 Hz, after 15 minutes to 2.5 V/2.5 Hz, and after additional 15 minutes to the final values of 1 V and 1 Hz, which were held for 30 minutes. From this point, either of the two procedures were employed: (a) In a flow-exchange experiment, the syringe pump was switched on at this stage; (b) If a suspension of vesicles in 0.2 mol/L sucrose/glucose solution was prepared for the micropipette experiment, the chamber was drained into a beaker at this stage and flushed with buffered 0.2 mol/L glucose solution, thus resulting in a suspension of GUVs in a 1:1 sucrose/glucose solution. This procedure yields preferentially spherical unilamellar vesicles with diameters up to 100 m containing entrapped sucrose.
2.3 Flow exchange
A syringe pump (Genie; Kent Scientific Corp., Torrington, USA) was used to exchange the solution in the flow chamber at a constant flow rate. A volumetric flow rate set to mL/h resulted in a movement of fluid past the electrodes, its speed estimated at m/s. An estimate for the Reynolds number of the solution flow past the electrodes yields , with mm being the characteristic length (electrode diameter), kg/L the density of the solution, and Pa s the dynamic viscosity of the solution, which we approximated with the value for water at 25∘C. This means the flow in the chamber can be adequately approximated with a laminar flow.
2.4 Microscopy and micromanipulation
Both phase contrast and fluorescent micrographs were obtained with an inverted optical microscope (Nikon Diaphot 200, objective 20/0.40 Ph2 DL or Fluor 60/0.70 Ph3DM) with the epi-fluorescence attachment, micromanipulating equipment (Narishige MMN-1/MMO-202) and a cooled CCD camera (Hamamatsu ORCA-ER; C4742-95-12ERG), connected to a PC running Hamamatsu Wasabi software. The software also controlled a Uniblitz shutter with VMM-D1 controller (Vincent Associates, Rochester NY, USA) in the light path of the Hg-arc light source.
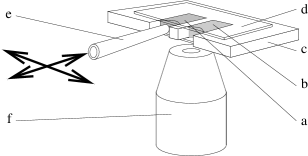
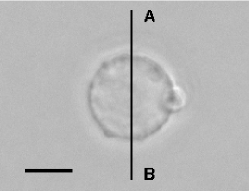
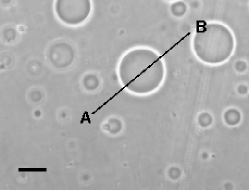
In a micromanipulation experiment, a spherical POPC GUV was selected, fully aspirated into a glass micropipette with a diameter exceeding the diameter of the vesicle, and transferred into the target solution of glycerol, where the content of the micropipette was released (Fig. 2). After removing the micropipette, the vesicle was monitored with a video camera. To allow for access with a micropipette, both compartments in a micromanipulation chamber are relatively thick (approx. 2.5–3 mm) and open on one side.
2.5 Refractometry
Refractive indices of glycerol, NaCl, glucose, sucrose, and buffer solutions were measured using an Abbe refractometer (Xintian WY1A, Guiyang, China).
3 Results
3.1 Control experiments
As a control, the experiment of Estes and Mayer [20] was repeated in several variations, both with ionic (NaCl, Trizma buffer) and non-ionic (glycerol, sucrose, glucose) solutions.
3.1.1 Glycerol exchange
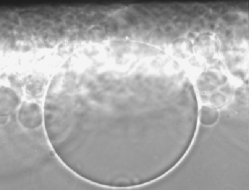
In one experiment, we performed electroformation as described above with either EggPC or POPC in 0.2 mol/L glycerol solution (, 26∘C), and replaced the solution with an iso-osmolar 0.1 mol/L NaCl solution (, 26∘C) after the vesicles were formed. As reported by Estes and Mayer [20], three stages can be distinguished. Initially, there was the same solution both inside and outside the vesicles, and vesicle interiors appeared equally dark as the background (Fig. 3a). In an intermediate phase, the vesicle interior appears darker in a phase contract microscopy, and also exhibits a characteristic white halo around the vesicle (Fig. 3b). This is characteristic of a mismatch in the refractive indices of the internal solution (0.2 mol/L glycerol) and the external solution (0.1 mol/L NaCl). The intensity and the width of the halo are proportional to the difference of refractive indices, and, when properly calibrated, can be used for a quantitative determination of the concentration in a vesicle interior [22, 23]. After some time, however, the intensity and the width of the halo and the difference in darkness decrease (Fig. 3c), indicating that substituting the glycerol solution in the flow chamber with the NaCl solution resulted in an exchange of the vesicle interior with the exterior. Both EggPC and POPC exhibited the same behaviour. As evident from Figs. 3a–c, increasing ionic strength causes the aggregation of vesicles and subsequently their aggregation on the electrodes. It also shows that the apparent radius of vesicles decreases with an increasing ionic strength, while simultaneously the vesicles grow internal spherical invaginations (visible on Fig. 3d). We attribute a relatively low yield of this method—considerably fewer vesicles were found in the drained suspension than in a conventional electroformation experiment—to this observed vesicle aggregation on the electrodes.

Similar three-phase behaviour, indicating that the solution in the vesicle interior has been at least partly exchanged with the one in the flow chamber, has been observed with exchanging glycerol with non-ionic solutions, e.g., when 0.2 mol/L glycerol solution was substituted with 0.2 mol/L glucose or vice versa (not shown). The difference between this experiment and the experiment described above is that no vesicle aggregation was observed in this case.
3.1.2 Sugar exchange
In this set of experiments, glycerol was not used. Instead, we replaced a non-ionic solution (0.2 mol/L sucrose solution, , 26∘C or 0.2 mol/L glucose solution, , 26∘C) with another non-ionic solution, or with an ionic solution (0.1 mol/L NaCl, or Trizma buffer). Experiments were conducted with both POPC and EggPC.
In those experiments which did not involve glycerol solution (Fig. 4), we only observed two phases: we started with the same solution inside and outside the vesicle (Fig. 4a), then, as the external solution was exchanged, we noticed a change in darkness of the vesicle interior and exterior, and the appearance of the characteristic halo around a vesicle (Fig. 4b,c). The halo did not significantly diminish with time.

The same two-phase behaviour without an exchange of vesicle interior was noticed with EggPC and POPC vesicles when 0.2 mol/L sucrose solution was substituted with 0.1 mol/L NaCl, and with POPC vesicles when 0.2 mol/L sucrose solution was exchanged with an iso-osmolar solution, either non-ionic (0.2 mol/L glucose), or ionic (0.15 mol/L Trizma buffer, pH 7.4, , or 0.1 mol/L Trizma buffer, pH 9, ). The ionic and non-ionic solutions differed in the fact that vesicle aggregation was only noticed in ionic solutions.
3.1.3 Solution exchange during electroformation
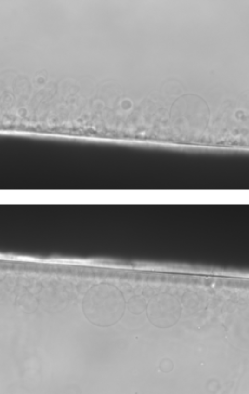
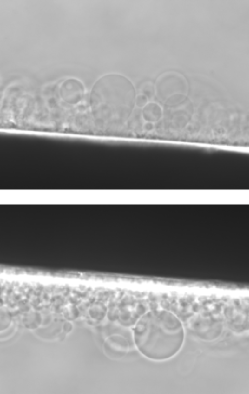
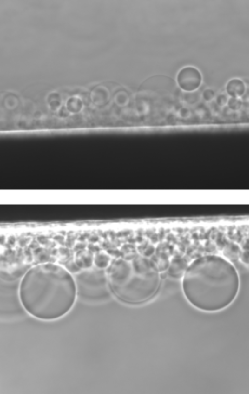
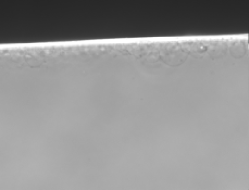
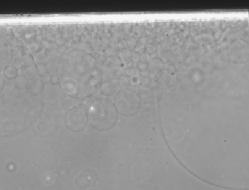
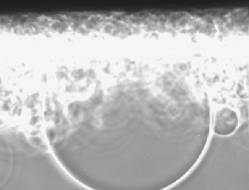
In this experiment the solution exchange was initiated shortly—at the given length of the inlet tube and the flow rate, it took minutes for the replacement solution to reach the electroformation chamber in our setup, as verified independently—after the electroformation was started. In the experiment where 0.2 mol/L sucrose solution was substituted with 0.2 mol/L glucose solution, we found that this time was sufficient for the entrapment of the vesicle interior. As visible in Fig. 5a, 11 minutes from the onset, spherical vesicles are already formed on the inner side of the electrode surface (bottom), while the outer side (top) is predominantly populated by tubular structures with wider “necks”. 23 minutes from the onset, glucose has reached the electroformation chamber, as verified in Fig. 5b, where a weak halo can be seen around the vesicles both on the inner and on the outer side of the electrode. In particular, the halo is also visible around the tubular membrane structures on the outer side of the electrode (Fig. 5b, top). 38 minutes from the onset, the solution in the vesicle exterior has been completely exchanged, as verified by the halo around the vesicles; the intensity of the halo has reached a plateau (Fig. 5c). The inner side of the electrode is populated by spherical vesicles surrounded by a strong halo (bottom), while on the outer side, spherical vesicles are smaller in size. There is a noticeable halo around spherical vesicles, while there is no halo around the tubular membrane structures with wider “necks”, meaning that their interior has the same composition as the exterior. In these cases, the exchange has likely taken place via the mechanism proposed by Estes and Mayer [20].
The difference between the vesicle growth rates on the inner and on the outer electrode surface indicates a difference in the electric field strength affecting the adsorbed lipid layer. An exact estimate of the field, however, is not trivial to obtain (see appendix A for an estimate and a discussion).
3.2 Micropipette transfer into glycerol
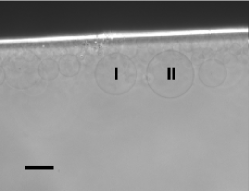
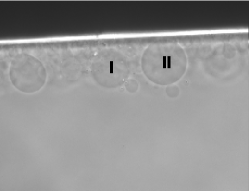
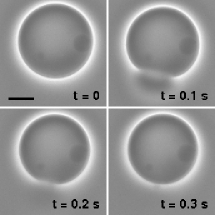
In this experiment, fully formed POPC GUVs were transferred using a micropipette into an iso-osmolar glycerol solution. POPC GUVs were prepared in 0.2 mol/L sucrose/glucose solution as described above and left overnight. Within 2 minutes after the transfer into 0.2 mol/L glycerol solution, vesicles started to release their contents in series of bursts (Fig. 6). The intervals between bursts increased with time. On the other hand, the difference in refractive indices of the vesicle interior and its exterior decreased. We attribute these bursts to the the fact that the membrane permeability for glycerol in the vesicle exterior greatly exceeds the permeability for the sucrose in the vesicle interior, which results in osmotic inflating of the vesicle and increasing the membrane tension to the point where it breaks and releases some of its interior.
Repetitive osmotic swelling followed by a burst-like release has already been observed in cases where the membrane permeability was altered by incorporating pore-forming peptides into the membrane; a theoretical model has also been provided [22, 23]. Such behaviour has already been theoretically predicted earlier [24]. In this treatment, we follow the model proposed in [22] with some minor modifications.
Before going into details, let us summarize the basic ideas of the “repetitive burst” model. An impermeable solute is trapped inside a spherical vesicle, surrounded by a solution of a permeable solute. Since the concentration of the permeable solute is lower inside the vesicle, there is a influx of the permeable solute into the vesicle, accompanied by an influx of water required to maintan the osmotic balance. During the “rising” part of the cycle, the partial concentration of the impermeable solute is constant, while the partial concentration of the permeable solute increases, and consequently the vesicle volume increases as well. During an instantaneous event of a vesicle burst, some if its content is released. The burst is short enough that the influx of the permeable solute during the burst is neglected. During the burst (the “falling” phase), the concentration of either solute inside the vesicle stays constant; however, the total quantity of both the impermeable and the permeable solute decreases, its decrease being proportional to the decrease of the vesicle volume.
The osmotic pressure causes an influx of water into an initially relaxed spherical vesicle with a radius . The swelling of a vesicle strains its membrane and increases its stretching elastic energy [25]:
| (1) |
Here, is the area expansivity constant, is the vesicle membrane area and the area of an unstrained vesicle. Equating (1) with a requirement for a mechanical equilibrium, , one obtains an implicit dependence of the vesicle radius on the pressure difference between the inner and outer pressure:
| (2) |
As the membrane permeability for water is high enough [26] to allow for an almost instantaneous establishment of osmotic equilibrium, one can equate (2) with the osmotic pressure difference , thus obtaining
| (3) |
Here, is the Boltzmann constant, the temperature, and , , and the concentrations of sucrose inside the vesicle, and glycerol inside and outside the vesicle, respectively. As the experimental chamber can be considered as an infinite reservoir compared to the volume of a vesicle, can be considered constant, while and vary with time. Here, and are the numbers of glycerol and sucrose molecules inside the vesicle with a volume at a given time. From the relation (3), one can compute the vesicle radius as a function of the number of glycerol molecules inside the vesicle.
The flux of glycerol molecules into the vesicle is proportional to the difference of glycerol concentration outside and inside the vesicle,
| (4) |
where is the permeability of the membrane for glycerol. The number of glycerol molecules inside the vesicle increases with time at a rate:
| (5) |
It is important to stress here that in (5), both the vesicle volume and the membrane area vary with time, while the membrane permeability is constant. At this point the treatment departs from [22], where the product was considered constant. Using the vesicle radius which can be computed from (3) and inserting it into (5), one can solve (5) numerically.
For realistic parameter values, however, numerical integration is not needed. It is known [27] that the lipid membrane can expand by approximately 4% before its tensile strength is reached, at which point the vesicle rapidly releases its excess volume, and its radius returns to its equilibrium value (Fig. 7). After the burst, the vesicle begins to swell again, until the membrane tension reaches its limiting value, when the vesicle bursts again. In the interval between bursts, the vesicle volume and the number of glycerol molecules inside the vesicle increase. During a burst, part of the sucrose/glycerol solution inside a vesicle is released in such a way that the concentrations and do not change.

In the interval between subsequent bursts, the vesicle radius can be expanded around and linearized, thus obtaining a simplified expression relating the change in volume with the change of the number of glycerol molecules which entered the vesicle since the last burst ():
| (6) |
The simplification took into account . The number of glycerol molecules that enter the vesicle in a time between successive bursts () corresponds to the maximal increase in the vesicle volume and is thus constant. The number of sucrose molecules ejected in the -th burst () is proportional to the number of molecules present in the vesicle just before the burst ():
| (7) |
Equation (5) can be linearized if the vesicle radius (and subsequently and ) is expanded around , leading to an expression for the time interval between successive bursts:
| (8) |
where
| (9) | |||||
| (10) |
Linearizing the logarithm in (8) yields:
| (11) |
The expression obtained allows for an estimate of the membrane permeability from a videomicroscopy recording of a series of vesicle bursts:
| (12) |
Here, and can be determined directly from a microscope image, is known, can be measured, and can be determined from the rate at which the vesicle halo decreases in intensity [22, 23], given that its initial value is known, . The average runs over a series of recorded bursts. Calculated values for membrane permeability for five recorded series of bursts are collected in Table 1, yielding an average value at room temperature (C). Within the experimental error, this value fits the published value for DOPC, at C [28]. Earlier estimates [29], however, were approximately twice as high ( at C).
| experiment | # of bursts | |
|---|---|---|
| 1 | 24 | |
| 2 | 30 | |
| 3 | 31 | |
| 4 | 22 | |
| 5 | 21 |
No bursts were observed when the vesicles were still attached to the electrodes and the external solution was exchanged. On one hand, this is in agreement with the solution exchange mechanism suggested by Estes and Mayer, yet on the other hand this does not disprove the model of solute exchange proposed in the paper. As long as the vesicle is connected to the substrate with a tether, the area of the vesicle membrane is not a well-defined quantity, since new lipid material can be incorporated into the membrane in order to accomodate an increase of the vesicle volume.
No vesicle bursts were observed upon a micropipette transfer of a vesicle from a sucrose solution to an iso-osmolar glucose solution. This leads us to believe that the key factor for repetitive bursts is the mismatch in the permeabilities of phospholipid membrane for glycerol on the one hand and for either sucrose or glucose on the other.
3.3 Preparing flaccid vesicles
As opposed to spontaneous swelling methods [15, 16], which usually yield a variety of vesicles shapes, both spherical and flaccid, electroformation is generally considered as a method for producing spherical vesicles [30]. If flaccid vesicle shapes are required, one can leave the experimental chamber open for several hours (J. Majhenc, personal communication): as the concentration of the external solution increases due to evaporation, osmotic pressure deflates the vesicle. The procedure is very time-consuming and gives the experimentalist poor control over the intended relative volume of the vesicle.
Here, we propose a method for flaccid vesicle preparation using electroformation which relies on relatively high permeability of the phospholipid membrane for glycerol. The vesicle is initially filled with a mixture of aqueous solutions of a permeable and an impermeable solute, in our case glycerol and sucrose. As long as the composition of the external solution stays the same, this induces no changes of the vesicle shape, as the permeable solute traverses the membrane in equal amount inwards and outwards. Once the composition of the external iso-osmolar solution changes to a lower concentration of the permeable solute, the permeable solute starts to diffuse outwards through the membrane until the concentrations of the permeable solute equilibrates on both sides. In order to maintain the osmotic balance, the water leaves the vesicle as well, thus deflating the vesicle. To illustrate, a vesicle filled with 70% of an impermeable solute (sucrose) and 30% of an permeable solute (glycerol) is expected to deflate to 70% of its initial volume once the external solution changes to an iso-osmolar solution of the impermeable solute (glucose). A sensible parameter which characterizes the shape of the vesicle regardless of its size is the relative volume , which is defined for a vesicle with a volume and a membrane area as the volume , divided by the volume of a sphere with the area ; can attain values from 0 to 1. In the above example, the relative volume of the vesicle is expected to change from 1.0 to 0.7.
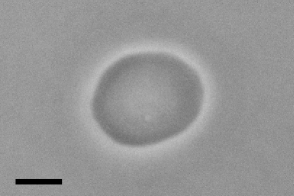
Two kinds of experiments were conducted. In the first experiment, the electroformation chamber was initially filled with a mixture of glycerol and sucrose solutions. The ratios from 70:30 v/v to 90:10 v/v of 0.2 mol/L sucrose and 0.2 mol/L glycerol solutions were tried. After the vesicle were formed, the solution in the electroformation chamber was exchanged with 0.2 mol/L glucose. Although the relative volume of the drained vesicles has not been precisely measured, e.g., with sucking the vesicle into a micropipette or by its deformation in an applied electric field, it was estimated that it was significantly higher than the value which follows from the model. Another problem we encountered was that a majority (estimated at over 90%) of the vesicle obtained by this method was spherical with spherical invaginations rather than flaccid, indicating that a change in the vesicle volume has not been accompanied by a corresponding change in the difference between the outer and the inner membrane leaflet. We believe that the systematically higher relative volume can be related to the detachment stress when the vesicles were teared from the substrate during the draining.
In another experiment, a procedure similar to the preparation of vesicles in a sucrose/glucose solution (described in section 2.2) was used. Vesicles were prepared using the electroformation in a mixture of 0.2 mol/L sucrose and 0.2 mol/L glycerol, ranging from 70:30 v/v to 90:10 v/v. After the electroformation procedure was completed, the chamber was drained and immediately flushed with an iso-osmolar solution of glucose, equal in volume to the volume of the electroformation chamber and the tubing. After dilution, the concentration of glycerol in the external solution dropped to a half of its initial value. Therefore, we expected a change in the relative volume which corresponds to the difference in the glycerol concentration, i.e., a 70:30 mixture is expected to yield vesicles with . As in the above experiment, flaccid vesicles were outnumbered by vesicles with either in- or evaginations. The observed relative volumes were systematically higher in the 70:30 mixture, while more consistent results were obtained in the 90:10 mixture (Fig. 8). With varying the initial and the final concentration of glycerol in the mixture and/or the volume of the solution with which the electroformation chamber is flushed, a more precise control of vesicle volume in the range ought to be possible.
4 Discussion
4.1 Estimating the rate of vesicle interior exchange
Using a quick estimate we can try to verify whether the mechanism proposed by Estes and Mayer ([20], Fig. 6) can fully explain the rapid exchange of glycerol in the vesicle interior with the NaCl from the exterior solution. As an example, we consider a vesicle with a 100 m diameter (), attached to a tether with the length . For simplicity we limit our treatment to the diffusion of glycerol, since its mobility in an aqueous solution is smaller than the mobilities of sodium or chlorine ions, and is thus the rate-limiting factor. If we approximate the glycerol concentration change in the vesicle exterior with a step-wise drop, the concentration of glycerol inside the vesicle would follow exponentially:
Here, is the characteristic time, which can be expressed as a product of the vesicle volume and the “diffusion resistance” of the tether . Here, we treated the vesicle exterior as an infinite reservoir compared to its interior. The latter can in turn be expressed as , being the cross-section of the tether, and the diffusion coefficient for glycerol in water. The diffusion coefficient depends strongly on the temperature and the glycerol concentration, as a rough estimate, the value cm2/s will be taken [31, 32]. Taking into account the above mentioned value for and (the longest tether length reported by Estes and Mayer), and making an estimate (which is likely an overestimate), one obtains s, or approximately 4.5 hours, which exceeds the observed changes on the timescale of minutes by two orders of magnitude. Only the exchange through very short tethers () can be explained by this mechanism, yielding s, or approximately 8 minutes.
Instead, we believe it is necessary to consider the permeability of the phospholipid membrane for glycerol. Carrying out a similar estimate for the membrane permeation, we obtain , with being the vesicle membrane area and the permeability of the phospholipid membrane for glycerol, yielding s, which is close to the experimentally observed values and comparable with the exchange through very short tethers. While the exchange of glycerol was considered rate-limiting during the solute transport through the tether tube, the situation is reversed here. The membrane is much more permeable to glycerol than to anions (permeability of DOPC bilayer for is , [33]), and the membrane permeability to cations is even lower [34]. Even lower is the membrane permeability for sugars (permeability of DMPC bilayer for glucose is , [35]). The latter fact explains why the compositional gradient of vesicles filled with sucrose and immersed in a iso-osmolar sucrose/glucose medium can be preserved for days, yet it also implies that the transport of sugars or ions through the membrane is negligible. This, as well as the fact that Estes and Mayer report that the exchange occured more rapidly in the vesicles closest to the substrate, led us to believe that both pathways contribute to the solute exchange in the vesicle interior.
4.2 Free vs. attached vesicles
While it was customary in earlier works (e.g., [5]) to perform experiments in the same chamber where the electroformation was done, researchers have lately become aware of the fact that the vesicles in the electroformation chamber are attached to the substrate as a rule [30], and thus a comparision with theoretical models valid for free vesicles is doubtful. Instead, they adopted a technique where the vesicles are drained from the electroformation chamber and stored separately. In addition, this offers a possibility to dilute the vesicle suspension from the electroformation chamber with another iso-osmolar solution; a popular combination is electroformation in a sucrose solution and dilution with a glucose solution [22, 36], which allows easier experimentation due to the greater specific weight of vesicles and their easier discrimination from the background in a phase-contrast setup.
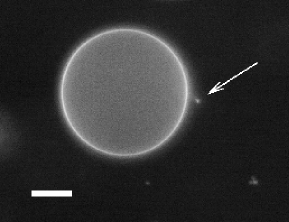
Tethers with which the vesicles are attached to the substrate are torn in the process. Tether residues can be directly visualized. Minutes after draining, small tubular protrusions can still be seen (Fig. 9) on vesicles, which we interpret as remains of tethers with which the vesicles were attached to the substrate. While the re-sealing of the tether on the spot where it was torn away from the substrate probably occurs promptly, the integration of the residual tubular structure into the spherical mother vesicle using relaxation processes usually takes hours [37]. A theoretical model has been proposed to explain this phenomenon [38].
4.3 Metal electrode vs. ITO glass as a substrate
There are two variants of the electroformation in use, both pioneered by Angelova and coworkers. The first one uses a pair of parallel platinum wires as electrodes [1], while the second one utilizes a pair of plan-parallel ITO-coated glasses [5]. The latter method has one obvious advantage: since it exposes a greater surface on which the vesicles can grow, it provides a higher yield, especially if techniques for the uniform spreading of the lipid film are used [39]. In cases where the overall yield is low, e.g., when preparing GUVs in a conductive medium, this advantage can be crucial. Among its disadvantages, one has to mention that ITO-coated glasses can be damaged easily by the Joule heat of the applied electric current, which limits the solution conductivities below those achievable by the setup with platinum electrodes. Another disadvantage is that the optical axis is aligned with the direction of the electric field, which sometimes makes effects like aggregation on the electrodes harder to observe.
5 Conclusions
In this paper, we examined a recently reported method [20] for producing phospholipid GUVs using electroformation, where the solution in the electroformation chamber vesicles is replaced by another solution after or during the electroformation process. By testing the system with different initial and final solutions, we noticed that the exchange of the vesicle interior, as reported by Estes and Mayer, has only been observed in the case where either the initial or the final external solution was a solution of glycerol. That has led us to think that the exchange of vesicle interior can be at least in part attributed to a relatively high permeability of the phospholipid membrane for glycerol rather than being explained solely by the exchange through the tethers with which the vesicles are connected to the substrate.
To test this hypothesis, the permeability of the POPC membrane for glycerol was measured in an experiment where a single GUV was transferred using a micropipette from a 0.2 mol/L sucrose/glucose solution into an iso-osmolar glycerol solution. Videomicroscopy monitoring showed that upon transfer, vesicle radius started to increase until the point where the membrane tensile strength was reached, whereupon the vesicle ejected part of its volume in a burst and its radius returned to its initial value, and the process was repeated over again. We attributed this behaviour to high membrane permeability for glycerol and calculated the permeability of the POPC membrane for glycerol from the observed parameters. The calculated value for permeability lies within the experimental error of an already published value obtained by a different method [28], and is approximately higher than the published value for the membrane permeability for sugars [35], which confirms our initial hypothesis.
In addition, we have demonstrated that a high membrane permeability for glycerol can be utilized for preparing flaccid vesicles, where electroformation was conducted in a mixed sucrose/glycerol solution and later exchanged with an iso-osmolar glucose solution. This shows that the electroformation method in a flow chamber introduced by Estes and Mayer [20] is a powerful method which can be deployed to many different situation; among those, the preparation of GUVs in a pH gradient [40, 41, 13], which opens way to new experiments.
Appendix A Estimating the field in the electroformation chamber
An estimate of the electric field in the electroformation chamber with the geometry shown in Fig. 1 can be most easily obtained in the bipolar coordinate syetem [42]. The relation between the bipolar and the Cartesian coordinates:
| (13) | |||||
| (14) |
Equations represent circles with the foci at or . The coordinate is “radial”, with in and in , while the coordinate is an angular one, . The surface of the cylindrical electrode corresponds to a certain value of , here denoted by for positive values of ( corresponds to the electrode described by negative values of ). The parameters and can be related to the electrode radius and the distance between the electrodes:
| (15) | |||||
| (16) |
The advantage of the chosen coordinate system is that the Laplace equation for the electric potential separates in the given geometry, when expressed in terms of . Requiring , , one obtains:
| (17) |
Hence the field
| (18) | |||||
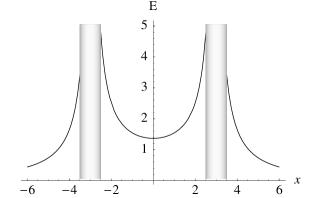
with being the corresponding metrical coefficient. Fig. 10 depicts the calculated electric field between two parallel cylinders in an unconfined space filled with a homogeneous medium. On the axis connecting the centres of the two electrodes, the electric field on the outer side is approximately 71% of its value on the inner side.
For a more realistic model of the field inside the electroformation chamber, one would need to take into account the proximity of chamber walls, which contribute to an increase of the field between the electrodes, since glass is less conductive than the aqueous medium. Another factor that affects the field in the electroformation chamber is the layer of lipid adsorbed to the electrodes, which decreases the field in the aqueous medium, as most of the voltage drop occurs in the lipid layer. In particular for the assesment of the effect of the geometrical confinement, numerical modelling is required.
Acknowledgement
The authors thank Dr. Janja Majhenc and Dr. Mojca Mally for helpful discussions. This work has been supported by the Slovenian Research Agency grant P1-0055.
References
- [1] M. I. Angelova, D. S. Dimitrov, Liposome electroformation, Faraday Discuss. Chem. Soc. 81 (1986) 303–311.
- [2] P. L. Luisi, P. Walde (Eds.), Giant vesicles, Vol. 6 of Perspectives in supramolecular chemistry, John Wiley and Sons, Chicester, 2000.
- [3] M. I. Angelova, D. S. Dimitrov, Lipid swelling and liposome formation on solid surfaces in external electric fields, Prog. Colloid Polym. Sci. 73 (1987) 48–56.
- [4] M. I. Angelova, D. S. Dimitrov, A mechanism of liposome electroformation, Prog. Colloid Polym. Sci. 76 (1988) 59–67.
- [5] M. I. Angelova, S. Soléau, P. Méléard, J. F. Faucon, P. Bothorel, Preparation of giant vesicles by external AC electric fields. Kinetics and applications., Prog. Colloid Polym. Sci. 89 (1992) 127–131.
- [6] M. I. Angelova, Liposome electroformation, in: Luisi and Walde [2], Ch. 3, pp. 27–36.
- [7] P. Taylor, C. Xu, P. D. I. Fletcher, V. N. Paunov, Fabrication of 2D arrays of giant liposomes on solid substrates by microcontact printing, Phys. Chem. Chem. Phys. 5 (2003) 4918–4922.
- [8] D. J. Estes, S. R. Lopez, A. O. Fuller, M. Mayer, Triggering and visualizing the aggregation and fusion of membranes in microfluidic chambers, Biophys. J. 91 (2006) 233–243.
- [9] K. Kuribayashi, G. Tresset, P. Coquet, H. Fujita, S. Takeuchi, Electroformation of giant liposomes in microfluidic channels, Meas. Sci. Technol. 17 (12) (2006) 3121–3126.
- [10] Y. Okumura, H. Zhang, T. Sugiyama, Y. Iwata, Electroformation of giant vesicles on a non-electroconductive substrate, J. Am. Chem. Soc. 129 (6) (2007) 1490–1491.
- [11] L. A. Bagatolli, T. Parasassi, E. Gratton, Giant phospholipid vesicles: comparison among the whole lipid sample characteristics using different preparation methods. A two photon fluorescence microscopy study, Chem. Phys. Lipids 105 (2000) 135–147.
- [12] A. Fischer, P. L. Luisi, T. Oberholzer, P. Walde, Formation of giant vesicles from different kinds of lipids using the electroformation method, in: Luisi and Walde [2], Ch. 3, pp. 37–43.
- [13] L. Mathivet, S. Cribier, P. F. Devaux, Shape change and physical properties of giant phospholipid vesicles prepared in the presence of an AC electric field, Biophys. J. 70 (1996) 1112–1121.
- [14] N. Rodriguez, F. Pincet, S. Cribier, Giant vesicles formed by gentle hydration and electroformation: A comparison by fluorescence microscopy, Colloids Surfaces B: Biointerfaces 42 (2005) 125–130.
- [15] J. P. Reeves, R. M. Dowben, Formation and properties of thin-walled phospholipid vesicles, J. Cell. Physiol. 73 (1969) 49–60.
- [16] D. Needham, E. Evans, Structure and mechanical properties of giant lipid (DMPC) vesicle bilayers from 20 ∘C below to 10 ∘C above the liquid crystal-crystalline phase transition at 24 ∘C, Biochemistry 27 (1988) 8261–8269.
- [17] K.-i. Akashi, H. Miyata, H. Itoh, K. Kinosita, Jr., Preparation of giant liposomes in physiological conditions and their characterization under an optical microscope, Biophys. J. 71 (1996) 3242–3250.
- [18] A. Moscho, O. Orwar, D. T. Chiu, B. P. Modi, R. N. Zare, Rapid preparation of giant unilamellar vesicles, Proc. Natl. Acad. Sci. USA 93 (1996) 11443–11447.
- [19] Y. Yamashita, M. Oka, T. Tanaka, M. Yamazaki, A new method for the preparation of giant liposomes in high salt concentrations and growth of protein microcrystals in them, Biochim. Biophys. Acta 1561 (2002) 129–134.
- [20] D. J. Estes, M. Mayer, Giant liposomes in physiological buffer using electroformation in a flow chamber, Biochim. Biophys. Acta 1712 (2005) 152–160.
- [21] V. Heinrich, R. E. Waugh, A piconewton force transducer and its application to measurement of the bending stiffness of phospholipid membranes, Ann. Biomed. Eng. 24 (5) (1996) 595–605.
- [22] M. Mally, J. Majhenc, S. Svetina, B. Žekš, Mechanisms of equinatoxin II-induced transport through the membrane of a giant phospholipid vesicle, Biophys. J. 83 (2) (2002) 944–953.
- [23] M. Mally, J. Majhenc, S. Svetina, B. Žekš, The response of giant phospholipid vesicles to pore-forming peptide melittin, Biochim. Biophys. Acta 1768 (2007) 1179–1189.
- [24] M. M. Koslov, V. S. Markin, A theory of osmotic lysis of lipid vesicles, J. Theor. Biol. 109 (1984) 17–39.
- [25] E. A. Evans, R. Skalak, Mechanics and thermodynamics of biomembranes, CRC Press, Boca Raton, 1980.
- [26] K. Olbrich, W. Rawicz, D. Needham, E. Evans, Water permeability and mechanical strength of polyunsaturated lipid bilayers, Biophys. J. 79 (1) (2000) 321–327.
- [27] M. Bloom, E. Evans, O. G. Mouritsen, Physical properties of the fluid lipid-bilayer component of cell-membranes—a perspective, Q. Rev. Biophys. 24 (3) (1991) 293–397.
- [28] S. Paula, A. G. Volkov, A. N. Van Hoek, T. H. Haines, D. W. Deamer, Permeation of protons, potassium ions, and small polar molecules through phospholipid bilayers as a function of membrane thickness, Biophys. J. 70 (1996) 339–348.
- [29] E. Orbach, A. Finkelstein, The nonelectrolyte permeability of planar lipid bilayer, J. Gen. Physiol. 75 (1980) 427–436.
- [30] R. Dimova, S. Aranda, N. Bezlyepkina, V. Nikolov, K. A. Riske, R. Lipowsky, A practical guide to giant vesicles. Probing the membrane nanoregime via optical microscopy, J. Phys.: Condens. Matter 18 (2006) S1151–S1176.
- [31] G. Ternström, A. Sjöstrand, G. Aly, A. Jernqvist, Mutual diffusion coefficients of water + ethylene glycol and water + glycerol mixtures, J. Chem. Eng. Data 41 (4) (1996) 876–879.
- [32] G. D’Errico, O. Ortona, F. Capuano, V. Vitagliano, Diffusion coefficients for the binary system glycerol + water at 25 ∘C. a velocity correlation study, J. Chem. Eng. Data 49 (6) (2004) 1665–1670.
- [33] S. Paula, A. G. Volkov, D. W. Deamer, Permeation of halide anions through phospholipid bilayers occur by the solubility-diffusion mechanism, Biophys. J. 74 (1998) 319–327.
- [34] D. W. Deamer, J. Bramhall, Permeability of lipid bilayers to water and ionic solutes, Chem. Phys. Lipids 40 (1986) 167–188.
- [35] G. J. M. Bresseleers, H. L. Goderis, P. P. Tobback, Measurement of the glucose permeation rate across phospholipid bilayers using small unilamellar vesicles, Biochim. Biophys. Acta 772 (3) (1984) 374–382.
- [36] K. A. Riske, R. Dimova, Electro-deformation and poration of giant vesicles viewed with high temporal resolution, Biophys. J. 88 (2005) 1143–1155.
- [37] V. Kralj-Iglič, G. Gomišček, J. Majhenc, V. Arrigler, S. Svetina, Myeline-like protrusions of giant phospholipid vesicles prepared by electroformation, Colloids Surfaces A: Physicochem. Eng. Aspects 181 (2001) 315–318.
- [38] B. Božič, G. Gomišček, V. Kralj-Iglič, S. Svetina, B. Žekš, Shapes of phospholipid vesicles with beadlike protrusions, Eur. Biophys. J. 31 (2002) 487–496.
- [39] D. J. Estes, M. Mayer, Electroformation of giant liposomes from spin-coated films of lipids, Colloids Surfaces B: Biointerfaces 42 (2005) 27–35.
- [40] M. J. Hope, T. E. Redelmeier, K. F. Wong, W. Rodrigueza, P. R. Cullis, Phospholipid asymmetry in large unilamellar vesicles induced by transmembrane pH gradients, Biochemistry 28 (1989) 4181–4187.
- [41] T. E. Redelmeier, M. J. Hope, P. R. Cullis, On the mechanism of transbilayer transport of phosphatidylglycerol in response to transmembrane pH gradients, Biochemistry 29 (1990) 3046–3053.
- [42] P. M. Morse, H. Feshbach, Methods of theoretical physics, Vol. II, McGraw-Hill, New York, 1953, Ch. 10, p. 1210.