Molecules in Space & Laboratory
The Horsehead mane: Towards
an observational benchmark for chemical models
1 The intrinsic complexity of chemical models
Photodissociation region (PDR) models are used to understand the evolution of the FUV illuminated matter both in our Galaxy and in external galaxies. To prepare for the unprecedented spatial and spectroscopic capabilities of ALMA and Herschel, two different kinds of progresses are currently taking place in the field. First, numerical models describing the chemistry of a molecular cloud are being benchmarked against each other to ensure that all models agree not only qualitatively but also quantitatively on at least simple cases111See also http://www.ph1.uni-koeln.de/pdr-comparison/intro1.htm (Röllig et al. 2007). Second, new or improved chemical rates are being calculated/measured by several theoretical and experimental groups. However, the difficulty of this last effort implies that only a few reactions (among the thousand ones used in chemical networks) can be thoroughly studied. New numerical tools are thus being developed for taking into account the impact of the uncertainties of the chemical rates on the chemical model predictions, and their comparison with observed abundances (e.g. Wakelam et al. 2005, 2006). In view of the intrinsic complexity of building reliable chemical networks and models, there is an obvious need of well-defined observations that can serve as basic references. PDRs are particularly well suited to serve as references because they make the link between diffuse and dark clouds, thus enabling to probe a large variety of physical and chemical processes.
2 The Horsehead edge as a chemical laboratory
| Species | (RA,Dec) | (,) | Angular Res. | Col. Dens. | Abundance |
| [arcsec] | [arcsec] | [arcsec] | [] | ||
| H2 | 12 | 0.5 | |||
| C18O | 1.4 | ||||
| CCH | 1.5 | ||||
| c-C3H2 | 1.3 | ||||
| C4H | 5.2 | ||||
| H2 | 12 | 0.5 | |||
| C18O | 1.9 | ||||
| CCH | 1.4 | ||||
| c-C3H2 | 1.1 | ||||
| C4H | 1.9 | ||||
| H2 | 12 | 0.5 | |||
| C18O | 1.1 | ||||
| CCH | 1.0 | ||||
| c-C3H2 | 4.3 | ||||
| C4H | 3.7 | ||||
| CS | 10 | 2.5 | |||
| C34S | 16 | 1.2 | |||
| HCS+ | 29 | 2.0 | |||
| H13CO+ | |||||
| DCO+ | 12 | ||||
| CS | 10 | 3.9 | |||
| C34S | 16 | 1.8 | |||
| HCS+ | 29 | 2.3 | |||
| CS | 10 | 6.0 | |||
| C34S | 16 | 2.5 | |||
| HCS+ | 29 | 3.8 |
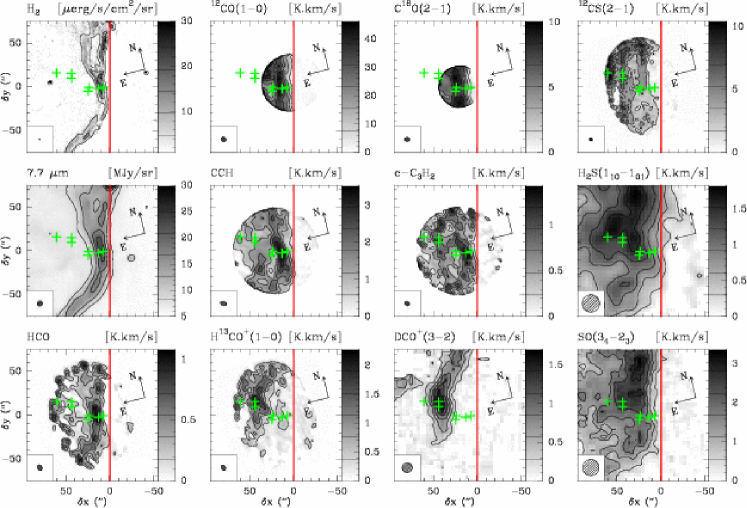
The illuminated edge (PDR) of the western condensation presents one of the sharpest infrared filament (width: or 0.02) detected in our Galaxy by ISOCAM. The most straightforward explanation given by Abergel et al. (2003) is that most of the dense material is within a flat structure viewed edge-on and illuminated in the plane of the sky by Ori. The H2 fluorescent emission observed by Habart et al. (2005) is even sharper (width: ), implying the inclination of the PDR on the plane-of-sky to be less than 5∘. The Horsehead ridge thus offers the opportunity to study at small linear scales ( corresponds to 0.002 at 400) the physics and chemistry of a PDR with a simple geometry, very close to the prototypical kind of source needed to serve as a reference to chemical models. Since 2001, we started to study the Horsehead PDR mainly with the IRAM Plateau de Bure interferometer at 3 and the IRAM-30m at 1 achieving spatial resolutions from 3 to (except the H2 fluorescent emission observed at -resolution with the NTT/SOFI instrument). Figure 1 displays all the observed, high resolution maps already acquired. Those maps trace the different layered structures predicted by photochemical models according to chemical reaction networks, excitation conditions and radiative transfer.
Abergel et al. (2003) deduced from the distance between Ori and the PDR that the intensity of the incident far UV radiation field is relative to the interstellar radiation field in Draine’s units. Through the modelling of the H2 and CO emission, Habart et al. (2005) showed that the PDR has a very steep density gradient, rising to in less than (\ie 0.02), at a roughly constant pressure of . These observations were followed by a chemical study of small hydrocarbons (CCH, c-C3H2, C4H). Pety et al. (2005) showed that the abundances of the hydrocarbons are higher than the predictions based on pure gas phase chemical models (Le Petit et al. 2002 and reference therein). These results could be explained either by the photoerosion of the large aromatic molecules and/or small carbon grains (C. Joblin, 2007, this volume) or by a turbulent mixing which would transport in the illuminated part of the PDR molecules after their productions in the dark part (M. Gerin, 2007, this volume). Goicoechea et al. (2006) linked the PDR model predictions with detailed non-LTE, nonlocal excitation and radiative transfer models adapted to the Horsehead geometry. They showed that the gas sulfur depletion invoked to account for CS and HCS+ abundances is orders of magnitude lower than in previous studies of the sulfur chemistry.
Finally, Pety et al. (2007) studied the deuterium fractionation in the Horsehead edge from observations of several H13CO+ and DCO+ lines. A large [DCO+]/[HCO+] abundance ratio is inferred at the DCO+ emission peak, a condensation shielded from the illuminating far-UV radiation field where the gas must be cold (10–20) and dense (). DCO+ is not detected in the warmer photodissociation front, implying a lower [DCO+]/[HCO+] ratio (). To our knowledge, this is the brightest DCO+ emission (4) detected in an interstellar cloud close (angular distance ) to a bright H2/PAH emitting region. This opens the interesting possibility to probe at high resolution the chemical transition from far-UV photodominated gas to “dark cloud” shielded gas in a small field of view.
3 Towards an observational benchmark
An ideal observational benchmark would deliver to chemists a set of abundances (with the associated uncertainties) as a function of the distance (or extinction) to the illuminating star. This goal is difficult to achieve for several reasons: 1) The geometry of the source is never as simple as wished when it is known at all; 2) The spectra produced by the instruments must be inverted to obtain abundances; 3) The spectra are often measured at very different angular resolutions, implying beam dilution and/or mixing of different gas components. For several years now, we have started to systematically study the western edge of the Horsehead nebula because its geometry is not only well understood but also quite simple (almost 1D and viewed edge-on). The density profile across the PDR is well constrained and there are several current efforts to constrain the thermal profile. The combination of low distance to Earth (400), low illumination () and high density () implies that all the interesting physical and chemical processes can be probed in a field-of-view of less than with typical spatial scales ranging between 1 and .
All those observations are done by the same team, using the same instruments (mainly IRAM Plateau de Bure and 30m) and the same methods both of data reduction and data analysis. For each species, we are trying to observe several transitions at similar angular resolutions (from 5 to ) to constrain properly the excitation conditions and derive accurate column densities and abundances. Obtaining emission maps when possible has proved essential to understand the spatial distributions of the species. We are preparing the public release of cuts of spectra so that the radiative transfer analysis can be refined as knowledge of collisional rates progresses. In the meantime, Table 1 is our first attempt at quantitatively summarizing the results obtained up to now. In the future, the zoom capacity and resolving power of ALMA will enable to measure many different specie transitions at a resolution of , enabling to resolve all the physical and chemical gradients.
References
- [1] Abergel, A., Teyssier, D., et al. A&A, 410, 577
- [2] Goicoechea, J. R., Pety, J., Gerin, et al. 2006, A&A, 456, 565
- [3] Goicoechea, J. R., & Le Bourlot, J. 2007, A&A, 467, 1
- [4] Habart, E., Abergel, A., Walmsley, C. M., Teyssier, D., & Pety, J. 2005, A&A, 437, 177
- [5] Le Petit, F., Roueff, E., & Le Bourlot, J. 2002, A&A, 390, 369
- [6] Pety, J., Teyssier, D., Fossé, et al. 2005, A&A, 435, 885
- [7] Pety, J., Goicoechea, J. R., Hily-Blant, P., Gerin, M., Teyssier, D., 2007, A&A, 464, L41
- [8] Röllig, M., Abel, N. P., Bell, T., et al. 2007, A&A, 467, 187
- [9] Wakelam, V., Herbst, E., & Selsis, F. 2006, A&A, 451, 551
- [10] Wakelam, V., Selsis, F., Herbst, E., & Caselli, P. 2005, A&A, 444, 883