The Rapid Outbursting Star GM Cep: An EX-or in Tr 37?
Abstract
We present optical, IR and millimeter observations of the solar-type star 13-277, also known as GM Cep, in the 4 Myr-old cluster Tr 37. GM Cep experiences rapid magnitude variations of more than 2 mag at optical wavelengths. We explore the causes of the variability, which seem to be dominated by strong increases in the accretion, being similar to EX-or episodes. The star shows high, variable accretion rates (up to 10-6 M⊙/yr), signs of powerful winds, and it is a very fast rotator (V43 km/s). Its strong mid-IR excesses reveal a very flared disk and/or a remnant envelope, most likely out of hydrostatic equilibrium. The 1.3 millimeter fluxes suggest a relatively massive disk (M0.1 M⊙). Nevertheless, the millimeter mass is not enough to sustain increased accretion episodes over large timescales, unless the mass is underestimated due to significant grain growth. We finally explore the possibility of GM Cep having a binary companion, which could trigger disk instabilities producing the enhanced accretion episodes.
1 Introduction
The open cluster Tr 37 is one of the best studied intermediate-aged young star formation regions. Aged 4 Myr (Sicilia-Aguilar et al. 2004, 2005; hereafter Paper I, Paper II), and located at 900 pc distance (Contreras et al. 2002), it contains a rich population of T Tauri stars (TTS; 180 members with spectral types G to M2) of which about 48% still show IR excesses consistent with protoplanetary disks at different evolutionary stages (Sicilia-Aguilar et al. 2006a, b; hereafter Paper III, Paper IV). While most of the stars in Tr 37 show important evidence of disk evolution, with lower accretion rates and near-IR excesses than in younger regions, a few objects still display characteristics of much younger systems. The most remarkable one is the solar-type star 13-277, also called GM Cep (Morgenroth 1939). Because of its spatial location within the cluster, it belongs most likely to the Tr 37 main population, with average ages 4 Myr (85% of the population is older than 2 Myr, and 95% is older than 1 Myr), rather than to the young population associated to the Tr 37 globule, aged 1 Myr (Paper II). Its continuum spectrum and the strong and broad H emission suggested an accretion rate Ṁ3 10-7 M⊙/yr, about 2 orders of magnitude over the median accretion rate of TTS in Tr 37 (Paper IV). Its bolometric luminosity (L26 L⊙ in 2000) is about 1 order of magnitude higher than other stars with similar late G-early K spectral type. Finally, we notice an unusually high mid-IR flux for a solar-type star: its MIPS flux at 70 m is comparable to that of the Tr 37 Herbig Be star MVA-426, being one of the only four cluster members detected at this wavelength (Paper III).
All observations suggest that GM Cep is a variable star of the EX-or type, with an unstable disk and variable accretion rate, which is remarkable in an “old” cluster like Tr 37, where disk evolution seems ubiquitous. FU-ors and EX-or objects have been suggested to be either normal stages within the very early TTS evolution (see Hartmann & Kenyon 1996 for a review) or a special type of young object, probably binary (Herbig 2003 and references therein). Here we present the results of our photometry monitoring campaign during 2006-2007111Based on observations collected at the German-Spanish Astronomical Center, Calar Alto, jointly operated by the Max-Planck-Institut für Astronomie Heidelberg and the Instituto de Astrofísica de Andalucía (CSIC), lucky imaging, millimeter continuum, and 12CO data, together with optical spectra (high- and low-resolution), and a compilation of the data available from the literature. The multiwavelength data are described in Section 2. In Section 3 we explore the characteristics of the star: optical and IR variability, spectral type, accretion, winds, disk mass, and potential companions. Section 4 discusses the possible causes of variability and the comparison with similar stars, and in Section 5 we summarize our results.
2 Observations and Data Reduction
2.1 Data from the Literature
The photometric data and epochs available for GM Cep are given in Table 1. The first reference to GM Cep, Morgenroth (1939), classifies it as a “long-period variable” with visual magnitudes 13.5-15.5, although no epoch nor period are mentioned. Suyarkova (1975) studied the light variations over several months, detecting rapid variations (days to weeks) between 14.2 and 16.4 mag, mixed with stability periods up to 100 days at both the lower and the upper magnitude. Kun (1986) lists the star among the variables in Cep OB2, providing V photometry for three epochs. The databases Vizier, Simbad, and SuperCosmos list optical photometric data from the USNO-A2.0, USNO-B1.0, GSC2.2, and SuperCosmos catalogs, plus IR data from IRAS and MSX6C (Egan et al. 2003). There are two mentions of GM Cep in the amateur database of the American Association of Variable Star Observers (AAVSO), but they do not add any extra information to our data. Our previous studies of Tr 37 include optical photometry taken with the 1.2m telescope at the Fred Lawrence Whipple Observatory (FLWO) between 2000 and 2004 (Paper I, II), low resolution optical spectroscopy taken with the FAST spectrograph on the 1.5m telescope at the FLWO (Paper I), high-resolution optical spectroscopy from Hectochelle/MMT at the FLWO (Paper IV), and IRAC and MIPS data from our Spitzer study (Paper III). We also include the near-IR data from 2MASS, presented in Paper I. All these data confirmed the variability of GM Cep and the presence of strong IR excesses from a very luminous disk.
In order to compare the data from the different studies in Table 1, we transformed the photographic and CCD data from different filters into the UBVRcIc system, which is the closest match to the data prior to 1986. The photographic R63F and R59F red data are comparable to the modern Rc filter. Rc-R63F=0.096 and 0.081 mag, for giants and dwarfs, respectively, and Rc-R59F=-0.031 (Bessell 1986). Following Blair & Gilmore (1982), Rc=R63F if Rc-I0.9 mag (for GM Cep, Rc-Ic 0.8 mag). The GG395-Bj photographic passband is similar to the Johnsons B filter, although the zero point is different (Bessell et al. 1986). The errors involved in these conversions are less than 0.1 mag, below the typical errors from the photographic plates and well below the observed variations of GM Cep. For the modern observations, when contemporary V magnitude is available, RJ and IJ can be transformed into Rc and Ic for comparison (Bessel 1979; Fernie 1983) with errors under 0.01 mag for R, and around 0.1-0.2 mag for I.
2.2 Optical Photometry
The first set of optical observations was taken with the KING 70 cm telescope of the Max-Planck-Institut für Astronomie, at the Königstuhl in Heidelberg (see Table 1). The telescope has a field of view of 18’x18’, and is equipped with a Loral CCD L3-W17 detector and a set of standard UBVRJIJ filters. The filters have very small color transform coefficients, and the second order extinction is almost zero, so relative photometry is feasible. Exposure times ranged from 30s to 3 x 120s depending on filter and weather conditions. We also obtained VRJIJ photometry (Table 1)with the CAFOS imager on the 2.2m telescope in Calar Alto (Director’s Discretionary Time, DDT), which covers a field of view of diameter 16’. Taking 3 x 10 s or 3 x 30s exposures, we reach similar magnitude and area coverage as the Königstuhl observations.
The data were reduced following standard routines within the IRAF222IRAF is distributed by the National Optical Astronomy Observatories, which are operated by the Association of Universities for Research in Astronomy, Inc., under cooperative agreement with the National Science Foundation. tasks noao.imred.ccdred to do the bias and flat field corrections. Aperture photometry was performed within IRAF noao.digiphot.apphot, and the data in each band were calibrated via relative photometry, comparing with our previous observations from the FLWO (Paper I). Depending on the night and instrument, 150-800 stars were used for calibrating VRI, and 20-200 for B and U. Since the FLWO observations used the UVRcIc filters, the Rc and Ic bands were transformed into the Johnsons system (Fernie 1983; Bessel 1979). Taking into account the large number of stars involved in the calibration, the errors derived from band transformation are minimal and the final error is dominated by the signal to noise, being typically less than 0.01 mag. Due to the lack of calibrated B data in the FLWO survey, we used the B photometry from the literature for the relative photometry. About 150 stars with B band photometry are listed by SIMBAD, mostly bright objects from the Marshall & Van Altena (1987) catalog. Only 15 of these stars are not saturated in the Königstuhl frames and could be used for calibration. Whereas this is insufficient for studying colors, the relative changes between different nights are unaffected.
2.3 Optical Spectroscopy: HIRES/Keck and CAFOS/2.2m
GM Cep was observed with the high-resolution spectrograph HIRES mounted on Keck I on 2001 June 30. The spectra were taken before the HIRES upgrades in 2004, using the rg610 filter and a 1.148” slit, which provides a wavelength coverage between 6350 and 8750 Å , with some gaps in between orders, and a resolution R 34,000. The resolution is similar to that of Hectochelle/MMT (Sicilia-Aguilar et al. 2005a; Paper IV), but the wavelength coverage is much larger, including the H and Li I 6708Å regions, several forbidden lines ([O I] at 6368 Å, [S II] at 6717 and 6731 Å, [N II] at 6548 and 6583 Å), the Ca II IR lines at 8498 and 8662 Å, and numerous photospheric absorption lines. The exposure time was 3 x 900 s. The data was reduced using the MAKEE Keck Observatory HIRES data reduction software, developed by T. Barlow. The wavelength calibration was done with a ThAr lamp, being accurate up to 1-2 km/s. No flux calibration was required.
A low-resolution spectrum was taken with the CAFOS camera in the long-slit spectroscopic mode on the 2.2m telescope as a part of our Calar Alto DDT program. We used the B-100, G-100, and R-100 grisms, resulting in a wavelength coverage from 3200 to 9000 Å with no gaps and some overlap, and a resolution of 2 Å per pixel (Figure 1). The spectra were reduced using the standard IRAF tasks (noao.imred.ccdred and specred.twodspec), and a wavelength solution was derived using a HgHeRb lamp. A total of 3 x 600 s exposures were taken with each grism, in order to achieve a good cosmic ray removal. In addition, we obtained two CAFOS acquisition images in V and RJ, with exposure times of 60s. These two images, although lower in quality and with a smaller field of view than the standard CAFOS imaging, were reduced and calibrated using the techniques from Section 2.2, to provide simultaneous photometry.
2.4 Lucky Imaging with AstraLux
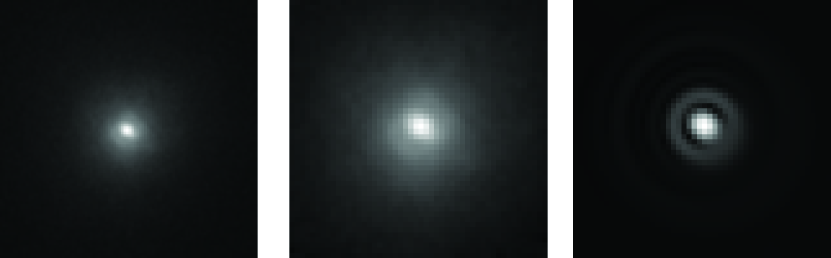
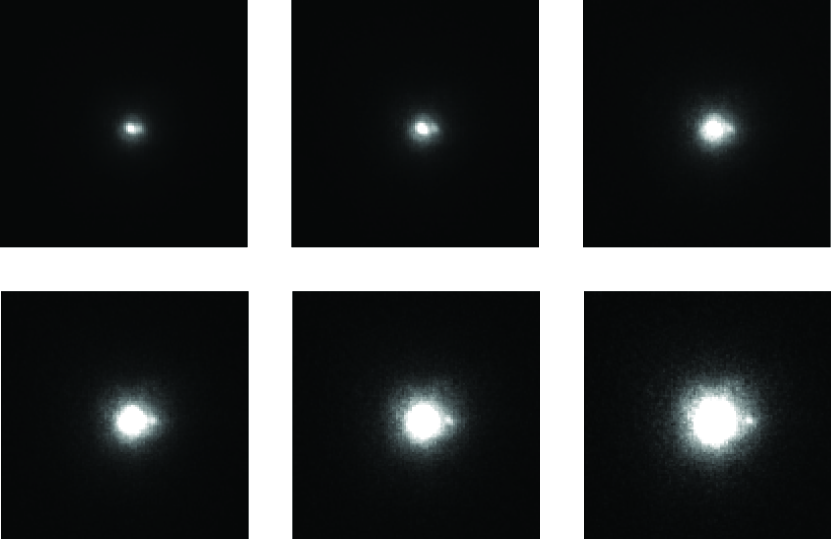
In order to look for wide- and intermediate-distance companions, we observed GM Cep with the high spatial resolution Lucky Imaging camera AstraLux, operating at the 2.2m telescope in Calar Alto. AstraLux is a high-speed camera with an electron multiplying CCD, which allows full frame rates of up to 34 Hz with virtually zero readout noise. It has a field of view of 24”24” at a pixel scale of 47 mas/px. The AstraLux data consist typically of several thousands single frames with integration times between 15 and 100 ms. Software post-processing selects the frames which are least affected by distortions due to atmospheric turbulence, by measuring the Strehl ratio in each single frame. The high-quality frames ( 1–5% of all images) are combined to a final result with improved angular resolution and Strehl ratio (Lucky Imaging technique; Tubbs et al. 2002; Law et al. 2006). Under good seeing conditions and with the SDSS z’ filter, AstraLux provides spatial resolution better than 100 mas and Strehl ratios of up to 25%, depending on the magnitude. Observations of GM Cep were conducted in July and November 2006, and May and June 2007 (see Tables 1 and 2 for details). Though the November 2006 data is slightly affected by atmospheric dispersion, leading to an elongated PSF, the superb seeing of 0.6” still resulted in a Strehl ratio of 14%. Figure 2 shows the November 2006 data together with a simulated theoretical PSF, including atmospheric dispersion effects. We present a detailed analysis of these data in Section 3.6.
2.5 JHK Photometry
Near-IR photometry was obtained with the IR camera CAIN-2 at the 1.52m Carlos Sánchez telescope in the Teide Observatory (Canary Islands) during 5 nights in early June 2007 (see Table 1). Observations in the J H and Ks bands consist of 5 dithered exposures around GM Cep to ensure proper sky image subtraction. For each dither point we took several frames using short exposure time to avoid saturation, which were later averaged to obtain the final reduced image. The minimum exposure time was 1 s for individual exposures and the total integration time per filter was about 6 min. The data were reduced using the package caindr developed within IRAF by J.A. Acosta-Pulido. The processing included sky subtraction, flatfielding and combination of the dither positions. Aperture photometry was done, and the relative photometry calibration was based on 5 to 13 nearby IR sources taken from the 2MASS catalog. The errors derived from this procedure are dominated by the background and CCD read noise, ranging from 0.1 to 0.01 mag depending on weather conditions. The star remained stable during the whole run (see Table 3), taking into account the errors, and its magnitude was similar to the 2MASS 2001 data. Similar stability over a few days had been observed in the optical data taken in September 2000. Simultaneous optical observations cover only 1 of the nights, during which the star was near maximum.
2.6 IRAM 1.3 Millimeter Continuum
We observed GM Cep at the IRAM 30m telescope in Pico Veleta using the 37 channel bolometer, MAMBO-1. The observations were done during night time, at 4:18h UT on June 2nd 2006, and 2:58h on June 3rd. The opacity at zenith was Tau=0.4. Each observation consisted of a 20 min integration standard onoff, with 10 min integration on source. The wobbler throw for the off position was 32” and 50”, respectively, so the off measurement falls in different locations, to avoid the potential contamination from other sources. The data were reduced using the MOPSIC software, developed by R. Zylka for the 30m bolometer data. The pointing and flux calibration were done with the sources LK H 234, Cep A, and NGC 7538 from the IRAM Pool catalog, and the planet Uranus. The final flux at 1.3mm is 13.9 1.0 mJy. The 1.3 millimeter continuum observations are analyzed in Section 3.4.
2.7 IRAM 12CO(1-0) and 12CO(2-1) Observations
We also observed GM Cep with the heterodyne receivers at the 30m IRAM telescope. The observations were performed under fair weather conditions on June 3rd (UT 7:00-8:15), June 4th (UT 7:30-9:20), and June 5th (UT 8:00-10:00). We used the standard onoff mode with wobbler shift, that results in better baselines, with wobbler throws from 70” to 120”. We used the highest resolution mode available (2 km/s), and the backends A100, B100 (for frequencies around 115 GHz) and A230, B230 (for frequencies around 230 GHz). The instrument allows to observe two frequencies simultaneously, which we tuned to the 12CO(1-0) and 12CO(2-1) transitions. Since the LRS velocity of the source (considering the average cluster CZ=-15.03.6 km/s) at the time of the observation was around 0 km/s, the receivers were tuned to 115.271-115.275 GHz and 230.538-230.543 GHz, varying the central frequencies during different integrations to avoid that the line falls always on the same place on the detector. The total integration time was 4 h, with 2h on source. For pointing and calibration, we observed the standard sources J2253+161, NGC 7027, and Cep A, from the IRAM Pool catalog.
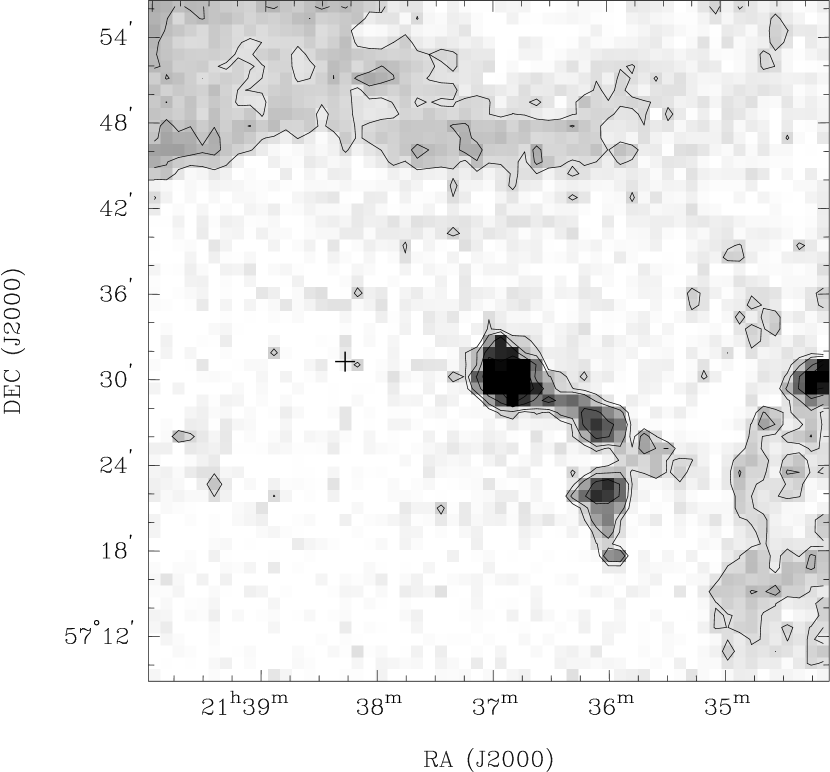
The data were reduced using the CLASS software within the GILDAS package, specially developed for the reduction of IRAM heterodyne data. The single scans were examined to remove the bad ones, matched in frequency, and added. The baseline was fitted as a 1-order polynomial and subtracted. The reduced data is plotted in Figure 3. The 12CO(1-0) is identified as a 5 detection with peak value 0.3mJy, but the weaker 12CO(2-1) transition is not detected. No line broadening was observed for the 12CO(1-0), which may be an effect of the weakness of the detection, and/or a consequence of the inclination of the object. In addition to the 5 emission, we find a 4 absorption around the line. This absorption does not seem to originate in a single point in the off position, given the changes in the wobbler throw and its position angles. A possible explanation would be the presence of substantial amounts of gas in the Tr 37 bubble. According to the work of Patel et al. (1998) using the 14m FCRAO antenna, the region around GM Cep is relatively clean (Figure 3 right). Nevertheless, the sensitivity of the 30m is more than double than the FCRAO, so the absorption could be due to gas emission in the expanding IC 1396 H II region barely detected in the FCRAO maps. The 12CO lines are weaker than expected in typical disks for the same 1.3 mm continuum emission, which could be due to oversubtraction of ambient 12CO emission, and is difficult to correct without deep mapping of the area.
3 Analysis
3.1 The Lightcurve: Outburst History
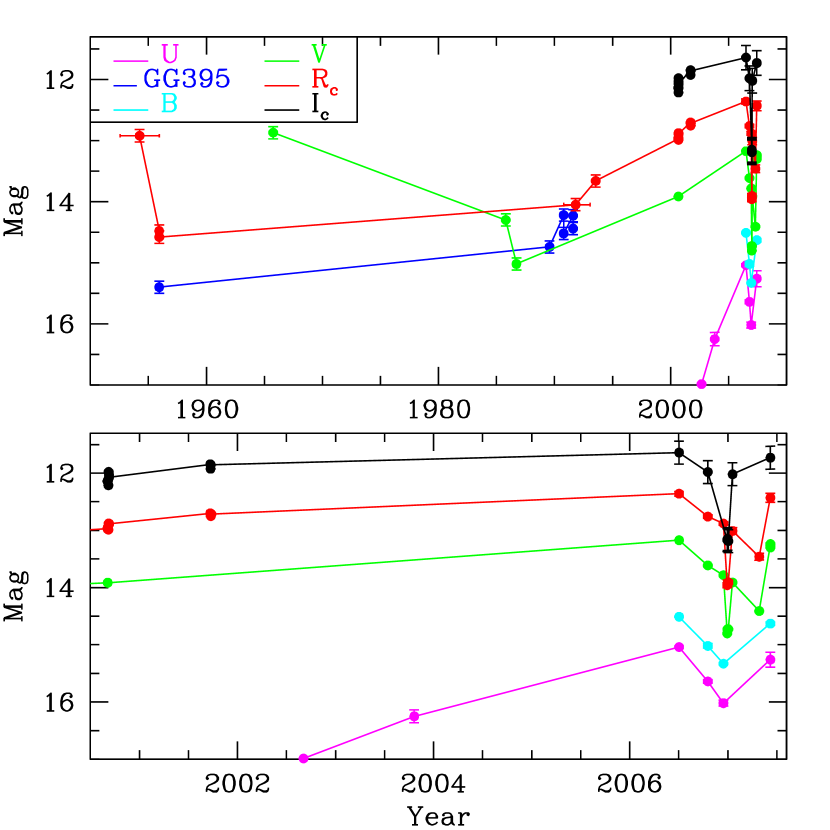
The lightcurve of GM Cep is depicted in Figure 4. The star suffers rapid and repeated irregular variations in all bands, with amplitudes 2-2.5 mags. It increased in brightness after 1986, reached a low magnitude level in 2002, and raised between 2003 and July 2006. From July 2006 on, when our time sampling is better, GM Cep experienced a decrease in magnitude, followed by a 1 mag increase in January 2007, a further decline by April 2007, increasing again to near-maximum levels by June 2007. The changes in magnitude can be very rapid (0.1 mag in consecutive days in 2000 and 2001; 2 mag from Dec. 15 to Dec. 29, 2006; 1 mag from Jan. 2 to Jan. 18, 2007). This suggests that GM Cep probably suffered similar rapid oscillations during the undersampled periods.
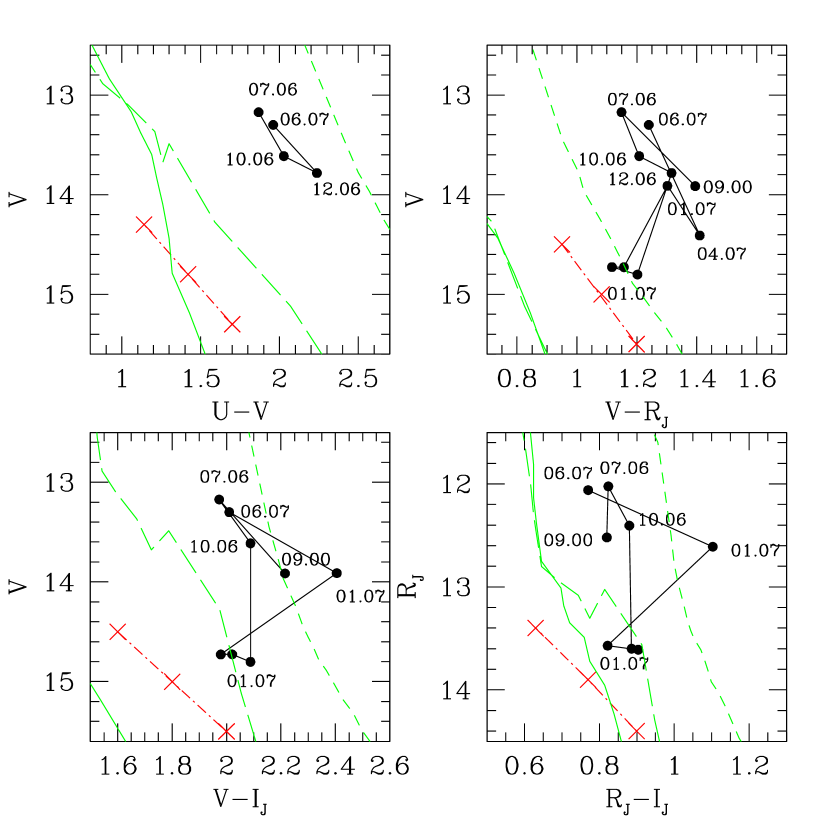
The simultaneous multiband data show that the color changes are small and relatively random (Figure 5). The changes in color do not seem purely related to extinction variations, considering a typical interstellar extinction law (Cardelli et al. 1989), although the material surrounding a young star is likely to be different from typical ISM matter. If the changes in magnitude were due to extinction alone, we would need to assume significant grain growth and a non-standard extinction law: To produce the same amplitude of variations in all VRI bands, the obscuring grains should be very large (10m) to ensure grey extinction (Eiroa et al. 2002). Simultaneous JHK and optical observations would help to constraint the effects of extinction in the lightcurve, but unfortunately only one of our JHK data sets has simultaneous UBVRI photometry. The small color variations suggest as well that eclipses by a companion of different mass are not responsible for the changes. The amplitude of the variations (up to 2.5 magnitudes) is too large for eclipses, even if we consider an equal-mass companion, unless we consider some special binary configuration in addition to obscuring material, somehow analogous to KH 15D (Hamilton et al. 2005 and references therein). Detailed studies of the periodicity in the future should clarify the presence of eclipses. Nevertheless, both the extinction and the eclipse scenarios fail to explain the high luminosity of GM Cep (up to 30-40 L⊙ at maximum) unless the star had a much earlier spectral type (A) or belonged to another luminosity class.
3.2 Stellar Properties and Activity
The spectra of GM Cep are dominated by very strong and broad H emission with strong P-Cygni profile with a deep blueshifted absorption that goes under the continuum level, characteristic of very strong accretion (Edwards et al. 1994; Hartigan et al. 1995). Other emission lines associated to winds and accretion are present as well (Figures 1, 6, and 7). The main lines are listed in Table 5. Given that none of the spectra is flux calibrated, it is not possible to determine the variations in the continuum level. The spectral features in the high-resolution data from 2001 and 2004 are very similar. The H equivalent width (EW) was larger in the 2004 (EW=-14 Å) than in 2001 (EW=-6 Å), and the 10% H velocity width was also higher in 2004 (660 km/s; Paper IV) than in 2001 (580 km/s), suggesting a higher accretion rate in the first case. The narrow H feature in the HIRES spectrum may be affected by nebular emission of the H II region, or may have been oversubtracted in the Hectochelle spectrum. The low-resolution spectra give H EW -10 and -19 Å in June 2001 and April 2007, respectively, suggesting H variability caused by variable accretion/winds added to changes in the continuum level.
In the 2001 low-resolution FAST spectrum, the H line appears in absorption. Typically, accreting stars show the Balmer H Series in emission, with similar profiles in all the lines, suggesting that they came from the same mass of emitting gas (Muzerolle et al. 1998, 2001). Nevertheless, in the case of very strong accretors, the strong winds can dominate the most optically thick lines (H) overrunning the signs of magnetospheric accretion, which would dominate optically thinner lines (like H; Muzerolle et al. 2001). Intermediate-mass variables of the UX-or class tend to have H in absorption (Grinin et al. 2001; Tambovtseva et al. 2001), but H P-Cygni profiles are very rare in them, and the Ca II IR lines appear typically in absorption. For GM Cep, the Ca II IR triplet ( 8498, 8542, 8662 Å), indicator of accretion, shows strong emission in both the HIRES and the CAFOS spectra (Figures 1 and 6). The lines were stronger in 2001, and the ratio of the 8498 and the 8662 line varies in the two epochs from 1.5 to 2.5. The profiles of these two lines are not similar either, but the 8662 Å line can be blended the Paschen 13 line.
The high-resolution spectra show forbidden [N II] emission at 6548 and 6583 Å, typically associated to winds and shocks (Hartmann & Raymond 1989). The [N II] lines are stronger in the 2004 data, which has the stronger H. In addition, the [N II] lines appear redshifted by about 18 km/s in 2004 with respect to 2001. The shock origin of the [N II] emission results typically in small blueshifts of the lines (Hartigan et al. 1995), so the velocity shift observed could be related to changes in the velocity and/or location of the shocked matter, or in the radial velocity of the star. Considering the strength of the lines, we believe that GM Cep had stronger winds during 2004 than in 2001. The [O I] line at 6300 Å is not covered, and the [O I] line at 6363Å is not detected, but the [S II] line at 6729 Å is detected in emission. The forbidden emission lines ([O I], [N II], [S II]) can be used to constrain the wind and shock density and the temperature of the regions where they originate, given their different critical densities and ionization potentials (Hartigan et al. 1990). If a jet or wind does not encounter matter in its way, the forbidden line emission may not be produced (Hartigan et al. 1995). Higher densities tend to reduce the [N II] and [S II] emission compared to [O I], and higher shock velocities increase ionization and the [N II]/[O I] ratio. The different velocities observed for the different lines suggest different formation volumes: [N II] could be produced in a low-density shock far from the star, whereas the [O I] line could be related to denser, hotter wind maybe associated to the material producing the H absorption.
GM Cep presents a remarkable, double-peaked O I emission at 8446 Å, with peaks centered at 8442 and 8448 Å, respectively (-140 km/s and +80 km/s; Figure 6). This line is characteristic of very strong winds, being usually present in Herbig Ae/Be stars and in strongly accreting TTS like RW Aur (Alencar et al. 2005). The double peak observed in GM Cep could in fact indicate two jet-like wind components. There is a prominent and broad O I absorption at 7774Å, maybe related to the hot disk (Grinin et al. 2001). We detect as well some weak Fe II and Fe I lines in emission (Table 5), which are seen in spectra of other strongly accreting stars like V1647 (Fedele et al. 2007).
The new data allow to revise the spectral type of the star. The low-resolution spectra are veiled and lack broad band features, giving an uncertain spectral type around G. The high-resolution HIRES spectrum shows numerous photospheric lines in the whole wavelength range, despite important blending due to the fast rotation of GM Cep. Comparing to standard spectral libraries (Montes et al. 1997; Coluzzi et al. 1993), the Fe I and Ca I lines, together with the Li I absorption (0.16Å) suggest a late-type in the range G7V-K0V (1; G5-K3 for 3). The main contributors to the uncertainty in the spectral type are the moderate veiling (0.2-0.4, depending on spectral type) and the fast rotation, added to the intrinsic lack of strong features in G-type stars.
Cross-correlation of the Hectochelle spectrum with spectra of slow rotators of a similar spectral type revealed a rotational velocity V=51.69.4 km/s (Paper IV). We repeated the cross-correlation with each one of the HIRES orders, removing the zones affected by emission lines, bad pixels, and strong atmospheric features (mostly O2 and H2O bands; Curcio et al. 1994). The results of the cross-correlation are summarized in Table 7, and displayed in Figure 8. The HIRES data confirm the very high rotational velocity over a large range of wavelengths, V=43.2 1.6 km/s in average (standard deviation =4.2 km/s). Compared to the average rotational velocity of the rest of Tr 37 members (V=10.23.9 km/s), GM Cep is a very fast rotator: the next fast rotator in Tr 37 is the M0 weak-lined TTS 21-763, with V=28.38.1 km/s. We do not observe any correlation between V and the wavelength (Figure 8) nor between the line broadening and the line transition lower excitation potential, as has been suggested for FU-ors (Hartmann & Kenyon 1987; Welty et al. 1990, 1992; Kenyon & Hartmann 1996). Therefore, we believe that the absorption lines arise rather from the stellar photosphere than from a hot disk or shell. The cross-correlation provides as well a measure of the radial velocity. The average radial velocity in Tr 37 is CZ=-15.03.6 km/s, so GM Cep is slightly off-cluster with CZ=-7.56.7 km/s (Paper IV). The HIRES data produces a different off-cluster value, CZ=-21.02.6 km/s. On the other hand, the radial velocity of the 12CO (1-0) peak is consistent with the cluster average -152 km/s (Section 2.7). Nevertheless, the broad lines lead to large errors, so the evidence of spectroscopic binarity is only 2 and therefore, not conclusive.
3.3 Accretion
The U band observations combined with simultaneous VRI photometry can be used to determine the accretion rate via the excess U band luminosity (LU; Gullbring et al. 1998; Paper I, II, IV). The excess in U band luminosity is well correlated to the accretion luminosity Lacc, which can be transformed into an accretion rate. Following Gullbring et al. (1998):
| (1) |
| (2) |
The mass and radius of the star (M∗, R∗) can be obtained from the V vs. V-I diagram and evolutionary tracks (Siess et al. 2000). LU can be estimated as the difference between the measured U band luminosity and the photospheric luminosity, calculated from the measured I magnitude and using the U-I color of a non-accreting star with the same spectral type (Kenyon & Hartmann 1995). All magnitudes must be corrected from extinction (derived from the VRI colors using a standard galactic extinction law; Cardelli et al. 1989), and the transformation of magnitudes to luminosity can be done with the zero point flux and the bandwith for U band (4.19 10-9 erg s-1 cm-2 Å-1 and 680 Å, respectively). For GM Cep, and for an spectral type G7-K0, the extinction is AV2-3 mag, so the 2006-2007 data results in variable L0.5 - 4 L⊙ and a variable accretion rate in the range Ṁ10-7 - 5 10-6 M⊙/yr. The mass and radius of the star are uncertain, given the variations within the color-magnitude diagram (Figure 5), being the most probable values M∗=2.1 M⊙ and a radius between 3 to 6 R⊙. Added to the uncertainty in the spectral type and extinction, this result is accurate within 1 order of magnitude. In any case, this accretion rate is 2-3 orders of magnitude higher than the median in Tr 37 (Paper IV), and 1-2 orders of magnitude higher than the rates in typical Taurus stars.
Using the parametrization in Natta et al. (2004), we can convert the H velocity wings at 10% of the maximum (VHα10%) into accretion rates:
| (3) |
For the measured velocities of 580 and 660 km/s, the accretion rates are 5 10-8 M⊙/yr and 3 10-7 M⊙/yr, respectively. These values may be underestimated given the wind absorption in the H profiles and depending on the viewing angle. As the dispersion associated to this parametrization is around 1-2 orders of magnitude, the 3 10-7 M⊙/yr rate derived from Hectochelle in 2004 is roughly consistent with the values derived from U band photometry. The moderate veiling estimated from the HIRES spectrum (0.2-0.4) agrees with the accretion rate estimated from H assuming an intermediate luminosity for GM Cep.
3.4 IR Variability and Disk Models
In order to study the structure of the disk around GM Cep, we trace the spectral energy distribution (SED) using the millimeter, Spitzer, 2MASS, and optical data. The main uncertainty here is that the different observations are not simultaneous. The 2MASS JHK data are nearly contemporary to the optical photometry (2000), but the Spitzer data were taken in 2003-2004, and the millimeter continuum in 2006. Short time variations of 1 mag in JHK have been observed for stars similar to GM Cep (Eiroa et al. 2002), suggesting structural changes in the disks. According to the D’Alessio et al. (2005) disk models, the flux at wavelengths shorter than 300 m scales linearly with the total (stellar and accretion) luminosity, but the disk flux at longer wavelengths is independent (Merín et al. 2004). Juhász et al. (2007) and Kóspál et al. (2007) found similar evidences of mid-IR excess variations with luminosity. If the causes of the outbursts were extinction variations, the mid- and far-IR variability would be milder, and the near-IR would be only moderately variable. The differences between the fluxes measured by IRAS 12m, IRAC 8m, and the MSX6C A band (8 m) are suggestive of IR variability. On the other hand, the millimeter emission reflects the total mass of the disk, changing little even if the star suffers strong variability.The brightness in V varied in the whole range (2-2.5 mags) during the time when the different IR observations were taken (Figure 4), so for modelling the disk we take the optical data from September 2000, which has an intermediate brigthness, and keep in mind that the SED may be affected by variable IR fluxes.
Typical disk models assume that the disk is in hydrostatic equilibrium. Nevertheless, the strong IR emission suggests that the disk is compact, dense, and, if the variability is triggered by episodes of enhanced accretion, probably out of hydrostatic equilibrium (Clarke & Lin 1990; Eiroa et al. 2002), so we must be cautious interpreting the models. We use the standard models for irradiated accretion disks around TTS of D’Alessio et al. (2005), which trace the flared disk self-consistently, with a flaring angle determined by the hydrostatic equilibrium, and include stellar illumination and accretion as heating sources for the disk. The dust opacities are calculated for a collisional distribution of grain sizes, where the amount of grains of a given size “a” varies as a power law n(a) a-3.5 and the maximum grain size is 10m. We assume an average inclination of 60 degrees; the effects of intermediate inclination variations being only important for the near-IR emission. The stellar parameters, derived from the optical photometry of September 2000 using the HR diagram, are M=3.0 M⊙, R=5.14 R⊙, T=5000 K. We also include an accretion rate of 10-6 M⊙/yr. These parameters are one of the main uncertainties in the modeling, given the variability of the star. The best fit model is displayed in Figure 9. The result is, not surprising, that the disk cannot be modeled as a standard disk. If we try to fit the MIPS data points at 24 and 70 m, the 1.3mm continuum flux would be overestimated by more than one order of magnitude, and even the 24 and 70 m contemporary data alone cannot be accurately reproduced with hydrostatic equilibrium disk models for any observed stellar luminosity. The mid-IR flux of GM Cep is comparable to that of FU Orionis itself (Quanz et al. 2006), although its disk (or disk plus envelope) is less massive. Since the flux at millimeter wavelengths is independent of the rapid optical variability, a standard hydrostatic equilibrium model can reproduce the flux at 1.3mm only if the grains are either much smaller or much larger than 10 m (maximum grain size 1m or 1cm) or if the disk is very small (up to 30-50 AU). Even in these cases, an additional source of IR emission should be included to produce the high 24 and 70 m flux (in a small disk) or to fit the near-IR excess (if the grain sizes have cm sizes).
A way to increase the IR fluxes without changing the mm flux would be by varying the flaring angle at a certain distance from the star. The flaring angle in the D’Alessio et al. (2005) models is fixed by the hydrostatic equilibrium, but strong turbulence related to the strong accretion can produce an unstable disk. As an experiment, the mid-IR fluxes can be increased by adding a black body emission with T150 K to a compact 30 AU disk model. For the luminosity of GM Cep, this would mean a distance of 25 AU. The excess mid-IR emission that needs to be added could be interpreted as an increase in the flaring angle by a factor of 2 at distances of 20-30 AU (a “bump” in the disk), as an illuminated wall at 25 AU, or as a shell or envelope located at a similar distance. If the innermost disk were very flared or had a high inner wall, some degree of self-shadowing in the near-IR may occur, leading to a “bump” at longer wavelengths (Dullemond et al. 2001).
A physical mechanism to produce a “bump” or a local change in the flaring angle could be to disrupt the disk by a massive object (a stellar companion and/or a giant planet) triggering thermal instability and producing rims and/or spiral waves (Clarke & Lin 1990; Clarke & Syer 1996; Lodato & Clarke 2004). This picture would also be useful to explain the observed outbursts as periods of increased accretion activity. A close-in companion, a companion embedded in the disk, or a companion out of the disk (typically, at distances 2-3 times the size of the disk; Artymowicz & Lubow 1994) could produce disk instabilities and increased accretion episodes, with the advantage that companion-triggered outbursts can occur at later stages of evolution in Class II objects, more consistent with the ages of Tr 37 (Lodato & Clarke 2004). Detailed studies of the periodicity and radial velocity will be used to test these scenarios.
The shell/envelope picture presents a main problem: the relatively low extinction of GM Cep. Assuming the reasonable spectral type range (G5-K3) the extinction can vary between AV=1.5-3 mag, roughly consistent with the cluster average AV=1.670.45 mag (Paper II), and with the minimum interstellar extinction for an object located at 900 pc, A1 mag. Therefore, the column density in the envelope would be of the order of N(H2)=1021 cm-2 at most (Frerking et al. 1982; Taylor et al. 1993), resulting in a total mass of 4M⊙ if the envelope has a 30 AU radius, and still only 0.001 M⊙ for a 500 AU radius, insignificant compared to the total disk mass. The envelope could be more dense and massive if it had polar gaps, which is reasonable given the strong winds, and if we assume a low viewing angle, but it cannot be too massive to reproduce the millimeter flux. A low viewing angle would be consistent with the lack of broadening in the 12CO(1-0) line, and would suggest that GM Cep is rotating close to the breakup velocity, 200 km/s. Accretion from an envelope onto the disk could produce episodes of increased accretion onto the star. Extinction by a non-uniform envelope can produce magnitude changes as well, but the rapid variation timescales require that, if extinction plays an important role in the magnitude changes, the extincting matter must be very close to the star. In order to distinguish between all these scenarios, simultaneous observations at all wavelengths are required.
3.5 Disk Mass Estimates
The millimeter continuum data can be used to estimate the total disk mass, given that the whole disk is optically thin at these wavelengths. The total dust mass is written as:
| (4) |
where Fν is the flux at millimeter wavelengths, D is the distance, is the dust mass absorption coefficient at the same wavelength (2 cm2 g-1 at 1.3mm; Beckwith et al. 1990; Miyake & Nakagawa 1993; Krügel & Siebenmorgen 1994). Bν(Tdust) is the Planck function for the temperature of the bulk of the dust. The total mass of the disk can be obtained assuming a gas-to-dust ratio of 100 (Beckwith et al. 1990). The main uncertainties are the dust absorption coefficient (if substantial grain growth has occurred), the gas-to-dust ratio (if the disk is older than typical disks), and, in an unstable disk, the temperature of the bulk of the dust. We use the dust absorption coefficient assumed for Taurus disks (Beckwith et al. 1990; Osterloh & Beckwith 1995), which is larger than the for the interstellar medium (1 cm2 g-1) or than the one of disks with grains larger than 100 m (Krügel & Siebenmorgen 1994). The typical dust temperature for outer disks around TTS is 30-40 K (Dutrey et al. 1997; Thi et al. 2001). For GM Cep, the dust temperature could be higher if the strong accretion is adding extra heating to the disk, and/or if the bulk of the dust is closer to the star (because of changes in the flaring and/or envelope configuration). In order to be conservative, we consider dust temperatures in the range 30-150 K, resulting in total disks masses from 0.07 to 0.01 M⊙, several times the minimum mass solar nebula.
The emission of optically thin transitions in molecules can be used to estimate the mass in cold gas (Thi et al. 2001). The 12CO(1-0) line detected at the IRAM 30m telescope is most likely optically thick, so this would underestimate the disk mass. Nevertheless, if we make the approximate calculation, assuming that the line is thermalized, we have:
| (5) |
where F(1-0) is the total flux in the 12CO(1-0) line, N(CO) is the 12CO column density, D is the distance, A1-0 is the Einstein coefficient for the transition, is the level occupation at a given temperature, and A is the disk surface area. The main error in this approach is that the line is not optically thin. If we assume the ratio of H2 to 12CO to be 104 (Thi et al. 2001), and we consider the total flux integrated over the line profile F(1-0), the mass of the disk can be written as:
| (6) |
With A1-0 and from the Leiden Atomic and Molecular Database (LAMBDA; Schöier et al. 2005) and the Cologne Database of Molecular Spectroscopy (CDMS; Müller et al. 2001, 2005), and assuming gas temperatures between 40 and 80 K (this variation results only in a factor of 2), the total disk mass inferred from the integrated flux F(1-0)=0.27 Jy km/s is of the order of 0.0005 M⊙, about 100 times smaller than the estimate from the dust continuum emission. This is reasonable since the line is optically thick, and the typical CO depletion values in TTS disks are of the order of 10-1000 (Thi et al. 2001). Moreover, our 12CO fluxes may be underestimated because of the absorption from ambient gas (Section 2.7).
The disk mass obtained integrating the 30 AU disk model that gives the best fit to the millimeter point (Section 3.4) is about 3 times larger, 0.19 M⊙. The model suggests a temperature around 30-40 K for the bulk of dust. The main source of disagreement is the dust mass absorption coefficient, which in the model is variable with the radius of the disk and depends on the distribution of grains of different sizes, having typical values between 0.4 and 1.8 cm2 g-1, smaller than the from Beckwith et al. (1990). The stronger inconsistency is that for an accretion rate Ṁ10-6M⊙/yr, the disk would survive less than 0.1 Myr, very little compared with the ages of Tr 37 and even with the ages of the Tr 37 globule. This inconsistency is not exclusive to GM Cep, but many of the strong accretors like DR Tau and RW Aur have similar Ṁ and even smaller millimeter disk masses (0.03 and 0.0003 M, respectively; Beckwith et al. 1990; Osterloh & Beckwith 1995), so their survival times would be even shorter. In case of RW Aur, the problem can be solved assuming that the current accretion episodes are transient events caused by disk disturbances by its companion(s) (Petrov et al. 1991; Cabrit 2005). EX-ors are supposed to have variable accretion, so they could spend most of their lives accreting at lower rates. Another way to solve the disagreement would be to change the opacities by increasing the maximum grain sizes to 1-10 cm or decreasing it under 1m. Such dust distributions are compatible with the millimeter fluxes if the disk has a mass 0.5-0.6 M⊙ and outer radius 100 AU. Mannings & Emerson (1994) suggested that including large grains and fractal dust structures could increase the disk mass of DR Tau, and Rodmann et al. (2006) found evidence of cm-sized grains in RW Aur. Important grain growth seems appropriate for older TTS like GM Cep and should be explored with more observations in the submm range to constrain the SED slope.
3.6 Does GM Cep have a Wide-Orbit Companion?
Given the anomalous SED of GM Cep, the repeated outbursts, and the fact that many of the well-known variable and EX-or/FU-or objects are multiple systems with separations 100-300 AU (Reipurth & Aspin 2004; Vittone & Errico 2005; Ghez et al. 1993), we investigate the presence of companions. The presence of binaries has been invoked as a mechanism to produce EX-or and FU-or outbursts in old and more evolved disks without an envelope (Clarke & Lin 1990; Bonnell & Bastien 1992). Some very variable TTS like RW Aur are such multiple systems (Ghez et al. 1993), and companions at distances 100 AU affect the evolution of disks around Herbig AeBe stars (Chen et al. 2006) and TTS (Bouwman et al. 2006). The high-resolution spectroscopy is not conclusive, but the detection of spectroscopic binaries may be difficult if the star is a very fast rotator, and/or if the viewing angle is low. The lucky imaging data from AstraLux does not reveal a wide companion. The small elongation of the PSF is compatible with the predicted atmospheric dispersion effects, and cannot be taken as an indicator of an unresolved companion. The ability to image companions with AstraLux is highly dependent on the magnitude difference between the two stars, and GM Cep was always imaged during high magnitude phases, so the identification of companions at 100-200 AU would not be possible even if the two stars have a similar mass.
In order to constrain the separation and magnitude difference of a possible companion, we analyzed the maximum brightness differences of a hypothetical companions at different angular separations from GM Cep for the November 2006 AstraLux data, which has the best Strehl ratio. We adopted a 5 peak detection over the background noise as visibility criterion. The absence of static aberrations and asymmetries in the AstraLux data beyond the first diffraction ring allow to determine the intensity standard deviation in concentric annuli around GM Cep, resulting in robust estimates of the detection limits (Table 8). Binary simulations were constructed by adding a scaled copy of the real observations to itself with the given magnitude differences and separations (Figure 10). Since not only the stellar PSF is added, but also the noise, this method increases the background noise especially at small magnitude differences, leading to more pessimistic estimates of the achievable detection limits. The observed PSF is in good agreement with a theoretical simulation which includes atmospheric dispersion effects, so there is no evidence for a bright companion at angular separations between 50-100 mas (45-90 AU). We conclude that GM Cep does not have a companion with a magnitude difference 1 mag at 100 AU, and none farther than 200 AU with a magnitude difference 2 mag. However, we cannot rule out the presence of a close G- or K-type companion with normal luminosity. We will obtain further AstraLux observation of GM Cep near its minimum in parallel to our photometric monitoring.
4 Discussion: Potential Variability Mechanisms in GM Cep
There are different mechanisms responsible for the magnitude variations of pre-main sequence stars. Herbst et al. (1994) classifies them in Type I, due to rotation of a star with cool spots, Type II, due to rotation of a star with hot spots (related to accretion), and Type III, also called UX-or variables. Young, accreting, solar-type stars experience Type I and II variations of the order of few 0.01-0.5 mag in a few days (Bertout 1989; Briceño et al. 2001; Eiroa et al. 2002). The irregular UX-or variations, with more complex timescales of days/weeks combined with few-years cycles, do not usually exceed mag1 mag, and occur typically in nearly edge-on HAeBe stars (Grinin et al. 2000), although other authors claim that stars as early as K0 can experience Type III variations (Herbst & Shevchenko 1999) and that the viewing angle can be as low as 45 degrees (Natta & Whitney 2000). The mechanisms triggering the UX-or variations are the most controversial, and they have been described as obscuration by shells of matter close to the star (Shevchenko et al. 1993; Natta et al. 1997; Grinin et al. 2000; Tambovtseva et al. 2001) or as thermal instabilities similar to those triggering FU-or outbursts (Herbst & Shevchenko 1999; Natta et al. 2000). Strong variations (mag2-5 mag) due to enhanced accretion episodes are seen in FU-or or EX-or outbursts, which are recurrent at least in the case of EX-or objects (Hartmann & Kenyon 1996; Lehman et al. 1995; Herbig et al. 2001). These extreme accretors tend to be very fast rotators (Herbig et al. 2003; although the fast rotation detected may be actually the rotation of the very hot inner disk), to have IR fluxes that deviate from typical disk models (Hartmann & Kenyon 1996), and to have in some cases companions at 100-300 AU (Reipurth & Aspin 2004). FU-ors and probably EX-ors could be either a normal phase within the very early evolution and disk formation in TTS (Clarke et al. 1990; Hartmann & Kenyon 1996, among others), or a special type of systems (certain binary or multiple systems; Herbig et al. 2003; Quanz et al. 2006). The long-time evolution of these objects is not known, so the study of relatively old variables within these classes could help to understand their nature.
The lightcurve of GM Cep is not purely consistent with any known FU-or, EX-or nor UX-or lightcurves, although these objects are largely variable within their classes. The magnitude changes (mag2-2.5 mag) and multiple maxima are consistent with an EX-or or UX-or type variable. The high IR flux is another characteristic of EX-or/FU-or systems, due to their high luminosity and/or to the presence of envelopes. The H and [N II] variability suggest changes in the accretion rates and in the strength of the winds, and although the H absorption is typical of UX-ors, the blueshifted absorption in H is very rare in this class. The magnitude changes are not consistent with variable obscuration alone considering a standard galactic extinction law. Nevertheless, if the extinction were produced by material in the circumstellar disk/shell of GM Cep, containing reprocessed dust and large grains, the color changes during high extinction episodes could be different. The type of obscuration suggested for UX-or variables (Shevchenko et al. 1993; Natta et al. 1997) results in bluer colors at low magnitude, due to obscuration of the red disk and scattering (Grinin et al. 2001), which have not been seen so far in GM Cep. Moreover, pure extinction episodes cannot explain the high luminosity of GM Cep unless the spectral type and/or the luminosity class are changed beyond reasonable limits. Extinction variations alone could account only for up to 1.5 mags in V and cannot produce the observed changes in color. If variable extinction were produced by the disk material in the vicinity of the star, the system should be close to edge-on or should have an anomalous distribution of circumstellar matter. Given the observed V, the angle of view must be larger than 15 degrees to prevent breakup, and the near-IR fluxes and the P-Cygni H profile suggest an intermediate angle. If the excess mid-IR emission were due to an envelope, the strong winds could contribute to clean the polar gaps, reducing the extinction. GM Cep could be then one of the oldest EX-or variables known, since these phenomena seem to occur preferentially at ages 1 Myr. According to the picture developed by Clarke & Syer (1996), the presence of a planetary or stellar companion in the disk of a Class II object at few AU distances can trigger thermal instability and produce outbursts with amplitude and frequency depending on the mass of the companion (Lodato & Clarke 2004). Given the ages of Tr 37, it is most likely that GM Cep is a special object, probably a binary or multiple system, rather than a typical very young TTS.
In order to understand the variations of GM Cep, we compare it to similar cases:
The activity of the EX-ors EX Lupi and DR Tau resembles strongly that of GM Cep. EX Lupi suffers periods of quiescence followed by strong variability with 2-3 mag amplitude and changes in its emission line spectrum (Lehmann et al. 1995). Like GM Cep, it is presumably older than other EX-ors (Herbig 2007). The K5-K7 eruptive star DR Tau is known to have irregular variability episodes since 1900, with amplitudes 1.5 to 3-5 mag. Its variable and strong stellar winds, large UV excess and veiling suggest high and variable accretion rates (Chavarria 1979; Mora et al. 2001). DR Tau can remain relatively stable at both the low-magnitude and high-magnitude phases during years/decades, as was seen by Suyarkova (1975) for GM Cep. The variability of DR Tau cannot be explained by hot and cold spots and variable obscuration alone (Eiroa et al. 2002). Like for GM Cep, the mass of the disk of DR Tau (0.03 M⊙; Beckwith et al. 1990) seems to be too small for its accretion rate if we assume the small typical grain sizes.
Suyarkova (1975) classified GM Cep as a RW Aur-type variable. The “extreme CTTS” RW Aur shares with GM Cep the strong and variable P-Cygni H profile, a powerful disk, a large accretion rate, and a strong double-peaked O I emission lines at 8446 Å, with velocity shifts 100 km/s (Ghez et al. 1993; Alencar et al. 2005). It is a triple system and the prototype of the RW Aur-class of irregular variable stars (Hoffmeister 1957), characterized for rapid magnitude variations with mag1-4 mag and a typical spectral type around G5. The very small millimeter disk mass of RW Aur (0.0003 M⊙; Osterloh & Beckwith 1995) suggests a timescale for disk removal of the order of centuries to millenia, too short unless we assume brief and transient accretion episodes (Cabrit 2005) and/or important grain growth to cm sizes (Rodmann et al. 2006). The accretion seems to be non-axisymmetric, as expected from interactions with a close companion (Petrov et al. 2001).
The 1 Myr-old star GW Ori is one of the most massive TTS known (M=2.5 M⊙, R=5.6 R⊙; Mathieu et al. 1991), resembling strongly GM Cep. With an accretion rate 10-6M⊙/yr, it is a very fast rotator (V=43 km/s; Bouvier et al. 1986), and shows variability up to 1 mag in JHK (Samus et al. 2004). It is a binary (maybe triple) system, with a G5 primary with luminosity 26 L⊙, similar to GM Cep and abnormally high for its spectral type (Mathieu et al. 1991). It is also has a very strong IR excess, and is one of the most luminous TTS at millimeter wavelengths (Mathieu et al. 1991, 1995), suggesting a disk (or disk+shell) mass 1.5M⊙, being the only one in its class able to sustain high accretion rates over several Myr.
The K3 star CW Tau shares with GM Cep the rapid rotation (V=28 km/s; Muzerolle et al. 1998), the H P-Cygni profile and a deep, and a broad OI absorption at 7773Å. It shows magnitude variations up to 2 magnitudes (General Catalog of Variable Stars, Kukarkin et al. 1971), and has a strong outflow (Hirth et al. 1994; Gómez de Castro 1993) and strong [N II] forbidden line emission. As for GM Cep, the mass of the disk is not specially high despite the signs of strong accretion (0.02 M⊙; Beckwith et al. 1990).
The outburst of IRAS 05436-0007/V1647 (Eislöffel & Mundt 1997) revealed the bright McNeil Nebula in 2004 (McNeil et al. 2004). This very extincted (AV13 mag) object shows a flat mid-IR spectrum (in contrast to typical EX-or and similar objects, which have TTS-looking IR SEDs). It has been considered as a Class 0 embedded object (Lis et al. 1999), but may be some type of EX-or or FU-or Class II object, surrounded by a massive circumstellar envelope (M0.5 M⊙; Ábrahám et al. 2004), with a 5.6 L⊙ luminosity, typical of TTS, or an intermediate case between EX-or and FU-or objects (Fedele et al. 2007). Its emission line spectrum at optical wavelengths is similar to the spectrum of GM Cep.
KH 15D is a pre-main sequence binary system with a precessing disk or ring, seen edge on, so one of the components is permanently occulted by the disk, whereas the other is visible only during half of the period (Hamilton et al. 2005). The color changes are affected by the eclipses and scattering. Although such special configurations allow much large amplitudes and atypical color variations, a similar scenario fails to explain the high luminosity of GM Cep without changing its spectral type and luminosity class or introducing additional mechanims (i.e., hot shells) to reproduce the optical absorption lines.
5 Conclusions
GM Cep is an extremely variable late G star in the 4 Myr-old cluster Tr 37, resembling younger EX-or objects. Its complex variability in color and magnitude is not consistent with a single typical variability mechanism in TTS (hot/cold spots, variable obscuration, or changes in the accretion rate). The amplitude of the variations, the high accretion rate, the luminous mid-IR disk, and the high stellar luminosity suggest variable accretion to be the stronger contributor, maybe mixed with variable extinction by circumstellar material (similar to UX-or variables), and some minor influence of cold spots and scattering. Increased accretion episodes are thought to produce the strong, irregular variations in young EX-or and FU-or objects, typically still surrounded by massive infalling envelopes. Nevertheless, GM Cep has a medium-mass disk and a small or inexistent envelope, and belongs to a cluster where strong disk evolution is ubiquitous. Large changes in the accretion rates can result in changes in the stellar and disk structure, and conversely, the disruption of the disk structure (for instance, by companions, or via gravitational instability if the disk is very massive and compact), can increase the accretion rate. The presence of companions (stellar, substellar or planetary) is a plausible mechanism to produce disk instabilities in a relatively old star like GM Cep. Simultaneous multiwavelength observations, including IRS spectra scheduled for 2007, providing coverage in the 5-35m range, and detailed monitoring in the coming years will help us to reveal the nature of the variability in GM Cep. Sub-millimetre observations in the future should be used to determine the SED slope and constrain the size of the grains. Old but extremely accreting stars are thus a key to understand the processes of disk accretion and evolution and the consequences for planet formation.
References
- Ábrahám et al. (2004) Ábrahám, P., Kóspál, A., Csizmadia, S., Moór, A., Kun, M., Stringfellow, G., 2004, A&A 419, L39
- Alencar et al. (2005) Alencar, S., Basri, G., Hartmann, L., Calvet, N., 2005, A&A 440, 595
- Beckwith et al. (1990) Beckwith, S., Sargent, A., Chini, R., Güsten, R., 1990, AJ, 99, 924
- Bessell (1979) Bessell, M., 1979, PASP, 91, 589
- Bessell (1986) Bessell, M., 1986, PASP, 98, 1303
- Blair & Gilmore (1982) Blair, M., & Gilmore, G., 1982, PASP 94, 742
- Bonnell & Bastien (1992) Bonnell, L., & Bastien, P., 1992, ApJ, 401, L31
- Bouwman et al. (2006) Bouwman, J., Lawson, W., Dominik, C., Feigelson, E., Henning, Th., Tielens, A., Waters, L., 2006, ApJ, 653, L57
- Cardelli et al. (1989) Cardelli, J., Clayton, G., Mathis, J., 1989, ApJ, 345, 245
- Chavarria (1979) Chavarria-K., C., 1979, A&A, 79, 18
- Chen et al. (2006) Chen, X. P.; Henning, T.; van Boekel, R.; Grady, C. A., 2006, A&A, 445, 331
- Clarke et al. (1990) Clarke, C., Lin, D., Pringle, J., 1990, MNRAS, 242, 439
- Clarke & Syer (1996) Clarke, C., & Syer, D., 1996, MNRAS, 278, L23
- Clarke et al. (2005) Clarke, C., Lodato, G., Melnikov, S., Ibrahimov, M., 2005, MNRAS, 361, 942
- Coluzzi (1993) Coluzzi, R., 1993, ILLSS Catalogue, Bull. Inf. CDS, 43, 7
- Contreras et al. (2002) Contreras, M.E., Sicilia-Aguilar, A., Muzerolle, J., Calvet, N., Berlind, P., Hartmann, L. 2002, AJ, 124, 1585
- Couch & Newell (1980) Couch, W., & Newell, E., 1980, PASP, 92, 746
- Curcio et al. (1964) Curcio, J., Drummeler, L., Knestrick,G., 1964, Applied Optics Vol. 3, N. 12, 1401
- D’Alessio et al. (1999) D’Alessio, P., Calvet, N., Hartmann, L., Lizano, S., Cantó, J., 1999, ApJ, 527, 893
- D’Alessio et al. (2005) D’Alessio, P., Merín, B., Calvet, N., Hartmann, L., & Montesinos, B., 2005, Rev. Mex. A. A., 41, 1
- Dullemond et al. (2001) Dullemond, C., Dominik, C., Natta, A., 2001, ApJ 560, 957
- Dutrey et al. (1997) Dutrey, A., Guilloteau, A., Guelin, M., 1997, A&A, 317, L55
- Edwards et al. (1994) Edwards, S., Hartigan, P., Gandour, L., Andrulis, C., 1994, AJ 108, 1056
- Eislöffel & Mundt (1997) Eislöffel, J.; Mundt, R. 1997 AJ, 114, 280
- Fedele et al. (2007) Fedele, D., van den Ancker, M., Petr-Gotzens, M., Rafanelli, P., 2007, AA in press
- Fernie (1983) Fernie, J., 1983, PASP, 95, 782
- Frerking et al. (1982) Frerking, M., Langer, W., Wilson, R., 1982, ApJ, 262, 590
- Ghez et al. (1993) Ghez, A., Neugebauer, G., Matthews, K., 1993, AJ 106, 2005
- Gómez de Castro (1993) Gómez de Castro, A., 1993, ApJ, 412, 43
- Grinin et al. (2000) Grinin, V., Rostopchina, A., Shakhovskoy, D., 2000, IAUS, 200, 115
- Grinin et al. (2001) Grinin, V., Kozlova, O., Natta, A., Ilyin, I., Tuominen, I., Rostopchina, A., Shakhovskoy, D., 2001, A&A, 397, 482
- Gullbring et al. (1998) Gullbring, E., Hartmann, L., Briceño, C., Calvet, N., 1998, ApJ 492, 323
- Hamilton et al. (2005) Hamilton, C., Herbst, W., Vrba, F., & 14 more coauthors, 2005, AJ, 130, 1896
- Hartmann et al. (1986) Hartmann, L., Hewett, R., Stahler, S., Mathieu, R., 1986, ApJ, 309, 275
- Hartmann & Kenyon (1987) Hartmann, L., & Kenyon, S., 1987, ApJ 322, 393
- Hartmann & Raymond (1989) Hartmann, L., & Raymond, J., 1989, ApJ , 337, 903
- Hartmann & Kenyon (1996) Hartmann, L., & Kenyon, S., 1996, ARAA, 34, 207
- Herbig et al. (2001) Herbig, G., Aspin, C., Gilmore, A., Imhoff, C., Jones, A., 2001, PASP, 113, 1547
- Herbig et al. (2003) Herbig, G., Petrov, P., Duemmler, R., 2003, ApJ, 595, 384
- Herbig (2007) Herbig, G., 2007, AJ, 133, 2679
- Herbst et al. (1994) Herbst, W., Herbst, D., Grossman, E., Weinstein, D., 1994, AJ 108, 1906
- Herbst & Shevchenko (1999) Herbst, W., Shevchenko, V., 1999, AJ 118, 1043
- Hirth et al. (1994) Hirth, G. A.; Mundt, R.; Solf, J., 1994, A&A, 285, 929
- Hoffmeister (1957) Hoffmeister, C., 1957, IAUS, 3, 22
- Juhász et al. (2007) Juhász, A., Prusti, T., Ábrahám, P., Dullemond, C., 2007, MNRAS, 374, 1242
- Kóspál et al. (2007) Kóspál, A.; Ábrahám, P.; Prusti, T.; Acosta-Pulido, J.; Hony, S.; Moór, A.; Siebenmorgen, R., 2007, A&A in press
- Krügel & Siebenmorgen (1994) Krügel, E., & Siebenmorgen, R., 1994, A&A, 288, 929
- Kun (1986) Kun, M., 1986, Commission 27 of the I.A.U., Information Bulleting on Variable Stars, 2961
- Kukarkin et al. (1971) Kukarkin B.V., Kholopov P.N., Pskovski Y.P., Efremov Y.N., Kukarkina N.P., Kurochkin N.E. and Medvedeva G.I., 1971, General Catalogue of Variable Stars, 3rd ed.
- Kurtz et al. (1992) Kurtz, M.J., Mink, D.J., Wyatt, W.F., Fabricant, D.G., Torres, G., Kriss, G., and Tonry, J.L. 1992, in Astronomical Data Analysis Software and Systems I, ASP Conf. Ser., Vol. 25, eds. D.M. Worral, C. Biemesderfer, and J. Barnes, 432
- Law et al. (2006) Law, N. M., Mackay, C. D., and Baldwin, J. E., 2006, A&A, 446, 739
- Lehman et al. (1994) Lehman, T., Reipurth, B., Brandner, W., 1994, AA, 300, L9
- Lin and Papaloizou (1986) Lin, D.N.C., & Papaloizou, J., 1986, ApJ, 309, 846
- Lodato & Clarke (2004) Lodato, G., Clarke, C., 2004, MNRAS, 353, 841
- Mannings & Emerson (1994) Mannings, V., Emerson, J., 1994, MNRAS, 267, 361
- Marschall & van Altena (1987) Marschall, L.A. & van Altena, W.F., 1987, AJ, 94,71
- Mathieu et al. (1991) Mathieu, R., Adams, F., Latham,D., 1991, AJ, 101, 2184;
- Mathieu et al. (1995) Mathieu, R., Adams, F., Fuller, G., Jensen, E., Koerner, D., Sargent, A., 1995, AJ, 109, 2655
- McNeil et al. (2004) McNeil, J., Reipurth, B., Meech, K., 2004, IAUC 8284, 1
- Merín (2004) Merín, B., 2004 PhD Thesis, Universidad Autónoma de Madrid
- Miyake & Nakagawa (1993) Miyake, K., & Nakagawa, Y., 1993, ICARUS, 106, 20
- Montes et al. (1997) Montes, D., Martín, E., Fernández-Figueroa, M., Cornide, M, De Castro, E., 1997, A&AS, 123, 473
- Mora et al. (2001) Mora, A.; Merín, B.; Solano, E.; Montesinos, B.; de Winter, D.; Eiroa, C.; Ferlet, R.; Grady, C. A.; Davies, J. K.; Miranda, L. F.; and 12 coauthors, A&A 378, 116
- Morgenroth (1939) Morgenroth, O., 1939, Astron. Nachr. 268, 273
- Müller et al. (2001) Müller, M., Thornwirth, S., Roth, D., & Winnewisser, G., 2001, A&A 370, L49
- Müller et al. (2005) Müller, M., Schlöder, F., Stutski, J., & Winnewisser, G., 2005, J Mol. Struct. 742, 215
- Muzerolle et al. (1998) Muzerolle, J., Hartmann, L., Calvet, N., 1998, AJ 116, 455
- Muzerolle et al. (2000) Muzerolle, J., Calvet, N., Briceño, C., Hartmann, L. & Hillenbrand, L., 2000, ApJ, 535, L47
- Natta et al. (1997) Natta, A., Grinin, V., Manings, V., & Ungerechts, H., 1997, ApJ 491, 885
- Natta & Whitney (2000) Natta, A., Whitney, B., 2000, A&A, 364, 633
- Natta et al. (2000) Natta, A., Grinin, V., Tambovtseva, L., 2000, ApJ, 542, 421
- Natta et al. (2004) Natta, A., Testi, L., Muzerolle, J., Randich, S., Comerón, F., Persi, P., 2004, A&A 424, 603
- Osterloh & Beckwith (1995) Osterloh, M., & Beckwith, S., 1995, ApJ 439, 288
- Patel et al. (1998) Patel, N.A., Goldsmith, P.F., Heyer, M.H. & Snell, R.L., 1998, ApJ , 507, 241
- Petrov et al. (2001) Petrov, P., Gahm, G., Gameiro, G., Duemmler, R., & 4 more coauthors, 2001, A&A, 369, 993
- Quanz et al. (2006) Quanz, S., Henning, Th., Bouwman, J., Ratzka, T., & Leinert, C., 2006, ApJ, 648, 472
- Ralchenko et al. (2007) Ralchenko, Yu., Jou, F.-C., Kelleher, D.E., Kramida, A.E., Musgrove, A., Reader, J., Wiese, W.L., and Olsen, K. (2007). NIST Atomic Spectra Database (version 3.1.2); http://physics.nist.gov/asd3. National Institute of Standards and Technology, Gaithersburg, MD
- Reipurth & Aspin (2004) Reipurth, B., Aspin, C., 2004, ApJ 608, L65
- Rodmann et al. (2006) Rodmann, J.; Henning, Th.; Chandler, C. J.; Mundy, L. G.; Wilner, D. J., 2006, A&A, 446, 211
- Samus et al. (2004) Samus et al., 2004, Combined General Catalogue of Variable Stars, The GCVS4.2 Catalog (Vol. I-III)
- Schöier et al. (2005) Schöier, F., van der Tak, F., van Dishoeck, E., Black, J., 2005, A&A432, 369
- Shevchenko et al. (1993) Schevchenko, V., Grankin, K., Ibraghimov, M., Melnikov, S., Yakubov, S., 1993, Ap&SS, 202, 137
- Sicilia-Aguilar et al. Paper I (2004) Sicilia-Aguilar, A., Hartmann, L., Briceño, C., Muzerolle, J.,Calvet, N., 2004, AJ128, 805, Paper I
- Sicilia-Aguilar et al. (2005) Sicilia-Aguilar, A., Hartmann, L., Szentgyorgyi, A., Roll, J., Conroy, M., Calvet, N., Fabricant, D., & Hernández, J., 2005, AJ, 129, 363
- Sicilia-Aguilar et al. Paper II (2005) Sicilia-Aguilar, A., Hartmann, L., Hernández, J., Briceño, C., Calvet, N., 2005, AJ130, 188, Paper II
- Sicilia-Aguilar et al. Paper III (2006) Sicilia-Aguilar, A., Hartmann, L., Calvet, N., Megeath, S.T., Muzerolle, J., Allen, L., D’Alessio, P., Merín, B., Stauffer, J., Young, E., Lada, C., 2006,ApJ 638, 897, Paper III
- Sicilia-Aguilar et al. Paper IV (2006) Sicilia-Aguilar, A., Hartmann, L., Fürész, G., Henning, Th., Dullemond, C., Brandner, W., 2006, AJ 132, 2135. Paper IV
- Siess et al. (2000) Siess, L., Dufour, E. & Forestini, M. 2000 A&A , 358, 593
- Suyarkova (1975) Suyarkova, O., 1975, Variable stars 20, 167
- Tambovtseva et al. (2001) Tambovtseva, L., Grinin, V., Rodgers, B., Kozlova, O., 2001, Astronomy Reports, 45, 6, 442
- Taylor et al. (1993) Taylor, S., Hartquist, T., Williams, D., 1993, MNRAS, 264, 929
- Thi et al. (2001) Thi, W., van Dishoeck, E., Blake, G., van Zadelhoff, G., and 7 more authors, 2001, ApJ, 561, 1074;
- Tonry & Davis (1979) Tonry, J., & Davis, M., 1979, AJ 84, 1511
- Tubbs et al. (2002) Tubbs, R. N., Baldwin , J. E., Mackay, C. D., and Cox, G. C., 2002, A&A, 387. L21
- Vittone & Errico (2005) Vittone, A. & Errico, L., 2005, Mem. S.A.It., 76, 320
- Welty et al. (1990) Welty, A., Strom, S., Strom, K., Hartmann, L., Kenyon, S., Grasdalen, G., Stauffer, J.,1990, ApJ 349, 328
- Welty et al. (1992) Welty, A., Strom, S., Edwards, S., Kenyon, S., Hartmann, L., 1992, ApJ 397, 250
| Date/Epoch | Observatory/Telescope | Filter/Mode | References |
|---|---|---|---|
| Before 1939 | Sonneberg Observatory | Visual Photographic Plates | Morgenroth (1939) |
| 1952.556a | Palomar | R63F | USNO B1.0, Monet et al. (2003) |
| 1955.936 | Palomar | GG395-Bj, R63F | USNO A2.0, Monet et al. (1998) |
| 1955.941 | Palomar | R63F | SuperCosmos Catalog, Poss-I Red |
| 1965-10-02 | Konkoly Observatory | V | Kun(1986) |
| 1978.1: | Palomar | I9 | USNO B1.0, Monet et al. (2003) |
| 1983.5 | IRAS | 12-25-60-100m | IRAS (from Vizier) |
| 1985-10-20 | Konkoly Observatory | V | Kun(1986) |
| 1986-09-18 | Konkoly Observatory | V | Kun(1986) |
| 1989.757 | Palomar | GG395-Bj | USNO B1.0, Monet et al. (2003) |
| 1990.763 | Palomar | R61F | SuperCosmos Catalog, Poss-II Red |
| 1990.789: | Palomar | GG395-Bj | GSC 2.2 Catalogue |
| 1990.789b | Palomar | R59F | USNO B1.0, Monet et al. (2003) |
| 1991.595c | Palomar | GG395-Bj | USNO B1.0, Monet et al. (2003) |
| 1991.599 | Palomar | GG395-Bj | SuperCosmos Catalog, Poss-II Blue |
| 1993.552 | Palomar | R63F | GSC 2.2 Catalogue |
| 1994.44 | Palomar | I9 | SuperCosmos Catalog, Poss-II IR |
| 1996-1998 | MSX6C | ACDE | MSX6C, Egan et al. (2003) |
| 2000-09-03 | FLWO 1.2m | RcIc | Paper I |
| 2000-09-04 | FLWO 1.2m | VRcIc | Paper I |
| 2000-09-05 | FLWO 1.2m | RcIc | Paper I |
| 2000-09-06 | FLWO 1.2m | RcIc | Paper I |
| 2000-09-07 | FLWO 1.2m | RcIc | Paper I |
| 2000-09-08 | FLWO 1.2m | RcIc | Paper I |
| 2000-09-09 | FLWO 1.2m | RcIc | Paper I |
| 2000-09-21 | FLWO 0.9m 2MASS | JHK | 2MASS |
| 2001-06-30 | Keck I/HIRES | High-res. spectroscopy | This work |
| 2001-07-11 | FLWO 1.5m/FAST | Low-res. spectroscopy | Paper I |
| 2001-09-21 | FLWO 1.2m | RcIc | Paper I |
| 2001-09-22 | FLWO 1.2m | RcIc | Paper I |
| 2001-09-23 | FLWO 1.2m | RcIc | Paper I |
| 2001-09-25 | FLWO 1.2m | Rc | Paper I |
| 2002-09-03 | FLWO 1.2m | U | Paper I |
| 2003-10-20 | FLWO 1.2m | U | Paper I |
| 2003-12-20 | IRAC/Spitzer | 3.6, 4.5, 5.8, 8.0 m | Paper III |
| 2004-06-23 | MIPS/Spitzer | 23.9, 70.0 m | Paper III |
| 2004-12-01 | Hectochelle/MMT | H spectroscopy | Paper IV |
| 2006-06-02/03 | IRAM/MAMBO I | 1.3mm continuum | This work |
| 2006-06-03/05 | IRAM/Heterodyne | 12CO(1-0), 12CO(2-1) | This work |
| 2006-07-07 | Calar Alto 2.2m/AstraLux | z’ | This work |
| 2006-07-03 | Königstuhl 70 cm | UBVRI | This work |
| 2006-10-18 | Königstuhl 70 cm | UBVRI | This work |
| 2006-11-10 | Calar Alto 2.2m/AstraLux | z’ | This work |
| 2006-12-15 | Königstuhl 70 cm | UBVRI | This work |
| 2006-12-29 | Calar Alto 2.2m/CAFOS | VRI | DDT program, this work |
| 2006-12-31 | Calar Alto 2.2m/CAFOS | VRI | DDT program, this work |
| 2007-01-02 | Calar Alto 2.2m/CAFOS | VRI | DDT program, this work |
| 2007-01-18 | Calar Alto 2.2m/CAFOS | VRI | DDT program, this work |
| 2007-04-27 | Calar Alto 2.2m/CAFOS | Low-res. spectroscopy | DDT program, this work |
| 2007-05-11 | Calar Alto 2.2m/AstraLux | i’z’ | This work |
| 2007-06-02 | Carlos Sánchez/Teide | JHK | This work |
| 2007-06-03 | Carlos Sánchez/Teide | JHK | This work |
| 2007-06-04 | Carlos Sánchez/Teide | JHK | This work |
| 2007-06-05 | Carlos Sánchez/Teide | JHK | This work |
| 2007-06-08 | Carlos Sánchez/Teide | JHK | This work |
| 2007-06-08 | Königstuhl 70 cm | UBVRI | This work |
| 2007-06-24 | Calar Alto 2.2m/AstraLux | z’ | This work |
| 2007-06-25 | Calar Alto 2.2m/AstraLux | z’ | This work |
Note. — Summary of the data available on GM Cep, including our own observations and the data from the literature. 1952.556a: The epoch is uncertain, either 1952.556 or 1955.936. 1990.789b: The epoch is uncertain, can be 1990.789, 1991.600, or 1993.070. 1991.595c: The epoch is uncertain, either 1991.595 or 1991.603.
| Date | Filter | Tint | Seeing | Strehl | Comments |
|---|---|---|---|---|---|
| 2006-07-07 | z’ | 3000x100ms | 1.10 | 0.09 | |
| 2006-11-10 | z’ | 15000x25ms | 0.60 | 0.14 | Atmospheric dispersion |
| 2007-05-11 | i’ | 10000x30ms | 0.80 | 0.08 | |
| 2007-05-11 | z’ | 10000x30ms | 0.80 | 0.10 | |
| 2007-06-24 | z’ | 15000x30ms | 0.70 | 0.14 | |
| 2007-06-25 | z’ | 15000x30ms | 0.85 | 0.12 |
Note. — Summary of observations done with AstraLux. See text.
| Epoch | J | H | K | References |
|---|---|---|---|---|
| 22-09-2000 | 10.2790.026 | 9.3290.029 | 8.5930.020 | 2MASS |
| 02-06-2007 | 10.370.17 | 9.320.23 | 8.760.13 | This work |
| 03-06-2007 | 10.520.07 | 9.360.05 | 8.480.04 | This work |
| 04-06-2007 | 10.240.04 | 9.350.03 | 8.710.08 | This work |
| 05-06-2007 | 10.210.04 | 9.260.03 | 8.640.03 | This work |
| 08-06-2007 | 10.310.10 | 9.300.05 | 8.450.04 | This work |
Note. — JHK magnitudes from 2MASS and from the observations at the Carlos Sánchez telescope.
| Epoch | U | B | V | Rc | Ic | RJ | IJ | GG395-Bj | R59F | R61F | R63F | I9 | Refs. |
|---|---|---|---|---|---|---|---|---|---|---|---|---|---|
| 1952.556a | — | — | — | 12.920.1* | — | — | — | — | — | — | 12.84 | — | (1) |
| 1955.936 | — | — | — | 14.480.1* | — | — | — | 15.4(0.1) | 14.4(0.1) | — | (2) | ||
| 1955.941 | — | — | — | 14.580.1* | — | — | — | — | — | — | 14.502 | — | (3) |
| 1978.1: | — | — | — | — | — | — | — | — | — | — | — | 11.77 | (1) |
| 1965.753 | — | — | 12.870.1 | — | — | — | — | — | — | — | — | — | (4) |
| 1985.803 | — | 17.31: | 14.300.1 | — | — | — | — | — | — | — | — | — | (4) |
| 1986.715 | — | — | 15.020.1 | — | — | — | — | — | — | — | — | — | (4) |
| 1989.575 | — | — | — | — | — | — | — | 14.74 | — | — | — | (1) | |
| 1990.763 | — | — | — | — | — | — | — | — | — | 13.993 | — | — | (5) |
| 1990.789: | — | — | — | — | — | — | — | 14.22 | — | — | — | — | (6) |
| 1990.789: | — | — | — | — | — | — | — | 14.52 | — | — | — | — | (6) |
| 1990.789b | — | — | — | 14.050.1* | — | — | — | — | 14.08 | — | — | — | (1) |
| 1991.595c | — | — | — | — | — | — | — | 14.44 | — | — | — | (1) | |
| 1991.599 | — | — | — | — | — | — | — | 14.225 | — | — | — | — | (7) |
| 1993.552 | — | — | — | 13.660.1* | — | — | — | — | — | — | 13.58 | — | (6) |
| 1994.44 | — | — | — | — | — | — | — | — | — | — | — | 12.995 | (8) |
| 2000.674 | — | — | — | 12.9710.002 | 12.1410.002 | — | — | — | — | — | — | — | (9) |
| 2000.677 | — | — | 13.9150.002 | 12.9520.002 | 12.1410.002 | 12.520.07* | 11.70.2* | — | — | — | — | — | (9) |
| 2000.679 | — | — | — | 12.9790.002 | 12.1280.002 | — | — | — | — | — | — | — | (9) |
| 2000.684 | — | — | — | 12.9880.002 | 12.2130.002 | — | — | — | — | — | — | — | (9) |
| 2000.687 | — | — | — | 12.8780.003 | 11.9770.003 | — | — | — | — | — | — | — | (9) |
| 2000.690 | — | — | — | 12.8940.004 | 12.0300.002 | — | — | — | — | — | — | — | (9) |
| 2000.692 | — | — | — | 12.8850.002 | 12.0720.002 | — | — | — | — | — | — | — | (9) |
| 2001.723 | — | — | — | 12.7020.003 | 11.8460.002 | — | — | — | — | — | — | — | (9) |
| 2001.726 | — | — | — | 12.7100.003 | 11.9240.002 | — | — | — | — | — | — | — | (9) |
| 2001.729 | — | — | — | 12.7530.003 | 11.8570.003 | — | — | — | — | — | — | — | (9) |
| 2001.734 | — | — | — | 12.7150.003 | — | — | — | — | — | — | — | — | (9) |
| 2002.674 | 16.9870.009 | — | — | — | — | — | — | — | — | — | — | — | (9) |
| 2003.803 | 16.250.11 | — | — | — | — | — | — | — | — | — | — | — | (9) |
| 2006.504 | 15.040.02 | 14.510.01d | 13.1730.005 | 12.360.04* | 11.640.2* | 12.0240.011 | 11.200.01 | — | — | — | — | — | (10) |
| 2006.797 | 15.640.03 | 15.020.04d | 13.6130.004 | 12.760.03* | 11.980.2* | 12.4050.007 | 11.5250.008 | — | — | — | — | — | (10) |
| 2006.956 | 16.020.05 | 15.330.01d | 13.7830.004 | 12.880.03* | — | 12.4670.007 | — | — | — | — | — | — | (10) |
| 2006.995 | — | — | 14.8020.007 | 13.960.04* | 13.170.2* | 13.600.02 | 12.7140.005 | — | — | — | — | — | (10) |
| 2006.998 | — | — | 14.7290.004 | — | — | — | — | — | — | — | (11) | ||
| 2006.998 | — | — | 14.7270.008 | 13.930.06* | 13.150.2* | 13.610.01 | 12.7060.005 | — | — | — | — | — | (11) |
| 2007.005 | — | — | 14.7280.008 | 13.910.04* | 13.190.2* | 13.5710.009 | 12.7490.006 | — | — | — | — | — | (11) |
| 2007.049 | — | — | 13.9120.006 | 13.010.06* | 12.020.2* | 12.610.01 | 11.5070.005 | — | — | — | — | — | (11) |
| 2007.321 | — | — | 14.410.01 | 13.460.06* | — | 13.000.01 | — | — | — | — | — | — | (12) |
| 2007.435 | — | — | 13.260.02 | — | — | — | — | — | — | — | — | — | (10) |
| 2007.435 | 15.260.13 | 14.630.03 | 13.3020.009 | 12.430.08* | 11.730.2* | 12.060.02 | 11.290.01 | — | — | — | — | — | (10) |
| 2007.435 | — | — | 13.240.02 | — | — | — | — | — | — | — | — | — | (10) |
Note. — Optical data available for GM Cep. Asterisk indicates that the magnitude has been transformed into the given system, following the tranformations of Fernie (1983), Bessel (1979), Bessell et al. (1986),Blair & Gilmore (1982), Couch & Newell (1980). Uncertain magnitudes and epochs are marked by “:”. 1952.556a: The epoch is uncertain, either 1952.556 or 1955.936. 1990.789b: The epoch is uncertain, can be 1990.789, 1991.600, or 1993.070. 1991.595c: The epoch is uncertain, either 1991.595 or 1991.603. The d index for the B band data from the Königstuhl indicates that the zeropoint is uncertain (see Section 2.2). The references to the data catalog and/or telescope and instruments are: (1) = USNO B1.0, Monet et al.(2003); (2) = USNO-A2.0, Monet et al. (1998);(3) = SuperCosmos Catalog, Poss-I Red; (4) = Konkoly Observatory, Kun (1986); (5) = SuperCosmos Catalog, Poss-II Red; (6) = GSC 2.2 Catalogue; (7) = SuperCosmos Catalog, Poss-II Blue; (8) = SuperCosmos Catalog, Poss-II IR; (9) = 4Shooter/48” FLWO; (10) = 70cm Königstuhl; (11)=CAFOS/2.2m Calar Alto; (12)=CAFOS/2.2m Calar Alto spectroscopy mode.
| Line | (Å) | EW (Å) | Epoch | Comments |
|---|---|---|---|---|
| N II | 6548 | -0.02 | HIRES 2001 | |
| ” | ” | -0.04 | Hecto. 2004 | |
| H | 6563 | -6 | HIRES 2001 | Bluesh. abs. V-80 km/s, B=-2.0Å, R=-4.0Å |
| ” | ” | -10 | FAST 2001 | |
| ” | ” | -14 | Hectochelle 2004 | Bluesh. abs. V-60 km/s, B=-3.5Å, R=-10.5Å |
| ” | ” | -19 | CAFOS 2007 | |
| N II | 6583 | -0.03 | HIRES 2001 | |
| ” | ” | -0.08 | Hecto. 2004 | |
| S II | 6717 | — | HIRES 2001 | |
| S II | 6731 | -0.12 | HIRES 2001 | V-100 km/s |
| Fe II | 6516 | -0.06 | Hectochelle 2004 | |
| Fe I | 6495 | -0.04 | Hectochelle 2004 | |
| Li I | 6708 | 0.16 | HIRES 2001 | |
| ” | ” | — | FAST 2001 | Probably undetected because of veiling |
| ” | ” | — | CAFOS 2007 | |
| O I | 6363 | — | HIRES 2001 | May be masked by nearby absorption lines |
| O I | 7774 | 0.79 | HIRES 2001 | |
| ” | ” | 1.2 | CAFOS 2007 | |
| O I | 8446 | -0.52 | HIRES 2001 | V -140/+80 km/s, B=-0.32Å, R=-0.20Å |
| ” | ” | -0.2 | CAFOS 2007 | |
| Ca II | 8498 | -3.08 | HIRES 2001 | |
| ” | ” | -3.8 | CAFOS 2007 | |
| Ca II | 8542 | -2.2 | CAFOS 2007 | |
| Ca II | 8662 | -1.25 | HIRES 2001 | May be blended with H Pa 13 |
| ” | ” | -2.5 | CAFOS 2007 | May be blended with H Pa 13 |
Note. — Emission and absorption lines that related to accretion and/or winds. Negative and positive EW correspond to emission and absorption lines, respectively. The CAFOS 2007 data has simultaneous photometry showing V=14.410.01 and RJ=13.000.01. “B” and “R” indicate the EW of the blue- and redshifted components, respectively.
| Epoch | /Band (m) | Flux (Jy) | References |
|---|---|---|---|
| 1983.5 | 12 | 0.6590.046 | IRAS, computed by Vizier |
| 1983.5 | 25 | 0.8360.075 | IRAS, computed by Vizier |
| 1983.5 | 60 | 1.440.20 | IRAS, computed by Vizier |
| 1983.5 | 100 | 2.60 | IRAS, computed by Vizier |
| 1996-1998 | 8.28/A | 0.6220.031 | MSX6C, (Egan et al. 2003) |
| 1996-1998 | 12.13/C | 0.629 | MSX6C, (Egan et al. 2003) |
| 1996-1998 | 14.65/D | 0.482 | MSX6C, (Egan et al. 2003) |
| 1996-1998 | 21.0/E | 1.37 | MSX6C, (Egan et al. 2003) |
| 2003.970 | 3.6 | 0.2470.012 | IRAC/Spitzer (Paper III) |
| 2003.970 | 4.5 | 0.2190.011 | IRAC/Spitzer (Paper III) |
| 2003.970 | 5.8 | 0.2560.013 | IRAC/Spitzer (Paper III) |
| 2003.970 | 8.0 | 0.2820.014 | IRAC/Spitzer (Paper III) |
| 2004.477 | 23.9 | 0.7910.079 | MIPS/Spitzer (Paper III) |
| 2004.477 | 70.0 | 0.8290.083 | MIPS/Spitzer (Paper III) |
Note. — Mid-IR fluxes from the literature.
| (Å) | Standard/Sp.Type | R | CZ (km/s) | V (km/s) | Comments |
|---|---|---|---|---|---|
| 6370 | HD222368/F7V | 3.4 | -22.18.1 | 49.911.5 | |
| 6470 | HD222368/F7V | 10.9 | -23.92.7 | 41.23.5 | |
| 6590 | HD222368/F7V | 1.3 | -19.712.7 | 44.219.4 | Few lines |
| 6710 | HD222368/F7V | 4.0 | -30.75.8 | 43.38.7 | |
| 6840 | HD122693/F8V | 1.6 | -27.212.0 | 52.520.4 | Few lines |
| 7110 | HD222368/F7V | 5.1 | -8.03.9 | 49.18.1 | |
| 7410 | HD222368/F7V | 6.7 | -25.64.3 | 47.76.2 | |
| 7730 | HD122693/F8V | 3.5 | -26.37.0 | 50.411.3 | |
| 7910 | HD222368/F7V | 4.7 | -14.94.7 | 41.07.2 | |
| 8670 | HD126053/G1V | 2.2 | -25.49.9 | 42.713.5 | |
| 8270 | HD222368/F7V | 1.6 | -13.59.5 | 40.015.6 | Few lines |
| 8470 | HD122693/F8V | 1.4 | -29.010.7 | 38.015.7 | Few lines |
| 8470 | HD126053/G1V | 1.4 | -28.112.0 | 46.019.0 | Few lines |
Note. — Results of the cross-correlation for the different orders of the HIRES spectrum, including the standard used for comparison and its spectral type, the R parameter, indicative of the goodness of the correlation (Tonry & Davis 1979; Hartmann et al. 1986; Kurtz et al. 1992), the radial velocity CZ, and the rotational velocity V. Some parts of the spectra are affected by H2O and O2 atmospheric absorption bands, leading to small regions free of absorption, few lines to correlate, and worse correlations (R2). The orders centered in 6970 and 8090Å are so strongly affected by atmospheric absorption features that we could not cross-correlate them.
| Distance (AU) | Separation (”) | (mag) |
|---|---|---|
| 60 | 0.07 | -0.5 |
| 90 | 0.10 | -1.2 |
| 100 | 0.11 | -1.8 |
| 150 | 0.17 | -2.0 |
| 200 | 0.22 | -2.6 |
| 250 | 0.27 | -3.2 |
| 300 | 0.33 | -3.5 |
| 350 | 0.39 | -3.8 |
| 400 | 0.44 | -3.9 |
| 425 | 0.47 | -4.0 |
| 450 | 0.50 | -4.1 |
| 500 | 0.56 | -4.4 |
| 600 | 0.67 | -4.6 |
| 700 | 0.78 | -4.8 |
| 800 | 0.89 | -5.0 |
| 900 | 1.00 | -5.3 |
| 1000 | 1.11 | -5.5 |
| 1500 | 1.68 | -6.2 |
| 2000 | 2.22 | -6.4 |
| 2500 | 2.78 | -6.6 |
| 3000 | 3.33 | -6.6 |
| 3500 | 3.89 | -6.6 |
Note. — Detection limits for binary companions with AstraLux. Based on a 5 detection over the background.