A Half-Megasecond Chandra Observation of the Oxygen-Rich Supernova Remnant G292.0+1.8
Abstract
We report on our initial analysis of a deep 510 ks observation of the Galactic oxygen-rich supernova remnant (SNR) G292.0+1.8 with the Chandra X-ray Observatory. Our new Chandra ACIS-I observation has a larger field of view and an order of magnitude deeper exposure than the previous Chandra observation, which allows us to cover the entire SNR and to detect new metal-rich ejecta features. We find a highly non-uniform distribution of thermodynamic conditions of the X-ray emitting hot gas that correlates well with the optical [O III] emission, suggesting the possibility that the originating supernova explosion of G292.0+1.8 was itself asymmetric. We also reveal spectacular substructures of a torus, a jet, and an extended central compact nebula all associated with the embedded pulsar J11245916.
1 INTRODUCTION
G292.0+1.8 is one of only three known “oxygen-rich” supernova remnants (SNRs) in the Galaxy (Goss et al., 1979; Murdin & Clark, 1979), the others being Cassiopeia A and Puppis A. Optical emission from these SNRs contains fast-moving ( 1000 km s-1) O-rich ejecta knots, which is generally taken as evidence for He-burning nucleosynthesis in the core of massive stars ( 10 M⊙) (e.g., Blair et al. 2000). O-rich SNRs provide a rare opportunity for the study of core-collapse supernova (SN) nucleosynthesis and the subsequent evolution of the remnant, including in particular the interaction of ejecta fragments and the blast wave with circumstellar medium (CSM) produced by massive stellar winds from the progenitor. G292.0+1.8 is especially intriguing because it exhibits all the characteristics of a textbook-example core-collapse SNR: a central pulsar and pulsar wind nebula (PWN), metal-rich ejecta, shocked CSM, and the blast wave.
To facilitate a study of SNR G292.0+1.8 in unprecedented detail, we performed a deep AO7 Chandra observation during 2006 September 13October 20, with the SNR centered on the I-array of the Advanced CCD Imaging Spectrometer (ACIS). Our ACIS-I observation takes advantage of a larger (17′17′) field of view (FOV) and an order of magnitude deeper exposure (510 ks) than the previous Chandra ACIS-S3 observation (8′8′ FOV and 43 ks exposure; Hughes et al. 2001). This new deep Chandra observation is an essential part of our multi-wavelength campaign on G292.0+1.8, including new observations in the radio, infrared, optical, and X-ray bands. Here we report on first results from the new Chandra images: a large-scale overview of the SNR in § 2 and new insights into the nature of the PWN in § 3. A description of the observations, data reduction, and results from extensive spectral and imaging analyses of detailed substructures of the SNR and PWN will be presented elsewhere.
2 Supernova Remnant
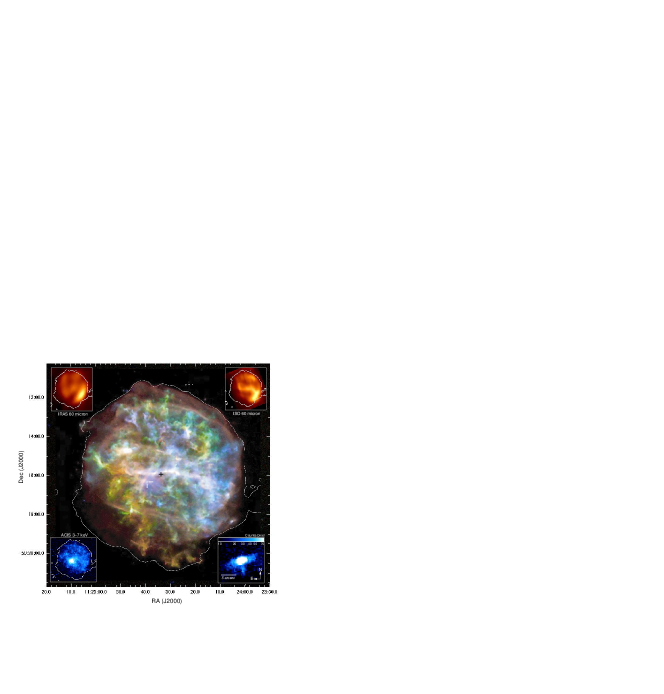
Figure 1 shows an X-ray color image of G292.0+1.8 created from our deep Chandra data. The outer boundary of the radio SNR is overlaid with a white contour. The energy bands displayed in each color were chosen to emphasize major atomic line emission that illustrates the distribution of electron temperatures and ionization states across the SNR (Table 1). We note that line and underlying continuum emission is included in each subband; e.g., the bright blue emission near the SNR’s center is dominated by synchrotron emission from the PWN (see the inset in Figure 1; Hughes et al. 2001). Our deep ACIS-I exposure comprehensively images the entire SNR to its faint outermost edge, which matches well the extent of the radio remnant (Figure 1) and traces the location of the blast wave. Ejecta knots (Park et al. 2004, Gonzalez & Safi-Harb 2003) appear brightly colored – yellow, green or blue – in Figure 1. They extend closest to the rim in the west and south and are furthest away in the SE quadrant. Due to their red-orange color in Figure 1 and positional coincidence with [O III] ejecta (Winkler & Long, 2006), the southernmost X-ray knots are likely to be O-rich as well. The SNR’s full diameter is 96 (N-S) and 84 (E-W), corresponding to physical sizes of 14.716.7 pc, where is the distance to G292.0+1.8 in units of 6 kpc, the distance we assume throughout (Gaensler & Wallace, 2003).
Our new image of G292.0+1.8 shows little evidence for the featureless, spectrally-hard, and geometrically-thin X-ray filaments that trace sites of efficient particle acceleration in other young SNRs, such as Cas A, Tycho, and SN 1006. Instead the SNR’s rim is defined by spectrally-soft emission that is faint and diffuse in places (e.g., the SE rim) and filamentary elsewhere. Particle acceleration is evidently occurring under rather different conditions in G292.0+1.8 than other young Galactic SNRs.
The SNR interior contains a complex network of knots and filaments with a variety of colors and morphologies. The overall color distribution of these features is highly asymmetric; red-orange emission is dominant in the S-SE, while the W-NW regions are bright in emission appearing green-blue in color. We are confident that these variations largely reflect differences in the underlying distributions of gas temperature and ionization in the metal-rich ejecta, rather than variable foreground absorption. This is supported by the relative spatial distributions of the Ne He and Ly lines. Because these lines are separated in energy by only 0.1 keV, their flux ratio is insensitive to absorption variations. The equivalent width maps show that Ne He emission is relatively enhanced in the S-SE, while Ne Ly emission is enhanced in the W-NW (Park et al., 2002). The metal abundance variation is also unlikely a significant contributor for the observed large-scale color variation based on our hardness ratio (HR) analysis (see below).
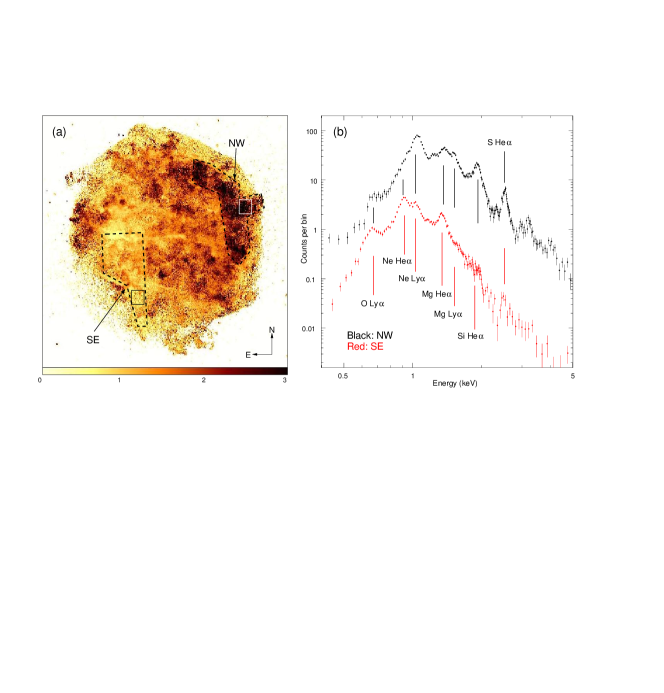
We constructed a HR map (Figure 2a) to investigate further the variation in the thermodynamic state of the ejecta across G292.0+1.8. (For technical reasons we added the continuum component [ 1.25 keV] to the soft band line emission to enhance the hard band lines and suppress the strong hard continuum emission from the PWN.) There are prominent enhancements in Figure 2a near the W and NW boundary of the SNR that generally trace “fingers” of hot ejecta protruding out to the very boundary of the SNR (green-blue filaments in Figure 1). There is also an overall large-scale variation from HR values 2.4 in the hard “NW” region to 1.1 in the soft “SE” region (Figure 2a). Example spectra extracted from small regions within the larger “NW” and “SE” regions clearly show the distinctive line ratios responsible for the observed HR variation (Figure 2b). We can draw on our previous work fitting the spectra of individual knots to relate HR values to plasma temperatures. Spectral region 3 from Park et al. (2004) lies in the hard “NW” region, and spectral analysis yields a best-fit keV, corresponding to HR 2.5. We find that this HR value strongly traces the electron temperature rather than on individual elemental abundances. Although we did not study knots in the soft “SE” region previously, our preliminary spectral modeling of the SE regions favors significantly lower temperatures ( 0.7 keV), corresponding to HR values 1.0. Thus, the observed HR distribution reveals a large-scale spatial variation of thermal condition of metal-rich ejecta, which could not be detected by previous low-resolution data (Hughes & Singh, 1994); i.e., a significantly higher temperature of the hot gas ( 5 keV) is implied in the N-W regions, while a relatively lower-temperature plasma ( 1 keV) prevails in the S-E regions of the SNR.
There is also a very similar and highly significant gradient in the optical properties of G292.0+1.8. The region with the lowest HR values is coincident with the bulk of the optical [O III] emission indicated by “SE” region in Figure 2a (Ghavamian et al., 2005; Winkler & Long, 2006). Across the projected middle of the SNR (within an 3′ wide region aligned roughly N-S), there are dozens of isolated optical knots (generally uncorrelated with X-ray knots), while on the western edge no optical emission appears at all. This high degree of correlation between the optical and X-ray properties suggests the possibility that radiative cooling in the ejecta is responsible for the SE-NW gradient in observed properties. In this picture, the SE ejecta would be undergoing significant, perhaps catastrophic cooling. Across the projected middle of the SNR, cooling is probably just beginning to occur in isolated knots that happen to have the appropriate thermodynamic conditions, while the emission toward the NW remains fully nonradiative. Variation in the ambient density surrounding G292.0+1.8 could provide an explanation for the observed asymmetry in the ejecta properties. However, there is no evidence for a higher density in the SE regions (Braun et al., 1986) as would be expected. In fact, 60 m images111The apparent differences in the detailed structure of the two IR images in Figure 1 are unlikely to be real because of the highly processed nature of both images. The ISO image was constructed from a rastor scan of many pointings using a pixel (45′′ per pixel) IR array that, unfortunately, did not fully cover the SE rim of the SNR. The IRAS image, which did cover the entire SNR, was the result of an image reconstruction process intended to improve the angular resolution from the native value of several arcminutes to the level of 1′2′. Given these significant differences, the overall general agreement between the images, specifically, the brightness of the SW rim and the faintness toward the SE, seems reasonable to us. (see upper right and upper left insets to Figure 1) show that around the rim of the SNR the SE region is a minimum in flux, while the SW is a maximum. Thus, albeit somewhat speculative at the current stage of the analysis, we raise the possibility that the ejecta asymmetry has its origin in some intrinsic asymmetry of the SN explosion itself, such as a variation in the density or velocity distribution from SE to NW. Further work including detailed X-ray spectral analysis of ejecta and hydrodynamic studies appropriate for G292.0+1.8 are required to test this asymmetric explosion scenario.
3 Pulsar Wind Nebula
Previous Chandra observations of G292.0+1.8 (Hughes et al., 2001) revealed a point source, now known to be the pulsar J11245916 (Camilo et al., 2002; Hughes et al., 2003), powering an extended synchrotron nebula (Torii et al., 1998) (see the lower left inset to Figure 1). The emission from the pulsar itself was observed to be surrounded by a compact elliptical structure roughly 18 1′′ in size. Our deep ACIS-I observation confirms this structure, and reveals additional faint emission suggestive of a jet/torus structure ( in jet length and torus radius, repectively; see the lower right inset to Figure 1) similar to those observed to form just outside the pulsar wind termination shock region in a number of other young PWNe (e.g., Gaensler & Slane 2006 and references therein). Our preliminary spectral analysis indicates that these features show a power law spectrum with photon index 1.51.8, supporting the idea that they are synchrotron emission associated with the PWN. The ratio between the N-S and E-W sizes of the torus implies an inclination of the axis of the torus (with respect to the line of sight) of 20∘. Physical sizes are then 0.4 pc for the jet and a radius of 0.15 pc for the torus. This is similar to the size of the jet/torus structure observed in 3C 58 Slane et al. (2002), although we note that there is large variation in the size and relative brightness of such structures from system to system.
Since the E-W “belt” of the SNR (Tuohy et al., 1982) appears to be a relic feature of the progenitor star’s equatorial winds Park et al. (2002), the pulsar spin-axis defined by the N-S orientation of the jet is generally aligned with the progenitor’s rotation axis, at least in projection. If the pulsar position offset to the SE of the radio center of the SNR represents the direction of the pulsar velocity, a misalignment of 70∘ between the projected velocity and spin-axis vectors is implied.
This is in contrast to the strong tendency toward spin-kick alignment claimed by Ng & Romani (2007), although it is important to note that many of their estimated velocity vectors are, like ours, based on pulsar offsets from the geometric centers of their host SNRs – a technique that is quite sensitive to the ambient density since the SNRs will expand more rapidly in the direction of lower density, thus creating a shell that is not centered on the explosion point. Without a proper motion measurement, our results for J11245916 are thus not conclusive, although the density distribution inferred from the 60 m data, which is enhanced in the NW-W-SW direction, is difficult to reconcile with the current pulsar position if the observed spin axis is aligned with the velocity vector. Finally, we note that our results are even consistent with possible orthogonality between the spin and kick directions, as might be suggested for some pulsars based on polarization measurements (Johnston et al., 2005; Rankin, 2007).
4 Summary
Our deep Chandra observation of SNR G292.0+1.8 detects the entire outer boundary of the blast wave and reveals metal-rich ejecta knots reaching the shock front. We find no evidence for strong particle acceleration sites in X-rays. The initial large-scale analysis reveals a highly non-uniform distribution of X-ray emitting hot gas. This overall structure is caused by an asymmetric distribution of the gas temperatures, rather than variable foreground absorption. The expected properties of the ambient medium required to explain this asymmetry are inconsistent with observations, which leads us to the supposition that the supernova explosion itself was asymmetric. A detailed X-ray spectral analysis of the metal-rich ejecta and hydrodynamical simulations will be required to test this scenario. Proper motion measurements of the blast wave using the new radio data and detailed IR/optical studies of thermal states of cooling ejecta will also be important tests.
We discover a torus and a jet associated with the PWN of the embedded pulsar J11245916, similar to a growing number of such structures observed in other young pulsar-driven systems. Assuming that the pulsar’s birthplace was at the geometric center of the radio SNR and that the jet defines the direction of the pulsar spin axis, we find a large misalignment of between the spin and kick velocity directions, in apparent contrast to suggestions of spin-kick alignments in other systems.
References
- Blair et al. (2000) Blair, W. P. et al. 2000, ApJ, 537, 667
- Braun et al. (1986) Braun, R., Goss, W. M., Caswell, J. L., & Roger, R. S. 1986, A&A, 162, 259
- Camilo et al. (2002) Camilo, F., Manchester, R. N., Gaensler, B. M., Lorimer, D. R., & Sarkissian, J. 2002, ApJ, 567, L71
- Cao et al. (1997) Cao, Y., Terebey, S., Prince, T. A., & Beichman, C. A. 1997, ApJS, 111, 387
- Gaensler & Wallace (2003) Gaensler, B. M. & Wallace, B. J. 2003, ApJ, 594, 326
- Gaensler & Slane (2006) Gaensler, B. M. & Slane, P. O. 2006, ARAA, 44, 17
- Ghavamian et al. (2005) Ghavamian, P., Hughes, J. P. & Williams, T. B. 2005, ApJ, 635, 365
- Gonzalez & Safi-Harb (2003) Gonzalez, M. & Safi-Harb, S. 2003, ApJ, 583, L91
- Goss et al. (1979) Goss, W. M., Shaver, P. A., Zealey, W. J., Murdin, P., & Clark, D. H. 1979, MNRAS, 188, 357
- Hughes & Singh (1994) Hughes, J. P. & Singh, K. P. 1994, ApJ, 422, 126
- Hughes et al. (2001) Hughes, J. P., Slane, P. O., Burrows, D. N., Garmire, G. P., Nousek, J. A., Olbert, C. M., & Keohane, J. W. 2001, ApJ, 559, L153
- Hughes et al. (2003) Hughes, J. P., Slane, P. O., Park, S., Roming, P. W. A., & Burrows, D. N. 2003, ApJ, 591, L139
- Johnston et al. (2005) Johnston, S., Hobbs, G., Vigeland, S., Kramer, M., Weisberg, J. M., & Lyne, G. 2005, MNRAS, 364, 1397
- Murdin & Clark (1979) Murdin, P., & Clark, D. H. 1979, MNRAS, 189, 501
- Ng & Romani (2007) Ng, C.-Y. & Romani, R. W. 2007, ApJ, 660, 1357
- Park et al. (2002) Park, S., Roming, P. W. A., Hughes, J. P., Slane, P. O., Burrows, D. N., Garmire, G. P., & Nousek, J. A. 2002, ApJ, 564, L39
- Park et al. (2004) Park, S., Hughes, J. P., Slane, P. O., Burrows, D. N., Roming, P. W. A., Nousek, J. A., & Garmire, G. P. 2004, ApJ, 602, L33
- Rankin (2007) Rankin, J. M. 2007, ApJ, 664, 447
- Slane et al. (2002) Slane, P. O., Helfand, D. J., & Murray, S. S. 2002, ApJ, 571, L45
- Torii et al. (1998) Torii, K., Tsunemi, H., & Slane, P. O. 1998, in The Hot Universe, Proc. of IAU Symp. No. 188, eds. K. Koyama, S. Kitamoto, & M. Itoh, (Dordrecht:Kluwer Academic), 258
- Tuohy et al. (1982) Tuohy, I. R., Clark, D. H., & Burton, W. M. 1982, ApJ, 260, L65
- Winkler & Long (2006) Winkler, P. F. & Long, K. S. 2006, AJ, 132, 360
| Energy Band | Identification | Color | Energy Band | Identification | Color |
|---|---|---|---|---|---|
| (keV) | (keV) | ||||
| 0.400.50 | Continuum | - | 1.161.25 | Continuum | - |
| 0.580.71 | O Ly | Red | 1.281.43 | Mg He | Green |
| 0.750.84 | Continuum | - | 1.812.05 | Si He | Blue |
| 0.880.95 | Ne He | Red | 2.402.62 | S He | Blue |
| 0.981.10 | Ne Ly | Orange | - | - | - |