Low-Ionization Emission Regions in Quasars:
Gas Properties Probed with Broad O I and Ca II Lines
Abstract
We have compiled the emission-line fluxes of O I 8446, O I 11287, and the near-infrared (IR) Ca II triplet (8579) observed in 11 quasars. These lines are considered to emerge from the same gas as do the Fe II lines in the low-ionized portion of the broad emission line region (BELR). The compiled quasars are distributed over wide ranges of redshift (0.06 1.08) and of luminosity (), thus providing a useful sample to investigate the line-emitting gas properties in various quasar environments. The measured line strengths and velocities, as functions of the quasar properties, are analyzed using photoionization model calculations. We found that the flux ratio between the Ca II triplet and O I 8446 is hardly dependent on the redshift or luminosity, indicating similar gas densities in the emission region from quasar to quasar. On the other hand, a scatter of the O I 11287/8446 ratios appears to imply the diversity of the ionization parameter. These facts invoke a picture of the line-emitting gases in quasars that have similar densities and are located at regions exposed to various ionizing radiation fluxes. The observed O I line widths are found to be remarkably similar over more than 3 orders of magnitude in luminosity, which indicates a kinematically determined location of the emission region and is in clear contrast to the case of H I lines. We also argue about the dust presence in the emission region since the region is suggested to be located near the dust sublimation point at the outer edge of the BELR.
1 Introduction
Active galactic nuclei (AGNs) are known to have strong emission lines of various ion species. Among them, the Fe II emission lines are one of the most prominent features in the ultraviolet (UV) to optical spectrum of many AGNs. They have long been hoped to provide significant information about some aspects of the AGNs and their host environments, e.g., energy budget of the line emission region and the epoch of the first star formation in the host galaxies. The determination of the first star formation epoch is based on the standard theory that the iron enrichment in galaxies is delayed compared to that of the -elements, such as magnesium, due to their different origins; Type Ia supernovae for iron and Type II supernovae for the -elements (Hamann & Ferland, 1993; Yoshii et al., 1998). The delay corresponds to the difference in life-times of the progenitors of the two types of supernovae, and is estimated to be 0.3 – 1 Gyr depending on the host galaxy environments (Yoshii et al., 1996; Matteucci & Recchi, 2001). Many observations have been devoted to the measurement of Fe II/Mg II line flux ratios in high-redshift quasars for this purpose over the last decade (e.g., Elston et al., 1994; Kawara et al., 1996; Dietrich et al., 2002, 2003; Iwamuro et al., 2002, 2004; Freudling et al., 2003; Maiolino et al., 2003). However, the observed Fe II/Mg II ratios show a large scatter, preventing a detection of any significant trend in the Fe abundance as a function of redshift. While a part of the scatter might be due to the difference in the intrinsic Fe/Mg abundance ratio, it is presumable that the diversity of the physical condition within the line-forming gas, affecting line emissivities, is the main cause (Verner et al., 2003; Baldwin et al., 2004). In the same sense, a change of the observed Fe II/Mg II ratio as a function of redshift, if found, should be carefully examined to tell whether it reflects the abundance evolution or the systematic variation of the line emissivity. Thus establishment of a method to probe the line-emitting gas and estimate its physical parameters such as density and incident-ionizing radiation flux has been much awaited.
Unfortunately, the Fe+ atom is characterized by an enormous numbers of possible electronic transitions, yielding the “Fe II pseudocontinuum” often observed in AGN spectra, which makes analysis of the observations extremely difficult from both the observational and theoretical viewpoints (e.g., Tsuzuki et al., 2006, hereafter T06). On the other hand, a promising approach is to use the emission lines emitted by simple atoms in the same region as the Fe II lines. The most potent lines are O I and Ca II, whose co-spatial emergence with Fe II is indicated by a resemblance of their profiles (Rodríguez-Ardila et al., 2002a) and by a correlation between the line strengths (Persson, 1988). Note that it is a natural consequence of similar ionization potentials of the relevant ions, i.e., 16.2 eV for Fe II, 13.6 eV for O I, and 11.9 eV for Ca II.
The first extensive study of the physical properties of O I emitting gases in AGNs was presented by Grandi (1980), who observed the strongest O I line, 8446, as well as other weaker O I lines in Seyfert 1 (Sy1) galaxies. He found that O I 8446 lacks the narrow component that characterizes other permitted lines, and concluded that the line is purely a BELR phenomenon. He also suggested that O I 8446 is produced by Ly fluorescence, which was later confirmed by the observation of I Zw 1, the prototype narrow-line Seyfert 1 (NLS1), by Rudy et al. (1989). Rodríguez-Ardila et al. (2002b) compiled the UV and near-IR O I lines, namely, 1304, 8446, and 11287, in normal Sy1s and NLS1s in order to investigate their flux ratios. They found that there must be an additional excitation mechanism for O I 8446—besides Ly fluorescence—which they concluded is collisional excitation. As for the Ca II lines, extensive studies of Sy1s were presented by Persson (1988) and Ferland & Persson (1989). We have observed seven quasars at redshifts up to 1.0 for the purpose of obtaining the UV and near-IR O I and Ca II lines, thus extending the previous studies to include quasars at high redshifts. Photoionization model calculations were performed and compared with the observations, which led us to conclude that the O I and Ca II lines are formed in a gas with density cm-3, illuminated by the ionizing radiation corresponding to the ionization parameter of (Matsuoka et al., 2005, 2007, the latter is referred to as Paper I hereafter).
Now that the general properties of the O I and Ca II emitting gas, as a whole, are thus being revealed, we should turn our eyes to the following question: how are these gas properties related to the quasar characteristics, such as redshift and luminosity? Here we present results of a compilation of the emission-line fluxes of O I 8446, O I 11287, and the near-IR Ca II triplet (8498, 8542, and 8662) observed in 11 quasars. The quasars are distributed over wide ranges of redshift (0.06 1.08) and of luminosity (), thus providing a useful sample to track the line-emitting gas properties in various quasar environments. The observational and theoretical data used in this work are described in §2, and results and discussion appear in §3. Our conclusions are summarized in §4.
2 Data
2.1 Observations
A quasar sample is compiled from Matsuoka et al. (2005), Riffel et al. (2006), and Paper I. Their observational characteristics111 The -band absolute magnitudes of the quasars are taken from Véron-Cetty & Véron (2006) who assumed the cosmological parameters of = 50 km s-1 Mpc-1 and = 0. In a flat cosmology with = 71 km s-1 Mpc-1, = 0.29, and = 0.71 (e.g., Riess et al., 2004), the absolute magnitudes would be systematically smaller than listed in Table 1 by 0.6 – 0.7 mag (see Fig. 2 in Véron-Cetty & Véron, 2006). However, such a systematic change does not affect our arguments below. are summarized in Table 1. The sample in Riffel et al. (2006) mainly provides quasars in the local universe ( 0.1); they selected the quasars from the Palomer bright quasar survey of Schmidt & Green (1983) with the criteria of (1) being well-known studied sources in the optical/UV and X-ray regions, and (2) having the -band magnitude limited to 12. On the other hand, the quasars in Matsuoka et al. (2005) and Paper I constitute a high-redshift sample with redshifts up to 1.0. The selection criteria used in those works are that (1) the UV spectrum is available in the Hubble Space Telescope Faint Object Spectrograph archive (Evans & Koratkar, 2004); and (2) O I 8446, O I 11287, and the near-IR Ca II triplet fall within the atmospheric windows. Then the brightest objects in the target list were observed, which have the -band magnitudes of 15.
Although the fluxes of the relevant O I and Ca II lines have been measured in Riffel et al. (2006), we re-measured them with the identical method to Paper I in order to remove any systematic differences due to the different measurement strategies, especially for deblending the O I 8446 + the Ca II triplet feature. The 1 error of the spectra is assumed to be 1% of the continuum level while their spectra apparently have the higher qualities. The measured fluxes of O I 11287 is plotted versus those listed in Riffel et al. (2006) in Figure 1; they are in good agreement with each other, which is well within the accuracy needed in this work. We also re-measured the emission-line fluxes of PG 1116215 studied in Matsuoka et al. (2005), since we did not cover the Ca II lines in that work.
The measured line strengths are listed in Table 2 as the photon number flux ratios of the Ca II triplet/O I 8446 and of O I 11287/O I 8446, and as the rest-frame equivalent widths (EWs) of O I 8446. These forms of expression are particularly useful in discussing the line formation processes. Hereafter they are expressed as (Ca II)/(O I 8446), O I (11287)/(8446), and EW (O I 8446), respectively.
2.2 Model Calculations
In order to interpret the observations, we utilize the model calculations presented in Paper I. They are briefly summarized below.
The model calculations were performed in the framework of the photoionized BELR gas using the photoionization code Cloudy, version 06.02 (Ferland et al., 1998). Two shapes of the incident continuum were adopted, which are “standard AGN ionizing continuum”s reported in T06 and in Korista et al. (1997, hereafter K97). However, we found little effect on the predicted O I and Ca II line ratios by changing the incident continuum shape from one to another. The BELR gas was modeled to have a constant hydrogen density (cm-3) and be exposed to the ionizing continuum with a photon flux of (s-1 cm-2). In the calculations, the ionizing continuum flux was expressed with the ionization parameter where is the speed of light. The gas column density was set to 1023 cm-2 and was changed in a range of cm-2, while the chemical abundance was assumed to be solar. Three cases of the microturbulence were considered, whose velocity is 0, 10, and 100 km s-1.
The different continuum shapes and the microturbulent velocities were combined into four baseline models (Model 1 with T06 continuum and = 0 km s-1, Model 2 with T06 continuum and = 10 km s-1, Model 3 with T06 continuum and = 100 km s-1, and Model 4 with K97 continuum and = 100 km s-1). We searched in the gas physical parameter space of (, ) in each model for the parameter sets that reproduce the observed O I and Ca II line strengths, and found that all baseline models with (, ) around ( cm-3, ) best fit to the observations. On the other hand, the observed shape and EW of the Fe II UV emission could not be reproduced unless the microturbulent velocity of 100 km s-1 was assumed (Baldwin et al., 2004). Thus we adopt Model 3 as the default baseline model below, while we get little change of the results in this work concerning the analysis of the O I and Ca II lines when other baseline models are adopted. The (, ) parameters that best fit to the observations in Model 3 are (, ) = (1012.0 cm-3, 10-2.5), which are used as the reference grid point below.
3 Results and Discussion
3.1 A Picture of the Dust-Free Emission Region
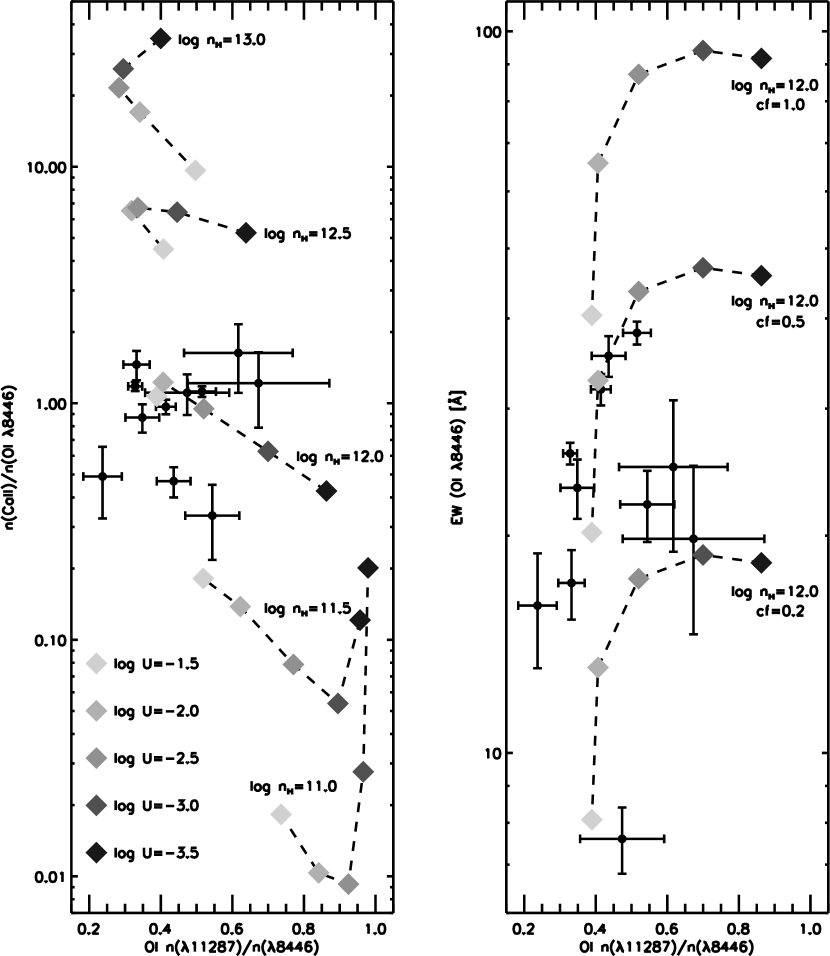
We plot the observed values of (Ca II)/(O I 8446), O I (11287)/(8446), and EW (O I 8446) as functions of the redshift and of the -band absolute magnitude in Figure 2. One of the remarkable results is found in the top panels; the Ca II/O I 8446 ratio is hardly dependent on redshift or luminosity over the plotted range, while the ratio is predicted to be very sensitive to the density of the line-emitting gas in the photoionization models. We show the model predictions on the (Ca II)/(O I 8446) – O I (11287)/(8446) plane in Figure 3 (left), as well as the observed values (see also Fig. 7 in Paper I222 Note that Figure 7 in Paper I shows the predictions of Model 1, which is not adopted in this paper since the assumed microturbulent velocity, = 0 km s-1, could not reproduce the observed Fe II UV emissions (see §2.2). However, Model 3 adopted in this work predict very similar results to those shown in Figure 7 regarding the O I and Ca II emissions, while the whole pattern of contour is slightly ( 0.5 dex) shifted to the high-density regime; the best-fit parameters in Model 1 are (, ) = (1011.5 cm-3, 10-3.0). ). The gas density and the ionization parameter are changed around the reference grid point, (, ) = (1012.0 cm-3, 10-2.5), over 2 orders of magnitude in both parameters. It is clearly seen that the predicted (Ca II)/(O I 8446) ratio increases monotonically with the increased gas density, and that all the observed values are marked with the density in the vicinity of the reference point, log = 12.0. Thus the similar density of the line-emitting gases are strongly indicated for the quasars distributed over these redshift and luminosity ranges.
The values of EW (O I 8446), both observed and calculated with the density of log = 12.0, are shown in Figure 3 (right) as a function of the O I (11287)/ (8446) ratio. It shows that the predictions of EWs are also consistent with the observed data when log = 12.0 and a covering fraction (cf) of the line-emitting gas as seen from the central energy source of 0.2 – 0.5 are assumed. Note that the covering fraction could be much smaller if we assumed oxygen overabundance relative to the solar value.
On the other hand, a scatter of the observed data in the O I (11287)/ (8446) axis seems to be related to the diversity of the ionization parameter (Fig. 3, left). Note that the diversity of other parameters, such as microturbulent velocity, gas column density, and chemical composition, could not explain this diagram since they significantly alter the (Ca II)/(O I 8446) ratio, rather than O I (11287)/ (8446), and thus they are unable to explain the observed similarity of the former ratios (Paper I). It is also quite unlikely that the diversity of these parameter values is balanced out by the fine-tuned density in such a way that the (Ca II)/(O I 8446) ratio is always kept to be 1.0, unless these lines are the dominant heating or cooling sources of the emission region. As with the (Ca II)/(O I 8446) ratio, O I (11287)/ (8446) is not clearly dependent on the redshift or luminosity (Fig. 2, middle left and middle right).
The above arguments invoke a picture of the line-emitting gases in quasars that have similar densities and are located at regions exposed to various ionizing radiation fluxes. It would be a consequence of the difference in distance to the central continuum source and/or in the intrinsic luminosity of the quasars. Note that it is in clear contrast to the well-studied case of H, whose emission regions in AGNs are known to be characterized by similar ionization parameters. In fact, reverberation mapping results for H show the emission region size () – luminosity () relation of , which is consistent with the constant ionization parameter regime (Peterson et al., 2002; Bentz et al., 2006). Such a situation has long been expected in order to account for the remarkably similar AGN spectra over a broad range of luminosity, and was incorporated into the locally optimally emitting cloud (LOC) model suggested by Baldwin et al. (1995), that is, that the BELR is composed of gas with widely distributed physical parameters and each emission line arises from its preferable environment. On the other hand, the case in O I and Ca II lines apparently indicates that the location of the emission region is not radiation-selected.
In line with the above arguments, we found a clear difference of the velocity-luminosity relation between O I and H; the measured O I line widths are plotted versus in Figure 4, which shows that the O I line widths are remarkably similar, concentrated around 1500 – 2000 km s-1, over more than 3 orders of magnitude in the -band luminosity. On the other hand, those for the hydrogen Balmer lines usually have a large scatter as shown by, e.g., Kaspi et al. (2000); their sample of 34 AGNs, spanning over 4 orders of magnitude in continuum luminosity, has the line widths of 1000 – 10,000 km s-1. Such a trend is also indicated by Persson (1988), who reported that while the correlation between FWHM (O I) and FWHM (H) is good for the small FWHM regime, the O I lines grow systematically narrower than H at large line width. Rodríguez-Ardila et al. (2002a) conducted a detailed study of the near-IR emission line profiles in NLS1s, and found that O I, Ca II, and Fe II lines are systematically narrower than the broad components of other low-ionization lines such as hydrogen Paschen lines and He I 10830. They also argued that these lines are produced in the outermost portion of the BELR, since their widths are just slightly broader than those of [S III] 9531 which they assumed is formed in the inner portion of the narrow emission line region (NELR). While the scattered widths of H I lines could be interpreted as a consequence of the radiation-selected locations of the emitting gases, regardless of the gas kinematics, the remarkable similarity of the O I line widths might imply the kinematically determined emission regions. In such a situation, the diversity of the ionization parameters, as discussed above, would be an inevitable result. As stated by Persson (1988), there is clearly interesting information which could be deduced from studies of the O I and H I line profiles; especially, reverberation mapping of these O I and Ca II lines would be a powerful tool to reveal the underlying physics.
3.2 A Picture of the Dusty Emission Region
The widely-accepted theory of the BELR describes its outer edge, where the O I and Ca II emission lines are likely to be formed, set by the dust sublimation (e.g., Laor & Draine, 1993; Netzer & Laor, 1993). If we accept this picture, the dust grains are possibly mixed in the line-emitting gas and suppress the Ca II emission through the substantial Ca depletion. Such a situation is in fact reported for the NELR by the absence or significant weakness of the observed [Ca II] 7291 line (Kingdon et al., 1995; Villar-Martín & Binette, 1997). Ferguson et al. (1997) presented the LOC model calculations of the narrow emission lines and argued that Ca is depleted relative to the solar value by factors of 3 – 160.
It is hard to see an evidence of the dust presence in the emission region from our results, since Figure 3 appears to show that our dust-free models successfully reproduce the observations. However, it is noteworthy that it is quite difficult to account for the observed data at O I ( 11287)/( 8446) 0.4 by the models with log = 12.0. The problem is that such small values of O I ( 11287)/( 8446) could only be reproduced with the higher densities than log = 12.0 so that O I 8446 emission is exclusively enhanced by the collisional excitation, while such a dense gas produces intense Ca II emission that is much stronger than observed. One can clearly see this trend in Figure 3 (left). If we assumed significant Ca depletion in the line-emitting gas, these difficulties are naturally resolved since it significantly suppresses the otherwise intense Ca II emissions. For example, the data point representing (log , log ) = (13.0, 2.5) in Figure 3 (left) could provide a plausible model for the observations at O I ( 11287)/( 8446) 0.4 if the Ca II emission is suppressed by a factor of a few times 10.333 The predicted EW for the model with (log , log ) = (13.0, 2.5) is EW (O I 8446) = 30 Å, which is consistent with the observations if rather large covering factors of 0.5 – 1.0 and/or oxygen overabundance relative to the solar value are assumed.
The dust grains present in the line-emitting gas might also give the natural explanation to the observed lack of some UV emission lines relative to their optical or near-IR counterparts. Ferland & Persson (1989) mentioned the possibility of the dust survival in the BELR gas in order to explain the extreme weakness of the observed Ca II 3934 and 3639 lines relative to the near-IR triplet. At least a part of the long-standing Fe II UV/opt problem, in which the observed ratios of Fe II UV flux to the optical flux fall far below the photoionization model predictions (see, e.g., Baldwin et al., 2004), could also be explained. However, it should be noted that the dust would affect the line formation processes in a very complicated manner, which should be precisely addressed when discussing the specific lines; for the O I and Ca II lines, one of the most apparent effects as well as the Ca depletion would be the destruction of Ly photons which otherwise excite O I atoms, thus the suppression of the O I emissions. The resultant line flux ratios could be much different from those derived from the simple speculations.
4 Summary
We have compiled the emission-line fluxes of O I 8446, O I 11287, and the near-IR Ca II triplet (8579) observed in 11 quasars. The quasars are distributed over wide ranges of redshift (0.06 1.08) and of luminosity (), thus providing a useful sample to track the line-emitting gas properties in various quasar environments. The measured line strengths and velocities, as functions of the quasar properties, were analyzed with photoionization model calculations. Our findings and conclusions are as follows:
1. There is no sign of a significant change in the flux ratios of the Ca II triplet and O I 8446 over the redshift and luminosity ranges studied here. It strongly indicates similar gas densities in the line-emission region from quasar to quasar.
2. The observed scatter of the O I 11287/8446 ratios appears to be related to the diversity of the ionization parameter, while the ratio is not clearly dependent on the redshift or luminosity. Combined with the similarity of the Ca II/O I 8446 ratios, it invokes the picture of the line-emitting gases in quasars that have similar densities and are located at regions exposed to various ionizing radiation fluxes.
3. The O I line widths are remarkably similar from quasar to quasar over more than 3 orders of magnitude in luminosity. It might imply a kinematically determined location of the line emission region and is in clear contrast to the case of H I lines, whose emission region is considered to be radiation-selected.
4. If we accept that the O I and Ca II emission lines are formed at the outer edge of the BELR and that the outer edge is set by the dust sublimation, the line-emitting gas is possibly mixed with the dust grains. In fact such a situation may better reproduce the observations than the dust-free case through the significant Ca depletion.
References
- Baldwin et al. (2004) Baldwin, J. A., Ferland, G. J., Korista, K. T., Hamann, F., & LaCluyzé, A. 2004, ApJ, 615, 610
- Baldwin et al. (1995) Baldwin, J. A., Ferland, G. J., Korista, K. T., & Verner, D. 1995, ApJ, 455, L119
- Bentz et al. (2006) Bentz, M. C., Peterson, B. M., Pogge, R. W., Vestergaard, M., & Onken, C. A. 2006, ApJ, 644, 133
- Dietrich et al. (2002) Dietrich, M., Appenzeller, I., Vestergaard, M., & Wagner, S. J. 2002a, ApJ, 564, 581
- Dietrich et al. (2003) Dietrich, M., Hamann, F., Appenzeller, I., & Vestergaard, M. 2003, ApJ, 596, 817
- Elston et al. (1994) Elston, R., Thompson, K. L., & Hill, G. J. 1994, Nature, 367, 250
- Evans & Koratkar (2004) Evans, I. N., & Koratkar, A. P. 2004, ApJS, 150, 73
- Ferguson et al. (1997) Ferguson, J. W.,Korista, K. T., Baldwin, J. A., & Ferland, G. J. 1997, ApJ, 487, 122
- Ferland et al. (1998) Ferland, G. J., Korista, K. T., Verner, D. A., Ferguson, J. W., Kingdon, J. B., & Verner, E., M. 1998, PASP, 110, 761
- Ferland & Persson (1989) Ferland, G. J., & Persson, S. E. 1989, ApJ, 347, 656
- Freudling et al. (2003) Freudling, W., Corbin, M. R., & Korista, K. T. 2003, ApJ, 587, L67
- Grandi (1980) Grandi, S. A. 1980, ApJ, 238, 10
- Hamann & Ferland (1993) Hamann, F., & Ferland, G. 1993, ApJ, 418, 11
- Iwamuro et al. (2004) Iwamuro, F., Kimura, M., Eto, S., Maihara, T., Motohara, K., Yoshii, Y., & Doi, M. 2004, ApJ, 614, 69
- Iwamuro et al. (2002) Iwamuro, F., Motohara, K., Maihara, T., Kimura, M., Yoshii, Y., & Doi, M. 2002, ApJ, 565, 63
- Kaspi et al. (2000) Kaspi, S., Smith, P. S., Netzer, H., Maoz, D., Jannuzi, B. T., & Giveon, U. 2000, ApJ, 533, 631
- Kawara et al. (1996) Kawara, K., Murayama, T., Taniguchi, Y., & Arimoto, N. 1996, ApJ, 470, L85
- Kingdon et al. (1995) Kingdon, J., Ferland, G. J., & Feibelman, W. A. 1995, ApJ, 439, 793
- Korista et al. (1997) Korista, K., Baldwin, J., Ferland, G., & Verner, D. 1997, ApJS, 108, 401 (K97)
- Laor & Draine (1993) Laor, A., & Draine, B. T. 1993, ApJ, 402, 441
- Maiolino et al. (2003) Maiolino, R., Juarez, Y., Mujica, R., Nagar, N. M., & Oliva, E. 2003, ApJ, 596, L155
- Matsuoka et al. (2007) Matsuoka, Y., Oyabu, S., Tsuzuki, Y., & Kawara, K. 2007, ApJ, 663, 781 (Paper I)
- Matsuoka et al. (2005) Matsuoka, Y., Oyabu, S., Tsuzuki, Y., Kawara, K., & Yoshii, Y. 2005, PASJ, 57, 563
- Matteucci & Recchi (2001) Matteucci, F., & Recchi, S. 2001, ApJ, 558, 351
- Netzer & Laor (1993) Netzer, H., & Laor, A. 1993, ApJ, 404, L51
- Persson (1988) Persson, S. E. 1988, ApJ, 330, 751
- Peterson et al. (2002) Peterson, B. M., et al. 2002, ApJ, 581, 197
- Riess et al. (2004) Riess, A. G., et al. 2004, ApJ, 607, 665
- Riffel et al. (2006) Riffel, R., Rodríguez-Ardila, A., & Pastoriza, M. G. 2006, A&A, 457, 61
- Rodríguez-Ardila et al. (2002a) Rodríguez-Ardila, A., Viegas, S. M., Pastoriza, M. G., & Prato, L. 2002a, ApJ, 565, 140
- Rodríguez-Ardila et al. (2002b) Rodríguez-Ardila, A., Viegas, S. M., Pastoriza, M. G., Prato, L., & Donzelli, C. J. 2002b, ApJ, 572, 94
- Rudy et al. (1989) Rudy, R. J., Rossano, G. S., & Puetter, R. C. 1989, ApJ, 342, 235
- Schmidt & Green (1983) Schmidt, M., & Green, R. F. 1983, ApJ, 269, 352
- Tsuzuki et al. (2006) Tsuzuki, Y., Kawara, K., Yoshii, Y., Oyabu, S., Tanabé, T., & Matsuoka, Y. 2006, ApJ, 650, 57 (T06)
- Verner et al. (2003) Verner, E., Bruhweiler, F., Verner, D., Johansson, S., & Gull, T. 2003, ApJ, 592, L59
- Véron-Cetty & Véron (2006) Véron-Cetty, M.-P., & Véron, P. 2006, A&A, 455, 773
- Villar-Martín & Binette (1997) Villar-Martín, M., & Binette, L. 1997, A&A, 317, 350
- Yoshii et al. (1998) Yoshii, Y., Tsujimoto, T., & Kawara, K. 1998, ApJ, 507, L113
- Yoshii et al. (1996) Yoshii, Y., Tsujimoto, T., & Nomoto, K. 1996, ApJ, 462, 266
| Quasar | Redshift | aaThe -band absolute magnitude taken from Véron-Cetty & Véron (2006). | ReferencebbReferences — (1) Riffel et al. (2006); (2) Matsuoka et al. (2005); (3) Paper I |
|---|---|---|---|
| QSO B0850440 | 0.514 | 25.2 | 3 |
| PG 1116215 | 0.176 | 25.3 | 2 |
| PG 1126041 | 0.060 | 22.8 | 1 |
| QSO J11391350 | 0.560 | 26.3 | 3 |
| PG 1148549 | 0.978 | 28.0 | 3 |
| 3C 273 | 0.158 | 26.9 | 3 |
| PG 1415451 | 0.114 | 22.1 | 1 |
| PG 1448273 | 0.065 | 23.0 | 1 |
| PG 1519226 | 0.137 | 22.9 | 1 |
| PG 1612261 | 0.131 | 22.6 | 1 |
| PG 1718481 | 1.084 | 29.8 | 3 |
| Quasar | (Ca II)/(O I 8446) | O I (11287)/(8446) | EW (O I 8446) [Å] |
|---|---|---|---|
| QSO B0850440 | 1.63 0.53 | 0.62 0.15 | 24.9 5.9 |
| PG 1116215 | 1.22 0.43 | 0.67 0.20 | 19.8 5.2 |
| PG 1126041 | 1.12 0.06 | 0.52 0.04 | 38.2 1.4 |
| QSO J11391350 | 0.49 0.16 | 0.24 0.05 | 16.0 2.9 |
| PG 1148549 | 1.18 0.05 | 0.33 0.02 | 26.0 0.9 |
| 3C 273 | 1.46 0.21 | 0.33 0.04 | 17.2 1.9 |
| PG 1415451 | 0.87 0.12 | 0.35 0.05 | 23.3 2.2 |
| PG 1448273 | 0.34 0.12 | 0.54 0.08 | 22.1 2.5 |
| PG 1519226 | 0.97 0.07 | 0.41 0.03 | 31.9 1.6 |
| PG 1612261 | 0.47 0.07 | 0.44 0.05 | 35.5 2.3 |
| PG 1718481 | 1.11 0.22 | 0.47 0.12 | 7.6 0.8 |