Chandra Observations of Type Ia Supernovae: Upper Limits to the X-ray Flux of SN 2002bo, SN 2002ic, SN 2005gj, and SN 2005ke
Abstract
We set sensitive upper limits to the X-ray emission of four Type Ia supernovae (SNe Ia) using the Chandra X-ray Observatory. SN 2002bo, a normal, although reddened, nearby SN Ia, was observed 9.3 days after explosion. For an absorbed, high temperature bremsstrahlung model the flux limits are ergs cm-2 s-1 (0.5–2 keV band) and ergs cm-2 s-1 (2–10 keV band). Using conservative model assumptions and a 10 km s-1 wind speed, we derive a mass loss rate of yr-1, which is comparable to limits set by the non-detection of H lines from other SNe Ia. Two other objects, SN 2002ic and SN 2005gj, observed 260 and 80 days after explosion, respectively, are the only SNe Ia showing evidence for circumstellar interaction. The SN 2002ic X-ray flux upper limits are 4 times below predictions of the interaction model currently favored to explain the bright optical emission. To resolve this discrepancy we invoke the mixing of cool dense ejecta fragments into the forward shock region, which produces increased X-ray absorption. A modest amount of mixing allows us to accommodate the Chandra upper limit. SN 2005gj is less well studied at this time. Assuming the same circumstellar environment as for SN 2002i, the X-ray flux upper limits for SN 2005gj are 4 times below the predictions, suggesting that mixing of cool ejecta into the forward shock has also occurred here. Our reanalysis of Swift and Chandra data on SN 2005ke does not confirm a previously reported X-ray detection. The host galaxies NGC 3190 (SN 2002bo) and NGC 1371 (SN 2005ke) each harbor a low luminosity ( ergs s-1) active nucleus in addition to wide-spread diffuse soft X-ray emission.
Subject headings:
galaxies: individual (NGC 3190, NGC 1371) — supernovae: general — supernovae: individual (SN 2002bo, SN 2002ic, SN 2005gj, SN 2005ke)1. Introduction
Type Ia supernovae (SN Ia) are an important subclass of supernova (SN) that are thought to arise from explosions of white dwarfs in binary systems, although the exact nature of their progenitor systems is largely a mystery. This ignorance is not due to a lack of effort since SN Ia are the subject of intense scrutiny, not least of all because of their importance as cosmological probes. SN Ia have been used to measure the Hubble constant (Hamuy et al., 1995; Riess et al., 1996) and have even given strong evidence for a non-zero cosmological constant (Riess et al., 1998; Perlmutter et al., 1999). Our failure to identify SN Ia progenitors highlights a major gap in our understanding of stellar evolution in binary systems, and presents a stumbling-block to understanding the chemical evolution of galaxies, since Ia’s are known to be efficient producers of iron. In addition, until SN Ia progenitor systems are clearly identified, it will remain difficult to convincingly eliminate evolutionary sources of systematic error in the observed trend of SN brightness with redshift.
The current model framework for Type Ia SNe involves carbon deflagration/detonation in a white dwarf driven close to the Chandrasekhar limit by accretion. The most likely type of progenitor system (Branch et al., 1995) is a C-O white dwarf accreting H/He-rich gas from a companion, either from its wind or through Roche lobe overflow. Double degenerate scenarios with coalescing pairs of C-O white dwarfs are also possible, while sub-Chandrasekhar-mass white dwarfs are less likely (Branch et al., 1995). In the non-coalescing scenarios, there will be circumstellar gas whose composition and geometry depend on the nature of the progenitor system. If the circumstellar medium (CSM) emits radiation, or absorbs radiation from the SN, this can be used to distinguish between types of progenitor systems.
Thermal X-ray emission is expected to arise from the hot gas in the interaction region between the rapidly moving supernova ejecta and the wind from presupernova mass loss. Detecting this X-ray emission offers a direct and potentially quite sensitive probe of the amount of CSM. Because of its high sensitivity, broad bandwidth, unprecedented imaging capability, and ability to respond rapidly to a target of opportunity (ToO) request, the Chandra X-ray Observatory is the premier instrument to search for faint X-ray emission from transient point sources.
In the following we present the analysis and interpretation of Chandra observations of four recent SNe Ia. Two are fairly normal SNe Ia, while the others are peculiar cases showing strong H emission from circumstellar interaction. The following section describes the observed targets, §3 presents the observations and techniques, §4 uses the upper limits on X-ray flux to constrain the nature of the CSM, and the final section concludes. In an Appendix we describe the X-ray properties of the host galaxies for the two nearby systems, NGC 3190 and NGC 1371.
2. Description of Targets
Our first targeted SN, SN 2002bo, was discovered on 2002 March 9 (Cacella et al., 2002) and was spectroscopically confirmed as a Type Ia SN shortly thereafter (Kawakita et al., 2002; Benetti et al., 2002; Matheson et al., 2002). The SN appeared approximately 18′′ southeast of the nucleus of NGC 3190 in the middle of an apparent dust lane. Early optical spectra of the SN indicated that it was quite young (10–14 days before maximum) and possibly reddened. Based on the SN’s proximity to Earth and very early discovery, we triggered a pre-approved Chandra ToO observation on March 12. The nominally 20 ks long observation was carried out two days later (the midpoint of the observation was at JD 2452347.9). We now know that the time of maximum light (in the B band) occurred on 2002 March 23.0 UT or, equivalently JD 2452356.5, (Benetti et al., 2004; Krisciunas et al., 2004) and that the inferred explosion epoch was JD 2452338.6 0.5. Our Chandra ToO observation was therefore made only 9.3 days after explosion. We adopt a value of 22 Mpc for the distance to NGC 3190 (for more details, see Benetti et al., 2004; Krisciunas et al., 2004). SN 2002bo showed significant reddening (Benetti et al., 2004), most likely due to its host galaxy. We converted this to an equivalent X-ray absorbing column value of using Cox et al. (2000, p. 527) in order to model the SN’s X-ray flux.
The second SN Ia we observed with Chandra, SN 2002ic, is the first SN Ia in which a circumstellar interaction was detected (however, see Benetti et al., 2006, for an alternate view). Discovered on 2002 November 13 (Wood-Vasey et al., 2002), it was spectroscopically identified on 2002 December 7 as a type Ia SN at a redshift of 0.0666 (Hamuy et al., 2002). In 2003 June Hamuy et al. (2003a) reported the detection of broad (FWHM 1800 km s-1) H emission from the supernova, revealing a SN/CSM interaction in SN 2002ic involving a dense CSM with as much as several solar masses of material (Hamuy et al., 2003b). Evidence has been presented for a clumpy, aspherical structure for the CSM (Wang et al., 2004; Deng et al., 2004; Chugai & Chevalier, 2007) as well as for gaps or troughs in the radial profile (Wood-Vasey et al., 2004; Chugai & Yungelson, 2004). The unprecedented strength of the CSM interaction in SN 2002ic combined with the persistence of the H emission (which lasted for many months), led us to request a 20-ks observation with Chandra under the Director’s discretionary time program. The request was approved and our observation was carried out on JD 2452863.5 (the observation began on 2003 August 11). Wood-Vasey et al. (2004) estimate a date for maximum light in the B-band of JD 2452606. Assuming a typical time between explosion and maximum light of 18 days (Riess et al., 1999) we estimate an explosion date of JD 2452588. The Chandra observation was made 275 days after explosion or approximately 260 days in the SN frame.
Another peculiar SN Ia (SN 2005gj), showing a circumstellar interaction, was discovered on 2005 September 26 by the SDSS-II collaboration (Barentine et al., 2005; Frieman, 2005). Originally classified as a probable type-IIn supernova because of the presence of resolved Hydrogen line emission, further spectroscopy demonstrated a remarkable similarity with SN 2002ic, resulting in a reclassification of the event as a SN Ia but with clear signs of a circumstellar interaction (Prieto et al., 2005). The SN lies in an anonymous galaxy at a redshift of 0.062 (Barentine et al., 2005). No X-ray emission was detected in a brief observation on 2005 November 24 using the X-ray telescope onboard the Swift satellite (Immler et al., 2005). A 50-ks long Chandra observation was carried out under the Director’s discretionary time (DDT) program on JD 2453716.5 (the observation began on 2005 December 11). Aldering et al. (2006) recently presented an analysis of the optical light curves and spectra in which they conservatively estimate that SN 2005gj exploded sometime in the interval September 18.6–24.6. More recently, Prieto et al. (2007) estimate the time of explosion to be September , based simply on whether or not they detected the SN, which, conservatively, can only provide an upper limit to the time of explosion. Since a difference of a few days is not significant for our purposes, we take the midpoint value of the Aldering et al. (2006) study (JD 2453635.1) as our estimate for the explosion date. This is some 77 days (in the SN frame) before the Chandra observation.
The final SN Ia we report on here is SN 2005ke, which was discovered on 2005 November 13 (Puckett et al., 2005) and confirmed as a Type Ia SN a few days later (Patat et al., 2005). These later authors estimated the spectral age by comparison to SN 1999by to be a few days before maximum light, which suggests an approximate explosion date of Nov 2 (JD 2453676.50). Although the host galaxy, NGC 1371, is relatively nearby (we use a distance of 17 Mpc; Tully, 1988) the SN was underluminous and not discovered particularly early so it was not initially observed by Chandra. However, Swift devoted considerable observing time to the SN (250 ks) over the course of the 2005/2006 winter and reported a tentative X-ray detection at about the 3 significance level with a flux of ergs cm-2 s-2 (0.3–2 keV band) (Immler et al., 2006). The reported midpoint of the Swift observation is some 42 days after explosion. Subsequently a Chandra DDT observation was approved and carried out on JD 2453786.1 (beginning on 2006 February 19) about 110 days after explosion. No radio emission has been detected (Soderberg, 2006).
Table 1 summaries some key observational information about the several SNe discussed in this paper.
| SN 2002bo | SN 2002ic | SN 2005gj | SN 2005ke | |
|---|---|---|---|---|
| R.A. (J2000) | 10:18:06.5 | 01:30:02.6 | 03:01:12.0 | 03:35:04.4 |
| Decl. (J2000) | 21:49:41 | 21:53:07 | 00:33:13.9 | 24:56:38.8 |
| Explosion date (JD) | 2452338.6 | 2452588.0 | 2453635.1 | 2453676.5 |
| Chandra Obs. date (JD) | 2452347.9 | 2452863.5 | 2453716.5 | 2453786.1 |
| Chandra exposure (ks) | 19.6 | 17.3 | 49.4 | 14.8 |
| (atoms cm-2) | ||||
| D (Mpc) / | 22 | 0.0666 | 0.062 | 17 |
3. Observations and Techniques
Each target was observed near the nominal telescope aimpoint on the back-side illuminated chip (S3) of the Chandra Advanced CCD Imaging Spectrometer (hereafter ACIS-S). Although the background rate is higher here than on the front-side illuminated chips of the imaging array, the greatly enhanced low energy response of chip S3 was the main deciding factor in favor of using it. Observations were carried out in timed exposure mode with events recorded in FAINT (SN 2002bo: Observation Identifier [ObsID] 2760; SN 2005ke: ObsID 7277) or VFAINT (SN 2002ic: ObsID 4449; SN 2005gj: ObsID 7241) data mode. The same basic data reduction processes were applied to each observation, using standard Chandra software and calibration (CIAO version 3.2.2, CALDB 3.1.0). This included applying the latest gain map, identifying and removing hot pixel and afterglow events, using VFAINT mode information (when available) to remove some non-X-ray (i.e., charged particle) background events, and filtering on grade (retaining the usual values 02346) and status. Light curves of the entire S3 chip were made to identify times of high background. The SN 2002bo, SN 2005gj, and SN 2005ke data were mostly free of flares, while the SN 2002ic data showed a modest amount of background flaring. Excluding time intervals more than 3 from the mean resulted in final useful exposure times of 19620 s (SN 2002bo), 17280 s (SN 2002ic), 49410 s (SN 2005gj), and 14810 s (SN 2005ke). The astrometry of each pointing was checked as well. We found no unambiguous matches between X-ray and optical point sources in the field of SN 2002bo, so it was not possible to obtain an independent check of the absolute astrometry of the X-ray data. In lieu of this the on-line “Aspect Calculator” tool was run, yielding an aspect offset of 0.5′′ which was applied to the data. For SN 2002ic, it was possible to match four X-ray sources with optical counterparts in the USNO-A2.0 catalog from which an aspect offset of 0.6′′ was determined for the Chandra data. There were nine optical counterparts to X-ray sources in the SN 2005gj field which resulted in an aspect correction of 1.0′′ to the Chandra data. One X-ray source showed a clear optical counterpart for the SN 2005ke observation. The positional offset was less than 0.1′′ so no adjustment was applied to the Chandra astrometry.
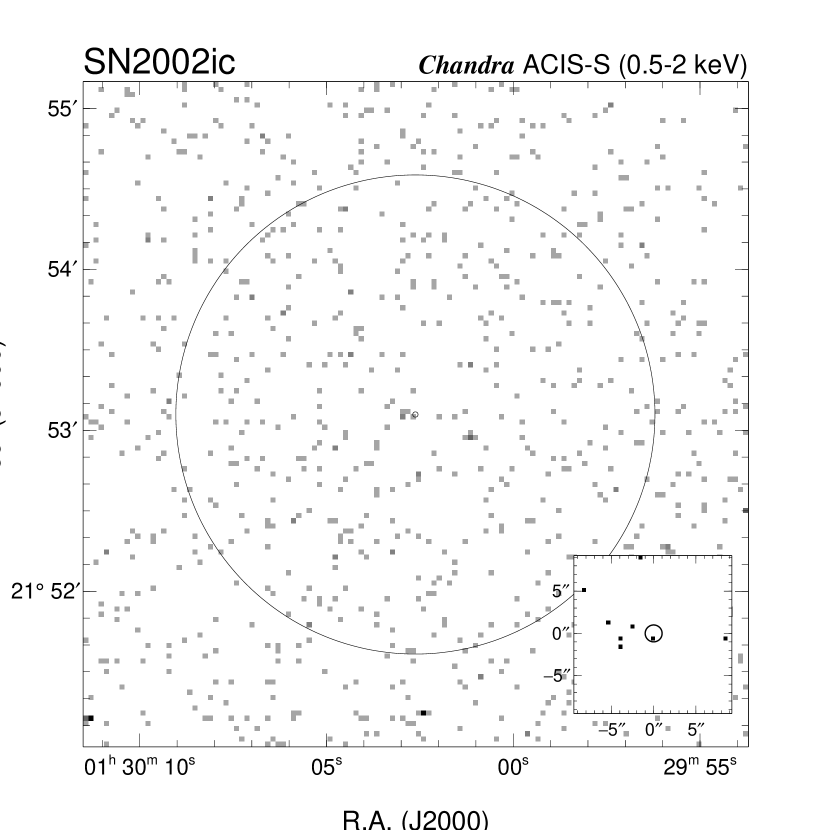
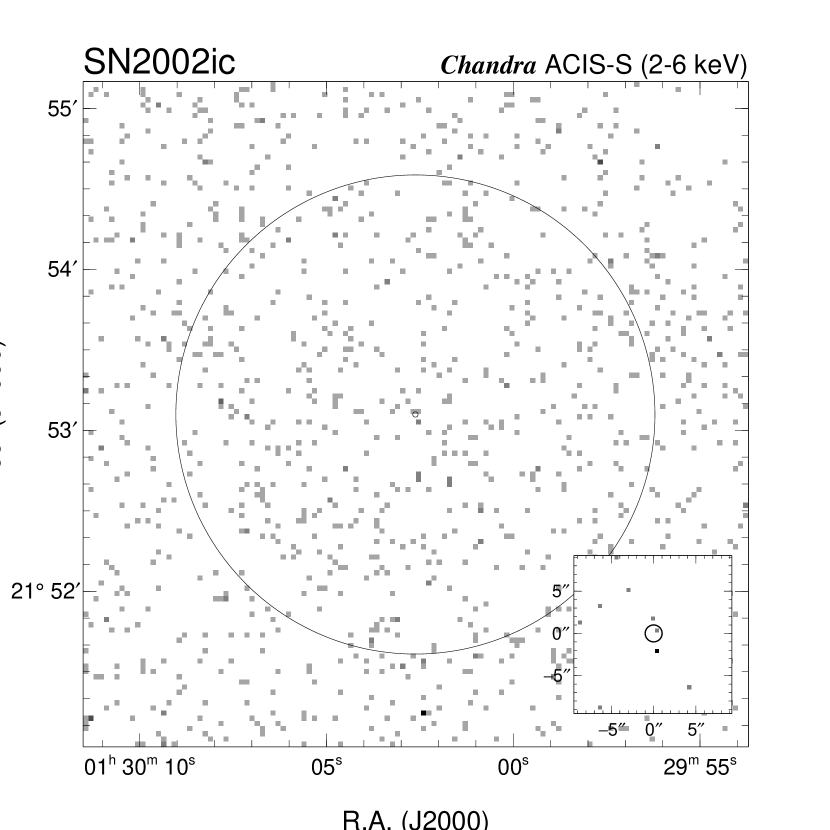
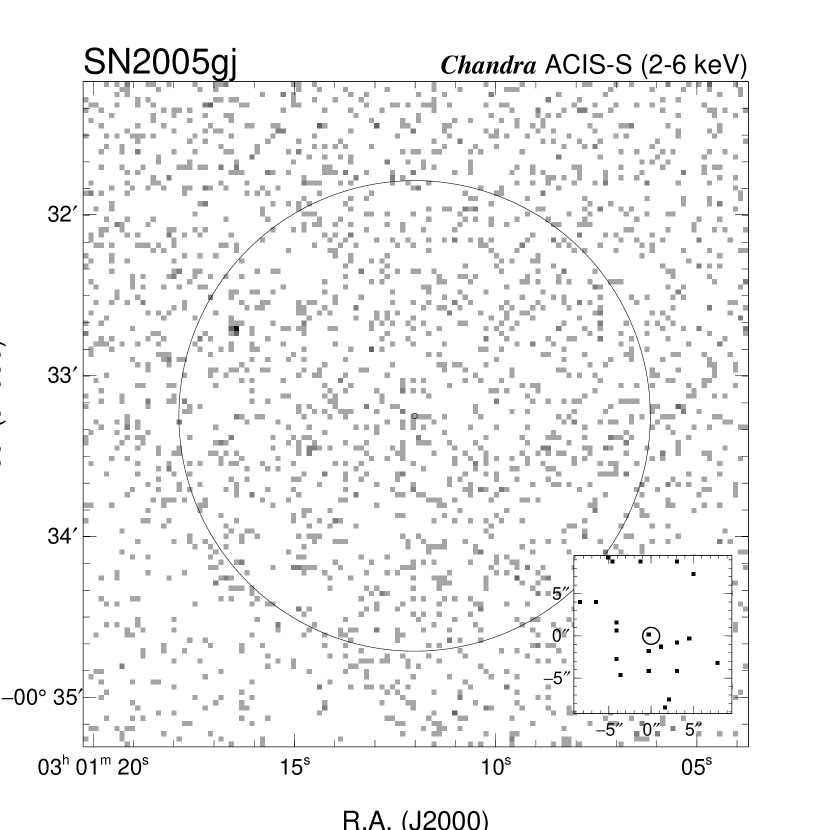
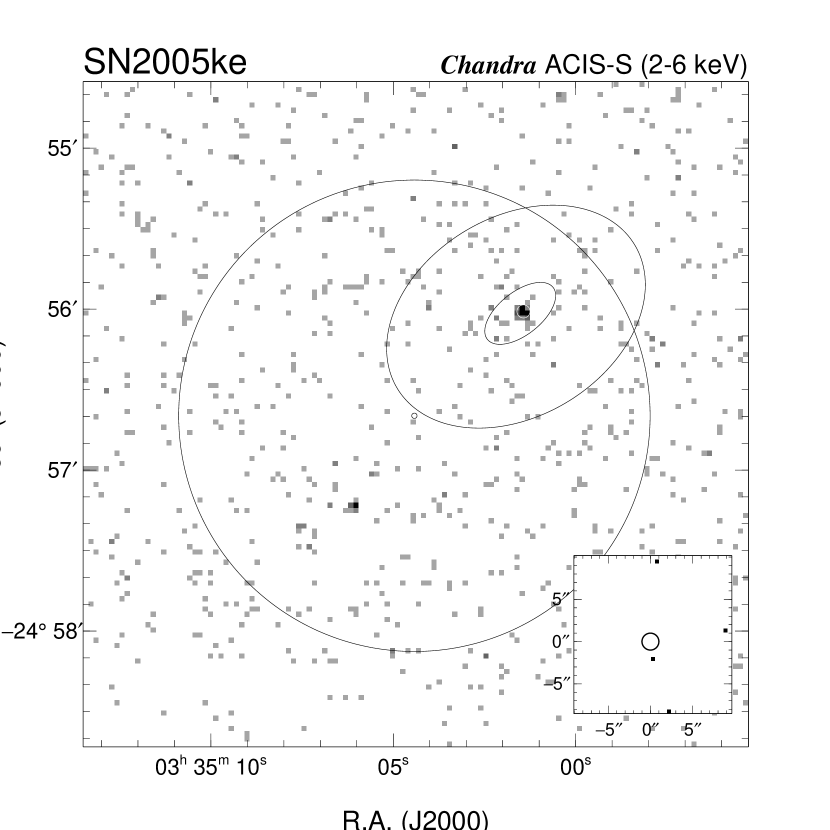
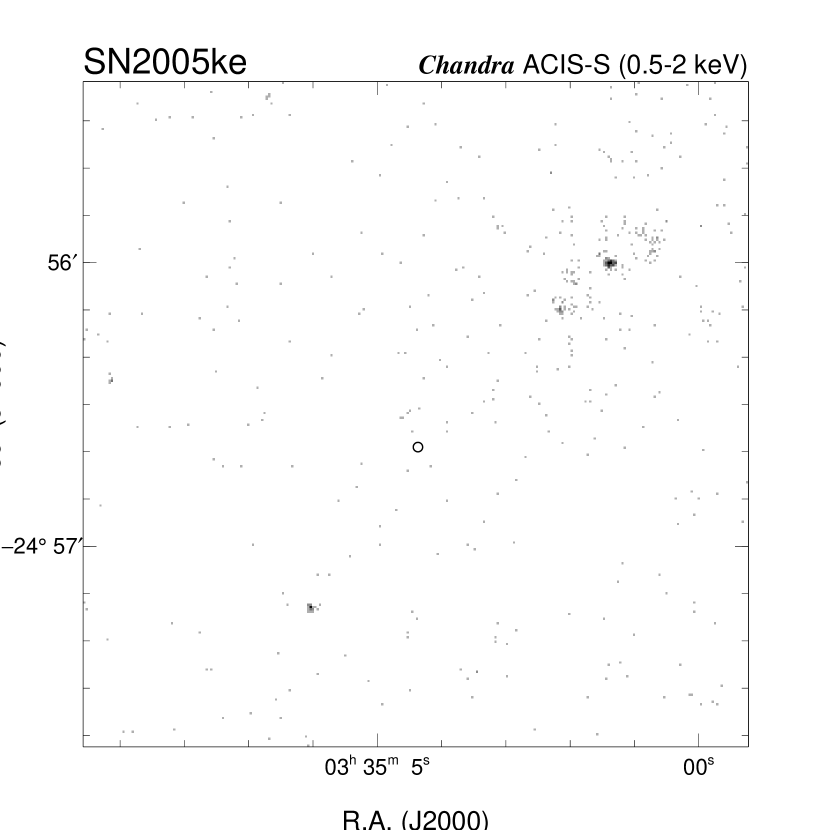
Grayscale images of the Chandra data are presented in Figures 1–4 in two spectral bands: 0.5–2 keV (left) and 2-6 keV (right). The small insert in the lower right corner of each panel shows the raw Chandra data in the immediate vicinity of each SN. There are no detected X-ray photons in a 1′′ (radius) circle centered on the positions of either SN 2002bo or SN 2005ke. Only two photons (with energies of approximate 1.1 keV and 3.6 keV) were detected at the position of SN 2002ic. Two photons (with energies of 4.0 keV and 7.7 keV) were also detected at the position of SN 2002gj These are clearly not significant detections and so in the following we demonstrate how we obtained upper limits to the X-ray flux of each SN. Since the range of allowed spectral models is large, we developed a technique that allows us to determine upper limits for just about any spectral form imaginable.
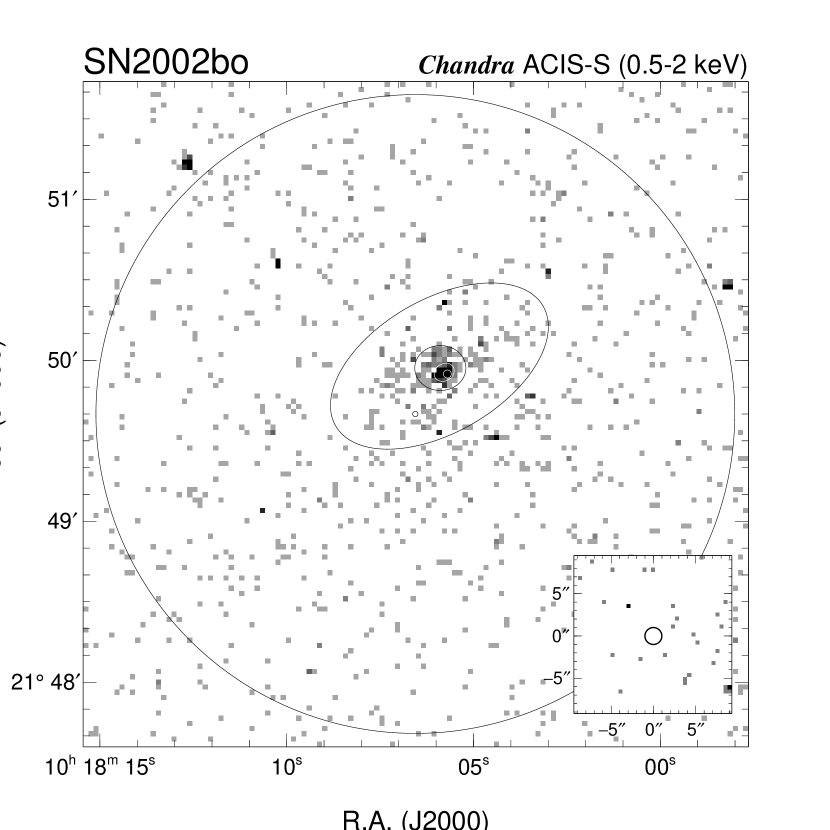
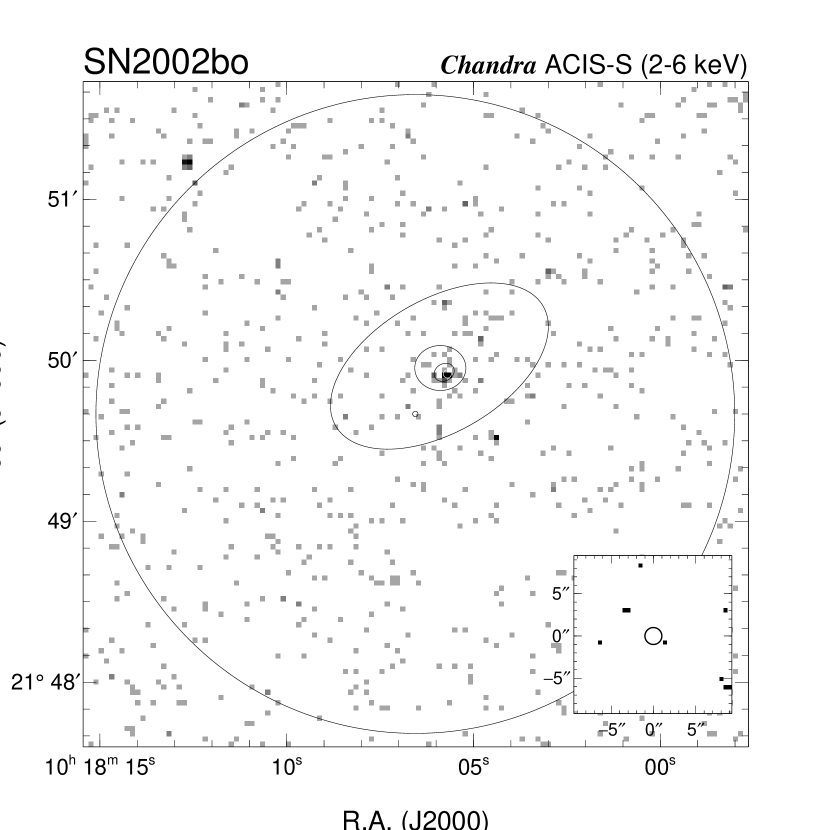
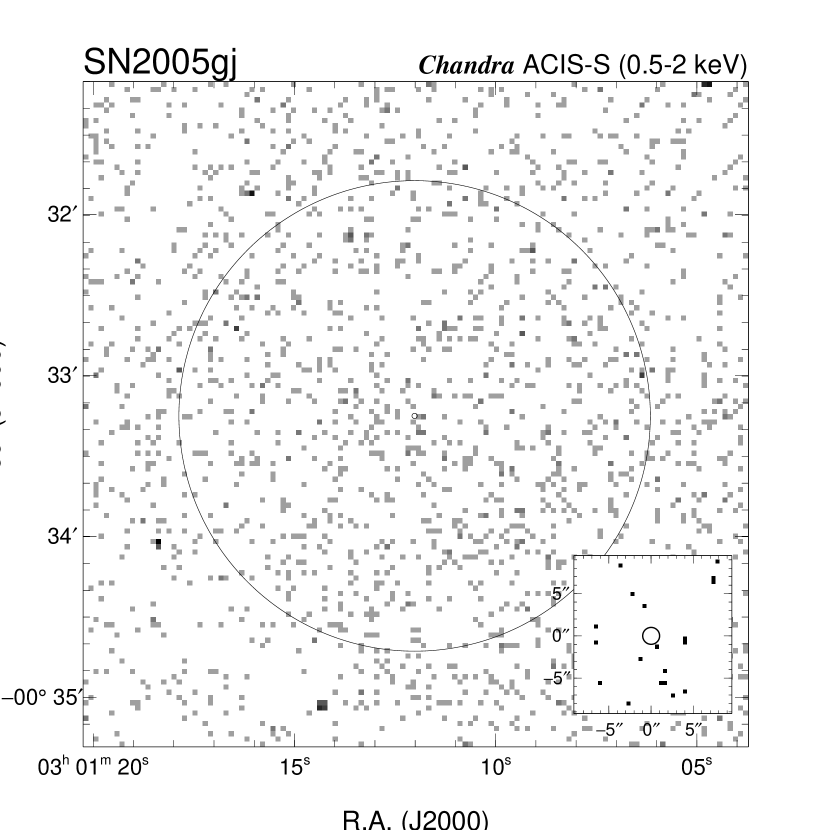
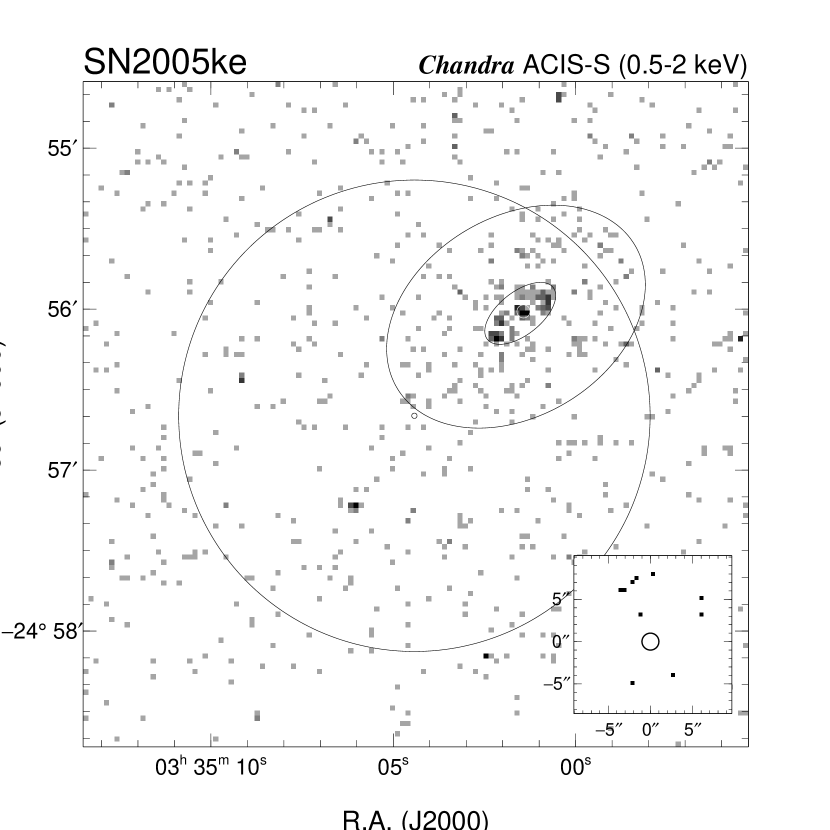
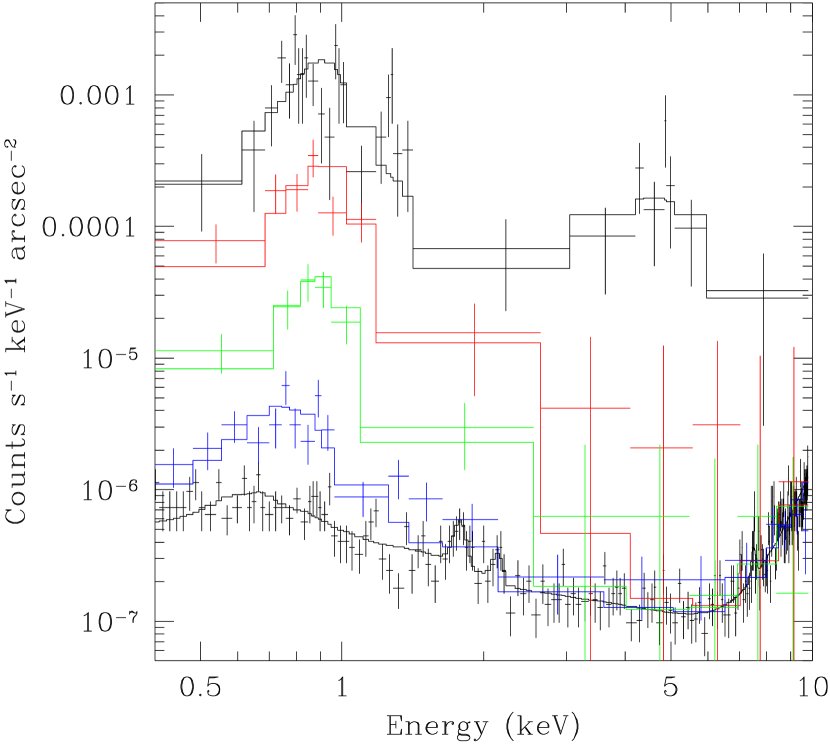
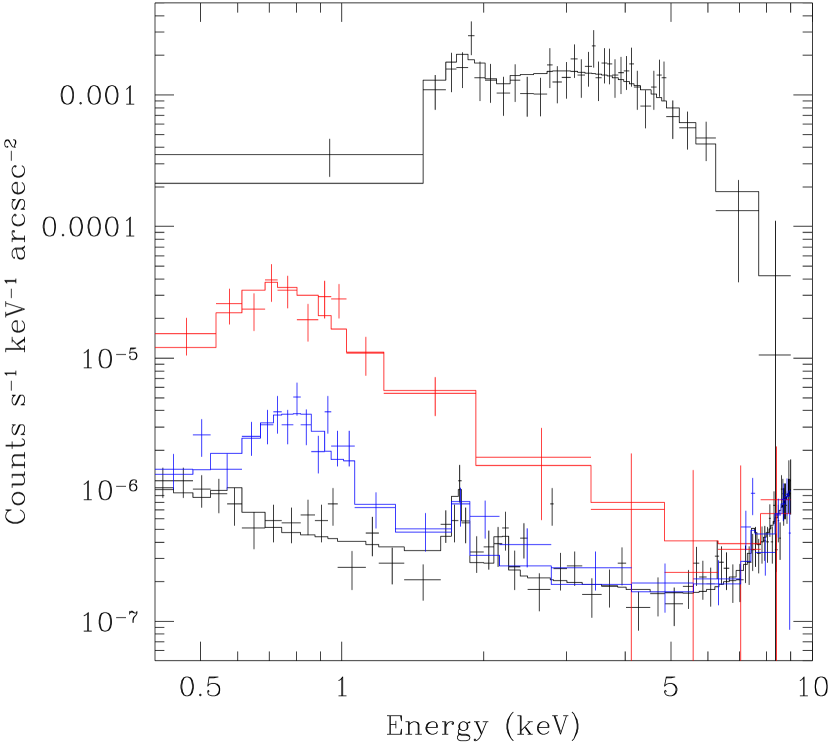
One essential key to our method is to obtain an accurate spectral model for the background. To this end we extracted spectra from the large circular regions shown on Figures 1–4, excluding all serendipitous point sources and for each of SN 2002bo and SN 2002ke, an elliptical region centered on the host galaxy that encompasses all the galaxy’s apparent X-ray emission. The detector spectral response function (calculated using mkacisrmf) as well as the overall effective area function were determined at a large number of detector positions within the extraction region and then weighted by the spatial distribution of detected events to produce final weighted response functions. The black data points near the bottom of Figures 5 and 6 show the background spectra used for SN 2002bo and SN 2005ke (the other cases are similar to these two). Note that the spectra were rebinned to a signal-to-noise ratio of 3 for display only; spectral fits were carried out on the original unbinned spectral data. The curve through these points indicates our best fit model, which consists of two power law components to describe the non-X-ray (i.e., particle) background, three narrow lines to account for instrumental fluorescence lines from Si and Au, and two astrophysical models: a low temperature thermal model for the local Galactic emission and a hard power law for the unresolved cosmic X-ray background. These later models included interstellar absorption using the Galactic values (Dickey & Lockman, 1990): (SN 2002bo), (SN 2002ic), (SN 2005gj), and (SN 2005ke). One of the non-X-ray background power law models is required to model the spectrum below 5 keV; the other one fits the sharp upturn in emission beyond 7 keV. Overall the non-X-ray background dominates the spectrum above about 2 keV. The fits were carried out using a maximum likelihood figure-of-merit function for Poisson-distributed data (the so-called “c-stat” option in xspec). The background models for all four targets are similar as are the quality of the fits, which are acceptable from a statistical point-of-view (determined by examining the values on grouped data).
Detector spectral response and effective area functions were calculated as above for the SN regions. We assume that the background intensity is uniform on arcminute spatial scales near the detector aimpoint and that its spectral form does not vary with position either. Thus we can scale the background models to the SN regions using the ratio of detector pixels in the source and background spectral extraction regions. When this is done, we find that the background model predicts the detection of 0.19 events (SN 2002bo), 0.20 events (SN 2002ic), 0.50 events (SN 2005gj), and 0.14 events (SN 2005ke) over the entire Chandra band. The number of events actually detected in the observations of SN 2002bo and SN 2005ke (0 for each) is consistent with their respective background rates. The Poisson probability to detect 2 (or more) X-ray photons when 0.2 are expected, as is the case for SN 2002ic, is only 1.7%. The Poisson probability to detect 2 (or more) X-ray photons purely from background in the case of SN 2005gj is 9%.
We determine flux upper limits for a specific assumed astrophysical spectral model (including the measured redshifts for SN 2002ic and SN 2005gj), by adding it to the background model and then increasing its normalization until the c-stat value increases by , which is the 3 confidence level criterion. Results for two X-ray flux bands are shown in Tables 2 to 5 and plots of the variation of the c-stat value vs. the total 0.5–10 keV band X-ray flux are shown in Fig. 7. All quoted fluxes have been corrected to remove Galactic absorption for SN 2002ic, SN 2005gj, and SN 2005ke, and the absorption from the host galaxy for SN 2002bo. The first set of four models in these tables (dashed curves in the figure) assume thermal plasma emission with no intrinsic absorption, normal solar composition and temperatures from 2 to 20 keV. The second set of four models (solid curves in the figure) assume a hot ( keV) bremsstrahlung model with varying amounts of intrinsic absorption: from to . Uncertainty in the level of the background has a very small effect on the flux upper limits. For example, assuming a 20% variation in the level of the model background for SN 2002ic introduces a 3% change in the derived flux limit for the hard spectral model.
| Intrinsic | Flux | Flux | |
|---|---|---|---|
| (keV) | (atoms cm-2) | (0.5–2 keV) | (2–10 keV) |
| 2 | |||
| 5 | |||
| 10 | |||
| 20 | |||
| 80 | |||
| 80 | |||
| 80 | |||
| 80 |
| Intrinsic | Flux | Flux | |
|---|---|---|---|
| (keV) | (atoms cm-2) | (0.5–2 keV) | (2–10 keV) |
| 2 | |||
| 5 | |||
| 10 | |||
| 20 | |||
| 80 | |||
| 80 | |||
| 80 | |||
| 80 | |||
| Chugai Model – Day 260 | |||
| Intrinsic | Flux | Flux | |
|---|---|---|---|
| (keV) | (atoms cm-2) | (0.5–2 keV) | (2–10 keV) |
| 2 | |||
| 5 | |||
| 10 | |||
| 20 | |||
| 80 | |||
| 80 | |||
| 80 | |||
| 80 |
| Intrinsic | Flux | Flux | |
|---|---|---|---|
| (keV) | (atoms cm-2) | (0.5–2 keV) | (2–10 keV) |
| 2 | |||
| 5 | |||
| 10 | |||
| 20 | |||
| 80 | |||
| 80 | |||
| 80 | |||
| 80 |
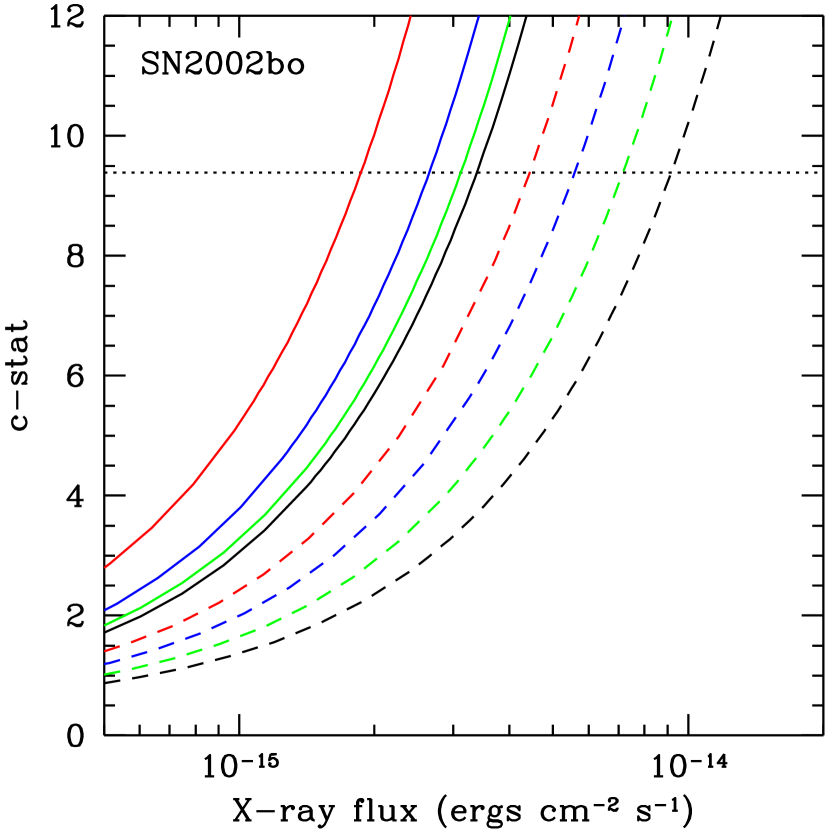
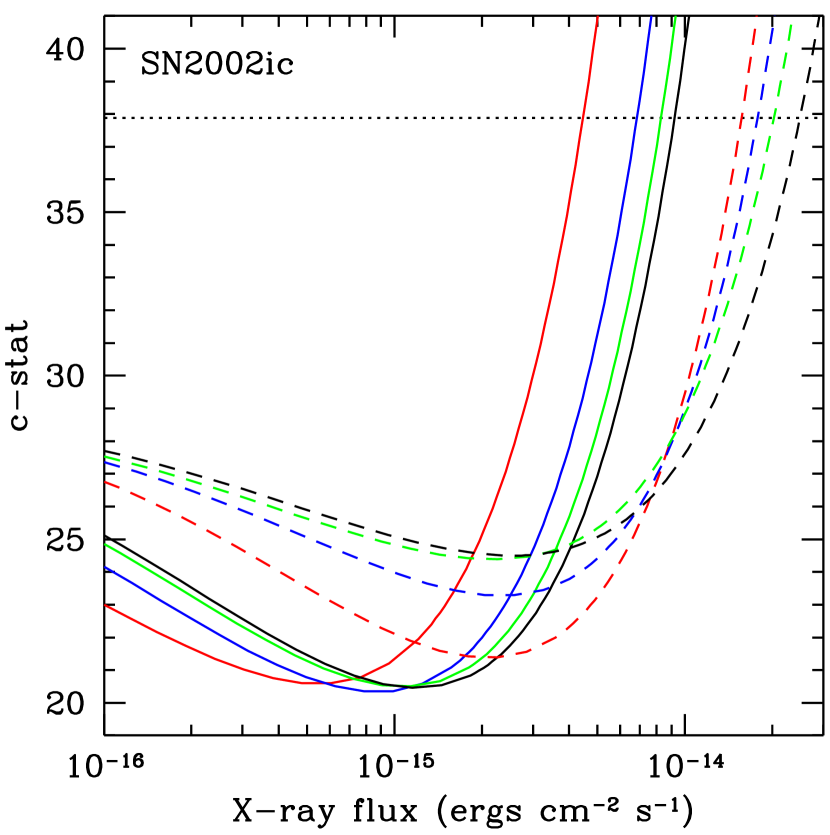
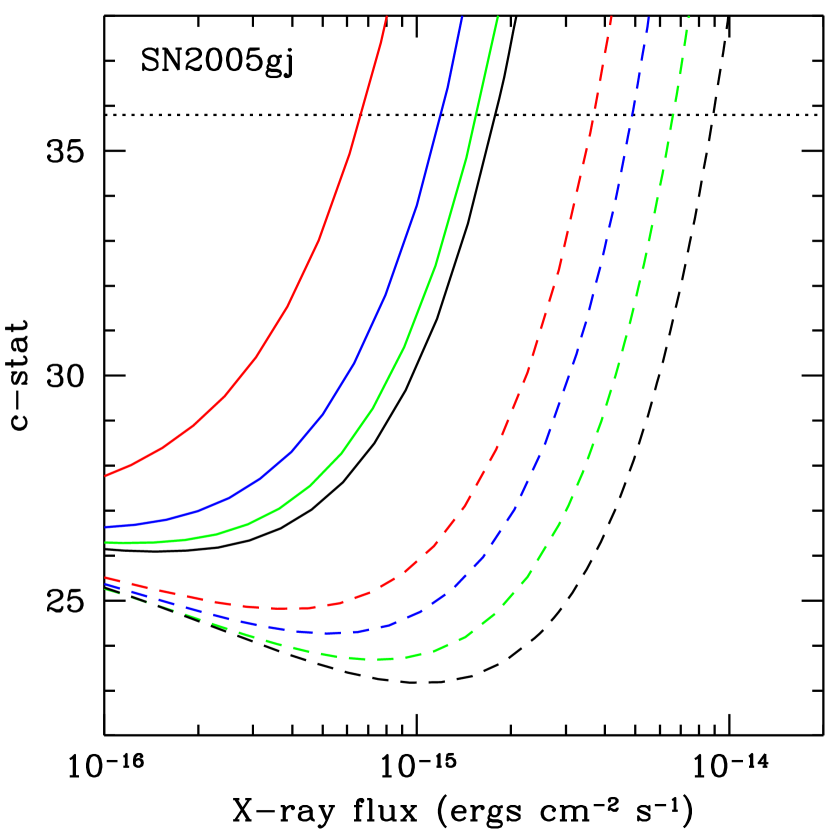
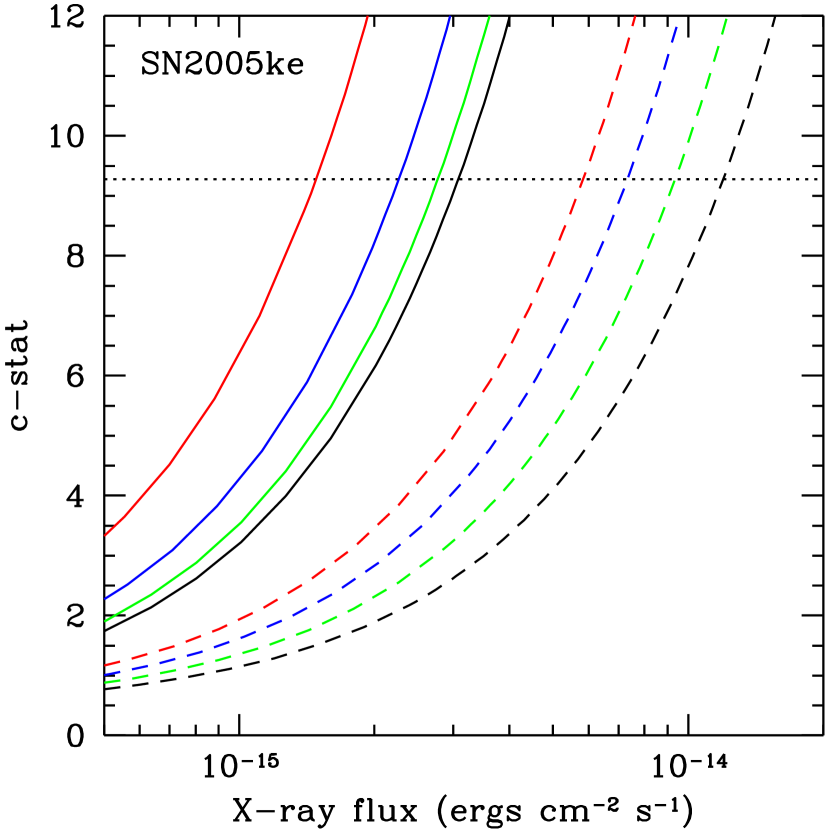
Fig. 8 graphically illustrates how the upper limits depend on the assumed spectral shape. Each curve here corresponds to the upper limit for that spectrum allowed by the Chandra data. Clearly more hard band emission is allowed if the soft band is depressed, and vice versa.
Some comments on Fig. 7 are warranted. The top left panel (SN 2002bo) shows a steady rise in the c-stat value as the flux (or normalization) of the assumed spectral model is increased. The top right panel (SN 2002ic) shows a slightly different behavior: the c-stat value initially decreases as the flux of the model increases until it reaches a minimum after which it begins to grow rapidly. What is happening is that the added spectral model is accounting for the 2 detected photons in the SN 2002ic spectrum. The reduction in the c-stat value is which is significant at between 2 and 3 . The curves for SN 2005gj resemble those for SN 2002ic for essentially the same reason, while the curves for SN 2005ke (for which no photons were detected) resemble SN 2002bo.
Finally we compare our X-ray flux limits for SN 2005gj with those quoted by Prieto et al. (2007): ergs cm-2 s-1 (at 68% confidence level) and ergs cm-2 s-1 (at 95.5% confidence level) for the 0.5–8 keV band. The spectral form they assumed (an unabsorbed power law with photon index ) is roughly comparable to our thermal plasma model with keV. We utilize Fig. 7 to convert to the 68% (c-stat ) and 95.5% (c-stat ) confidence levels and obtain comparable flux limits (0.5–10 keV band) of ergs cm-2 s-1 and ergs cm-2 s-1, respectively.
3.1. Re-evaluation of tentative Swift X-ray detection of SN 2005ke
The importance of the tentative detection of SN 2005ke by the Swift X-ray Telescope (XRT) instrument cannot be overstated, yet the original report (Immler et al., 2006) provided only a brief summary of the data reduction and analysis. We undertook an independent analysis of these data in order to address some issues that we considered to be incompletely resolved in the published study.
We downloaded the archival Swift XRT data on SN 2005ke observed during the winter of 2005/2006 from the HEASARC. There were 43 separate observations from 14 November 2005 until 5 March 2006 encompassing ObsIDs from 0030341001 to 0030341008 and from 0030342001 to 0030342036. Recently (March 2007) Swift reobserved SN 2005ke (ObsIDs 0035898002 to 0035898004) and we examined these data as well. The report on this recent observation can be summarized succinctly: no photons were detected within 14′′ of the SN position. In our analysis of the rest of the data we began with the standard cleaned events files utilizing only data in photon counting mode and all good grades (0-12).
The position of the nuclear X-ray source was located in each of the separate observations and then images in a broad band (0.5-6 keV, pi bins 50:600) were generated using this location for the image center. The four shortest observations (exposures 100 s) gave no detected photons from the nucleus and were excluded from further consideration. The total dead-time corrected exposure in the merged image was 251.0 ks.
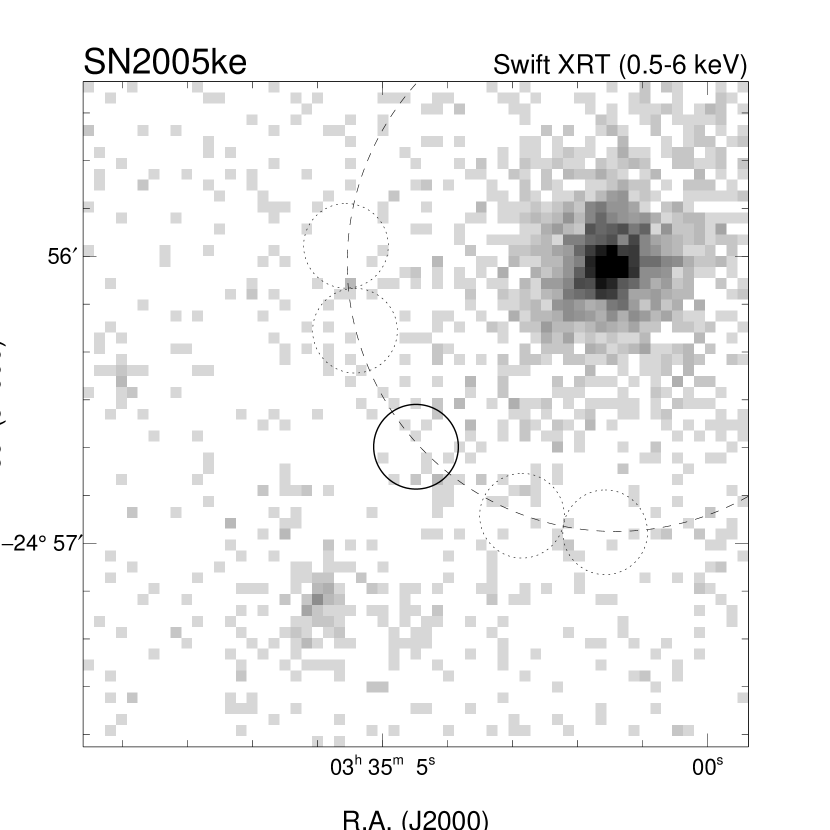
We registered the Swift data to the Chandra data using the observed positions of 11 fairly bright X-ray sources that contained at least 30 counts in the merged Swift image. A simple linear 4′′ shift in position was sufficient to bring the Swift and Chandra positions into agreement with a scatter in the relative after-shift positions of 1′′. The accuracy of the Chandra positional astrometry was verified, as mentioned above, using the cataloged position of an optical star detected in the X-rays. Figure 9 shows the Swift (left panel) and Chandra (middle panel) broad band images highlighting the region covering the supernova position and the nucleus of NGC 1371.
The broadband Swift and Chandra count rates were determined for the aforementioned 11 sources in addition to 9 other fainter ones. These are essentially all the compact X-ray sources within 5′ of the Chandra optical axis. For Swift the rates were extracted from within 9′′ radius circular regions and then multiplied by two to account for the point-spread function (PSF) of the telescope (the half-power diameter at 1.5 keV is 18′′). The Chandra point source extraction regions were large enough to capture 90% of the source flux. Figure 10 plots the Swift vs. Chandra count rates. The rates are well correlated and within the errors most of the sources (14/20) are consistent with the best-fit average ratio of rates (Swift to Chandra) of 0.19 (shown as the long dashed line in the figure). This is close to the ratio of effective areas at 1.5 keV for the two observatories (135 cm2 / 600 cm2 0.225), which is shown as the short dashed line in the figure. The six sources that deviate from the average ratio of rates do so by generally no more than about a factor of two and are likely just time variable sources.

Having demonstrated the astrometric and photometric accuracy of the Swift data, we are now in the position to determine the X-ray count rate and detection significance of SN 2005ke. First we note that the count rate of s-1 quoted by Immler et al. (2006) would lead us to expect something like 25 detected photons, after background subtraction, within our fiducial 9′′ radius circular region. In fact, we detect only 15 total events, which includes both source and background emission. We estimate the background using the 4 regions denoted with dotted circles in Fig. 9, which are at least 18′′ from the SN position, are all equidistant (1′) from the center of the nuclear emission (as indicated by the large dashed circle) and have the same radius as the source region. This yields an estimate of background events for the SN 2005ke source region. Our background subtracted count rate (including the multiplicative PSF-correction factor of 2) becomes s-1. Even if we vary the source extraction region (by doubling it, for example), the number of source counts never exceeds the background by more than 2 . This is not a significant detection, so we determine a count rate upper limit of s-1 (at 3 sigma confidence) from the Swift data. This corresponds roughly to a Chandra count rate of s-1 (using a ratio of rates of 0.2), which is several factors higher than the Chandra count rate upper limit we derived for SN 2002bo.
4. Limits on the Ambient CSM
We use the model of Chugai et al. (2004, hereafter CCL) to determine constraints on the density of the ambient medium surrounding SN 2002bo, SN 2002ic, and SN 2005gj from our X-ray flux upper limits. We do not consider SN 2005ke, since the time of X-ray observation (40 days after explosion) and the limit on X-ray luminosity are both less constraining of the SN models than is the case for SN 2002bo. Here we provide a brief summary of the calculations; the reader is referred to CCL for more details.
The model considers interaction of the SN ejecta with spherically symmetric, smooth circumstellar gas and treats the dynamics in a thin shell approximation. The evolution is followed by solving the equations of motion numerically assuming an exponential density profile for the SN envelope and a power law CSM density profile (which in the case of SN 2002ic includes different indices for different radial ranges). Specifically, the density of SN Ia ejecta is described by the law , where and are defined by the mass and kinetic energy . We adopt a typical ejecta mass , and kinetic energy ergs (the model PDD3 of Höflich & Khokhlov, 1996). The outermost unburnt layers of the ejecta ( km s-1) are represented as pure oxygen. Interior to this the ejecta are Si- and Fe-rich, while the CS wind is assumed to be hydrogen-rich. The numerical model provides the time evolution of the shock radii, velocities, and temperatures.
The internal structures of the forward and reverse shocks are not determined in the model, so the X-ray luminosity at age is calculated from the instantaneous kinetic luminosity of the shock, (Chevalier & Fransson, 1994; Chugai, 1992). The radiation efficiency factor is given by , where is the cooling time of the post-shock gas. Electron and ion temperatures are fully equilibrated for SN 2002ic and SN 2005gj due to Coulomb collisions (however, see below for SN 2002bo) and the shape of the emission is given simply by a thermal bremsstrahlung spectrum at the appropriate temperature; no line emission is included. This is a conservative approximation, since including line emission would boost the modeled X-ray emission and thereby decrease our limit on the ambient gas density.
The reverse shock is essentially radiative in all cases we consider here, so the shocked metal-rich SN ejecta create a cool dense shell (CDS) at the contact discontinuity, which causes severe absorption of X-ray emission from the reverse shock. The absorption coefficient for the metal-rich ejecta is given by cm2 gm-1. X-rays are also absorbed by the CSM, although this material is assumed to be hydrogen-rich for which is some 50 times smaller. That portion of the total X-ray luminosity absorbed by SN unshocked ejecta, CDS, and unshocked circumstellar (CS) gas is presumed to be fully re-emitted in the optical band.
One of the most important quantities influencing the X-ray luminosity of the SN/CSM interaction is the density of the wind. Typically this has been expressed in terms of a constant wind speed, , and mass loss rate, , as . The quantity that we constrain with the Chandra observations is the wind density parameter . When quoting mass loss rates we will give values in terms of .
4.1. SN 2002bo
It is doubtful that the shocked electrons and ions in the forward shock reach temperature equilibration in the low density CS wind around SN 2002bo. In general the average post-shock electron temperature, , will be in the range , where and is the mean molecular weight. We calculate intermediate values of the electron temperature using the relation , where and , the Coulomb equilibration time, is evaluated conservatively assuming . This expression is the average for an adiabatic plane shock in a homogeneous medium at age for a constant post-shock equilibration timescale. Because we use the maximal value of , the value of recovered in this way will be underestimated, and accordingly, our wind density constraints will be somewhat overestimated.
We ran a set of models with wind density parameter values in the range g cm-1 to g cm-1 without assuming complete temperature equilibration for a SN age of 9.3 d and distance of 22 Mpc (Krisciunas et al., 2004). Each trial spectrum was input to the spectral fitting program and compared to the Chandra data in exactly the same manner as described above (§ 3). A value of g cm-1 was found to be the maximum value allowed by the Chandra data at the 99% confidence level. Fig. 11 plots this model along with a rejected case with higher wind density parameter and, for reference, we plot the broadband flux upper limits for the absorbed bremsstrahlung model with atoms cm-2.

At about 10 keV the model flux is dominated by the reverse shock emission, while the forward shock with its cooler electrons produces the weaker peak at about 1 keV. The low electron temperature of the forward shock is the result of inefficient equilibration in the low density wind. The electron and ion temperatures in the reverse shock, on the contrary, are close to equilibrated. Moreover, the reverse shock is radiative during the initial period up to 28 days for wind parameters in the range being considered. The cool dense shell of the reverse shock is responsible for the strong absorption of X-rays from the reverse shock.
Given that the amount of collisionless electron heating at the forward shock is highly uncertain we also ran a set of models for the equipartition case, . Here the maximal wind density parameter is g cm-1 (Fig. 11). Remarkably, in the latter case the peak at 1 keV is dominated by Comptonization of the SN radiation by the hot electrons of the forward shock. The Comptonized spectral component is described by a power law with dependence on and taken according to Pozdnyakov, Sobol, & Sunyaev (1976).
For reference in Table 6 we present numerical values for the parameters corresponding to the interaction models for SN 2002bo on day 9.3 that are plotted in Fig. 11. The top two models correspond to the non-equilibrated shocks (), while the other two models correspond to the equilibrated ones (). The columns list: a model designation, the wind density parameter (), thin shell radius (), velocity of the reverse () and forward () shocks, electron temperature of the reverse () and forward () shocks, hydrogen column density of the CS gas () for assuming H abundance . The last column gives the mass of the cool dense shell formed by the shocked SN ejecta. This metal-rich matter strongly suppresses X-rays from the reverse shock and partially absorbs X-rays from the rear side of the forward shock.
| Model | ||||||||
|---|---|---|---|---|---|---|---|---|
| ( g cm-1) | ( cm) | ( cm s-1) | ( cm s-1) | (keV) | (keV) | ( cm-2) | () | |
| neq12 | 12 | 2.22 | 2.68 | 24.9 | 18.3 | 1.93 | 18 | 5.6 |
| neq30 | 30 | 2.02 | 2.72 | 22.4 | 22.6 | 4.76 | 50 | 11 |
| eq0.6 | 0.6 | 2.81 | 2.18 | 32.7 | 16.5 | 1290 | 0.71 | 0.33 |
| eq1.5 | 1.5 | 2.64 | 2.41 | 30.4 | 20.1 | 1110 | 1.9 | 0.92 |
We also applied Lundqvist’s models for the X-ray emission emerging from the presumed wind surrounding a SN Ia (Lundqvist et al. 2007, in preparation). Note that there are some differences in assumptions and details in this model compared to those just presented. However our intent here is not to resolve these differences, but rather to present an independent estimate of the expected X-ray flux from the interaction between SN Ia ejecta and CSM at early times. Lundqvist’s models use a similarity solution (Chevalier, 1982a) for the evolution with power law indices of in the ejecta and in the wind. The velocities of the forward and reverse shock at 9.3 days after explosion are km s-1 and km s-1, respectively. The full ejecta density and temperature structure from the similarity solution is used for calculating the X-ray emission, assuming that the composition of the outer ejecta is equal parts of carbon and oxygen. We verified that the density in the reverse shocked ejecta is sufficient to assure that the electron and ion temperatures are equilibrated there. In these models a radiative cold dense shell does not form and so it is emission from the reverse shock that dominates (and in fact these calculations do not include forward shock emission). Only thermal emission is included; although inverse Compton scattering could be an important contribution (see, e.g., Fig. 7 in Fransson et al., 1996, for the case of SN1993J), we ignore it here (which is again a conservative assumption as regards the limit on CSM density). Intrinsic absorption comes about only from the overlying CSM. Models were generated and compared to the Chandra spectrum as above. The wind density limit we obtain is comparable to those above: g cm-1.
4.2. SN 2002ic
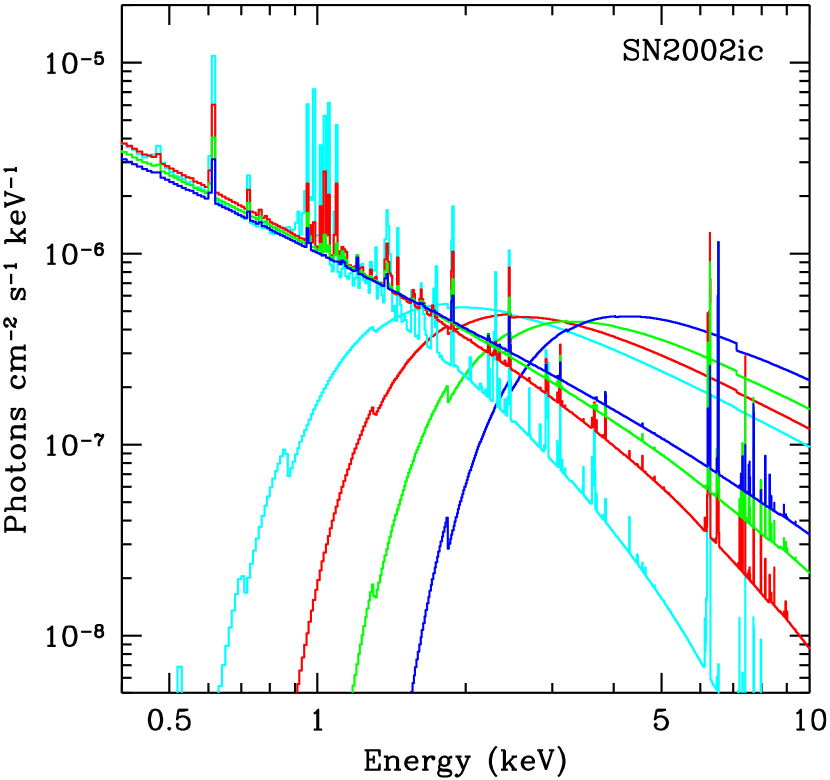
SN 2002ic has been studied extensively. We take the position here that the intense late-time ( d) optical luminosity of SN 2002ic is powered by the interaction of SN Ia ejecta with a dense circumstellar environment (Hamuy et al., 2003b; Wang et al., 2004; Chugai et al., 2004; Nomoto et al., 2005). The CCL interaction model that accounts for the optical luminosity and spectrum requires a dense stellar-wind-type density profile suggesting a high mass-loss rate () from the progenitor system (Chugai & Yungelson, 2004). This model predicts an X-ray flux of order photon cm-2 s-1 kev-1 in the 3–10 keV energy band for ages in the range d. The predicted X-ray flux on day 260 along with contributions of the reverse and forward shocks for the standard parameter set (CCL) is plotted in Fig. 12 for a distance 285 Mpc along with an estimate of the Chandra flux upper limit (using the most absorbed bremsstrahlung model with atoms cm-2). We dub this model ‘unmixed’ for reasons that will become clear below. The modeled X-ray flux is clearly dominated by the emission of the forward shock; emission from the reverse shock is absorbed by the cool dense shell formed in the radiative ejecta. We compared this spectrum to the Chandra data and found that the X-ray flux exceeds the observational upper limit by a factor of . The disagreement is significant and indicates that the model is incorrectly predicting the X-ray emission from the forward shock.

The model ignores possible deviation from spherical symmetry suggested by polarization data (Wang et al., 2004). Generally, if the CS gas is concentrated in a dense thin equatorial disk (thickness radius), it is conceivable that the bulk of the kinetic energy of the interaction could be dissipated deep inside the SN envelope. As a result, the ratio of the emergent X-ray flux to the optical flux could be small because of strong absorption in the dense disk. However this is unlikely to be the case. Indeed, large deviations from global spherical symmetry for the interaction are ruled out by the similarity of line widths and profiles for all known SN Ia with strong CS interaction, i.e., 2002ic, 1999E, 1997cy (CCL). Furthermore a modest level of asymmetry should not significantly affect the ratio of the emergent-to-absorbed X-ray luminosity compared to the spherical case.
More serious consequences for the X-ray luminosity might result from the omission of the internal structure of the forward shock in the thin shell approximation. To estimate the error introduced by this approximation we computed a hydrodynamical model for the standard parameter set as before (CCL) using a one-dimension hydrodynamical Lagrangian code with artifical viscosity (e.g., Gull, 1973). On day 260 the radius of the contact discontinuity of the hydrodynamical model coincides with the radius of the thin shell model to an accuracy of 1%. The forward shock structure of the hydrodynamical model was used to calculate the X-ray emission from the shocked gas assuming instant equilibration of ion and electron temperatures. The X-ray luminosity of the forward and reverse shocks is lower by factors of 1.5 and 1.3, respectively, compared to the thin shell model, while the temperature of the forward shock is greater (80 keV compared to 50 keV in the thin shell model). The lower X-ray luminosity of both shocks in the hydro model results in an optical luminosity lower by a factor of 1.3. To recover the optical bolometric luminosity the CS density in the hydro model needs to be slightly larger. We found that a 20% increase in the CS density is sufficient to recover the required optical luminosity. The new total mass of the CS envelope is 1.9 within a cm radius compared to 1.6 found in the thin shell approximation (CCL). The increase of the CS density by 20% slightly increases the X-absorption thus reducing the peak of the X-ray flux by less than 20%. We thus conclude that differences between the hydrodynamical and thin shell models are rather minor and cannot account for the significant disparity between the Chandra upper limit and the predicted X-ray flux.
Two missing factors that could potentially resolve the issue are the Rayleigh-Taylor (RT) instability of the CDS and clumping of the CS gas. The RT instability of the shocked decelerated ejecta is a generic attribute of the SN/CS interaction (Chevalier, 1982b), while the clumpiness of the CS matter around SN 2002ic has been invoked already to account for the H line profile (CCL). The RT instability leads to fragmentation and mixing of CDS fragments with the hot gas of the forward shock (Chevalier & Blondin, 1995; Blondin & Ellison, 2001). Clumpiness of the CS matter favors more efficient mixing of the CDS fragments within the forward shock principally through two mechanisms. First, the CS clouds penetrate deep inside the intercloud shock before they get shocked, fragmented and mixed (Klein, McKee, & Colella, 1994; Blondin, 2001). As a result the bulk of the kinetic energy related to CS clouds dissipates closer to the contact discontinuity. Second, the CS clouds engulfed by the intercloud shock generate vortex turbulence that favors more efficient penetration of the RT spikes in the forward shock (Jun at al., 1996). We thus propose a scenario for SN 2002ic in which the forward shock is no longer a regular layer of hot gas but instead is a macroscopic mixture of hot gas and cool metal-rich fragments of the CDS. The major outcome of this modification should be an additional component of absorption of the X-ray emission from the forward shock by the intermixed fragments of metal-rich CDS.
To illustrate this effect we will calculate the absorption of X-rays from the forward and reverse shocks assuming the same thin shell model as in CCL, but with the following corrections. The CDS is assumed to be fragmented and homogeneously mixed in the forward shock layer. Remarkably, the analysis of the optical spectrum of SN 2002ic suggests that the CDS is indeed fragmented and well mixed. The ratio of the cumulative area of clumps to the area of the spherical shell, which is a measure of mixing, was estimated to be on day 234 (CCL). The occultation optical depth of the fragmented CDS, i.e., the average number of fragments on the line of sight in the shell for randomly oriented plane fragments is then . Small values of the occultation optical depth, , would mimic the possible presence of “holes” in the mixing zone due to strong angular variation in the column density (Chevalier & Blondin, 1995). Another relevant value is the average optical depth for X-rays , which is determined by the average column density of CDS material and the X-ray absorption coefficient, for which we take the metal-rich case as given above. The effective optical depth of the ensemble of fragments is then . In the limit the effect of mixing for a homogeneous thin spherical layer with unabsorbed luminosity is to reduce the emergent X-ray luminosity to a value of . Indeed, only half of the photons emitted in a layer with thickness equal to the mean free path () can escape. The other factor of one-half comes from averaging over the angle between the photon direction and surface normal.
The mixing we invoke may, however, be incomplete, which can be mimicked by adopting a lower occultation optical depth of the homogeneous layer, . We also take into account additional absorption by the fragmented shocked CS clouds with normal composition, assuming that 50% of the swept-up CS gas resides in the cool shocked cloud material with . This component, presumably responsible for the H emission, produces negligible X-ray absorption.
The computed total flux of escaping X-rays is presented in the lower panel of Fig. 12 for , 2, 5 and 10, which vary from low to high degrees of mixing of CDS fragments into the forward shock region. The plot shows a pronounced effect on the X-ray absorption (see Fig. 12) by the macroscopically mixed CDS material. The case corresponds to the maximal flux tolerated by the Chandra upper limit. This study indicates that mixing of the shocked SN ejecta with the hot gas of the forward shock can resolve the X-ray flux disparity between the original model that explains the optical spectrum (CCL) and the new Chandra observations of SN 2002ic.
4.3. SN 2005gj
According to its early spectrum and photometry, SN 2005gj is remarkably similar to SN 2002ic and very likely is a member of this new class of bright Ia SNe embedded in dense CS envelope. This position has been strengthened by the recent light curve and spectral study of Aldering et al. (2006). Their V- and I-band light curves for SN 2005gj match the shape of the early time evolutionary models of Chugai & Yungelson (2004) for SN 2002ic, although the models need to be scaled upward in brightness by 0.5 mag or so. The CSM interaction in SN 2005gj is evidentally stronger than in SN 2002ic. In the absence of a detailed hydrodynamical model for SN 2005gj, we utilize the same model and parameter values as for SN 2002ic. First we computed the X-ray flux at the Chandra observation epoch ( d) neglecting the effects of ejecta mixed into the forward shock. The resulting spectrum is presented in the upper panel of Fig. 13 for a distance to SN 2005gj of 266 Mpc together with an estimate of the Chandra broad band flux upper limits (using the most highly absorbed bremsstrahlung spectrum with atoms cm-2). The model spectrum overpredicts the X-ray flux by a factor of 4. Although little is currently published about the environment of SN 2005gj, the Aldering et al. (2006) study suggests that the density of the ambient medium is, if anything, higher than that around SN 2002ic, which exacerbates the discrepancy with the Chandra flux limit. Therefore we next considered the mixing of CDS fragments into the forward shock region in the case of SN 2005gj. The required occultation optical depth to not exceed the Chandra limit is (Fig. 13). Consequently, if the CS environment around SN 2005gj is as dense as that around SN 2002ic, mixing of the fragmented CDS must be already significant at this early epoch.

5. Discussion and Conclusion
With our Chandra observation of SN 2002bo we have set the most sensitive X-ray flux upper limits at an earlier epoch than for any previous SN Ia. The previous best case was that of SN 1992A for which a ROSAT upper limit of ergs cm-2 s-1 was set on the 0.5-2 keV band X-ray flux 35 days after explosion (Schlegel & Petre, 1993). Our Chandra limit in the same energy band is an order of magnitude lower and was set only 9 days after explosion. We also set a sensitive upper limit in the important 2–10 keV band.
Converting our flux upper limits to constraints on the density of the CSM in the system depends on uncertain assumptions about the thermodynamic state of the hot plasma in the expanding ejecta and shocked wind. As we have shown in this paper there is roughly an order of magnitude difference in the inferred wind density under the assumption of fully equilibrated electron and ion temperatures vs. the case with non-equilibrated temperatures. The latter case yields the more conservative (i.e., higher) constraint: a wind density parameter g cm-1. In terms of a slow wind with velocity of km s-1 this corresponds to a upper limit on the mass-loss rate of yr-1. The much higher sensitivity of the Chandra data notwithstanding, this value is larger by a factor of 10 or so than the mass loss upper limit derived from ROSAT data by Schlegel & Petre (1993) for SN 1992A. This discrepancy is due to the simplicity of the model used by Schlegel & Petre (1993) to evaluate their upper limit: they do not include absorption by residual wind material above the forward shock, assume electron-ion temperature equilibration, compare to model luminosities without applying a bolometric correction, and calculate the SN age from the time of maximum rather than from the time of explosion. In other comparisons our Chandra upper limit is comparable to those found previously from limits on the H flux for the normal type Ia supernovae SN 1994D (Cumming et al., 1996) and SN 2001el (Mattila et al., 2005). In general limits on of yr-1 are not stringent enough to rule out the class of symbiotic-type binaries as SN Ia progenitors at least not for these particular cases.
The value of these results lies in our ability to calculate, using well understood physics, the expected X-ray emission from hot gas. Viewed in this light, we briefly discuss limits on the CSM obtained from radio nondetections of a number of nearby SNe Ia (Panagia et al., 2006). The radio results rely on semi-empirical parameterized functional forms for the time- and frequency-dependence of synchrotron emission and free-free absorption, whose relevant parameters are assumed to have values given by radio results for SNe Ib/c. Likewise the essential parameter, i.e., the one linking the wind density parameter to the radio luminosity of the SN, cannot be calculated from theory with any accuracy, and an empirical calibration, again drawn from measurements of SNe Ib/c, must be used. Although the sensitive radio flux limits clearly argue for low density environments around SN Ia, the extremely low numerical limits on the mass-loss rates claimed by Panagia et al. (2006) cannot yet be considered definitive.
The other normal SN Ia we study here is SN 2002ke. We re-examine the claim by Immler et al. (2006) of a tentative X-ray detection by Swift and find that we cannot substantiate it. We pay particular attention to the astrometric and photometric calibration of the Swift X-ray data by comparing to a Chandra observation done several months later. We find no evidence for a significant X-ray detection of SN 2005ke by either Swift or Chandra, to a flux limit that is several factors higher than what we obtained for SN 2002bo. Since this limit is at a much later epoch, when the intensity of the CSM/ejecta interaction should be much reduced, we did not attempt to determine numerical limits to the wind density parameter for this SN.
We have also presented Chandra upper limits for the two examples of SNe Ia with clear evidence for circumstellar interaction: SN 2002ic and SN 2005gj. The upper limit on the X-ray luminosity of SN 2002ic in the keV band unexpectedly reveals a serious drawback to the interaction model proposed previously (CCL): the predicted X-ray flux turns out to be larger by at least a factor of four. We identified the major missing element of the model responsible for the controversy: macroscopic mixing of cool metal-rich ejecta fragments into the hot gas of the forward shock, which results in strong absorption of the X-rays emitted by the forward shock. Interestingly, the absorption of X-rays by mixed shocked ejecta should have the effect of decreasing the required CS density in the model to explain the late time optical luminosity. This effect together with the higher radiation efficiency of the interaction with a clumpy CS matter should result in a slightly higher expansion velocity of the shocked SN ejecta in the interaction model. These outcomes appear to be preferred by the optical spectra of SN 2002ic (see CCL).
SN 2005gj appears to belong to the SN 2002ic-like family of SN Ia with dense CS envelopes (Aldering et al., 2006; Prieto et al., 2007). The Chandra upper limit from this object at about day 80 is a factor of four larger than the flux predicted by the interaction model of SN 2002ic recomputed for the corresponding epoch. Although the strength of the interaction argues against it, one possible explanation is that the CS density around SN 2005gj is just somewhat lower than around SN 2002ic. A better possibility invokes mixing of the shocked ejecta, which can reduce the emergent X-ray flux. Which of these is more likely to be the correct explanation requires a better understanding of the environment of SN 2005gj than we have at present. Future studies of the optical light curve and spectra of this interesting object are strongy encouraged.
Resolving the issue of the X-ray non-detection of SN 2002ic-like objects has its dark side due to our introduction of the parameter , which is essentially incalculable. Even three-dimensional hydrodynamical simulations are unlikely to be able to recover this value in a fully self-consistent way. We, therefore, can predict in detail neither the spectrum nor the evolution of the X-ray flux from SN 2002ic-like supernovae. Two relevant remarks can be made, however. First, in the case of SN 2002ic the model without mixing predicts an increasing X-ray flux in the band below 10 keV up until day 400 (CCL). Therefore, X-ray detection at earlier epochs is unlikely to be more favorable, as the lack of detection of SN 2005gj at roughly 80 days after explosion (versus 260 days for SN 2002ic) tends to support. The second remark relates to the spectrum of the emergent X-ray emission: hard X-rays (i.e., with photon energies greater than 20 keV) are not affected by the absorption that mutes the lower energy flux (see Fig. 12). Future sensitive X-ray observations covering a wider energy band ( keV), therefore, should reveal a SN 2002ic-like event as a strongly absorbed hard X-ray source and thus verify the proposed mixing scenario.
Appendix A X-ray Emission from Host Galaxies
Only the host galaxies of the two nearby SNe, NGC 3170 and NCG 1371, show any evidence for X-ray emission. In each case there is a compact, spectrally hard, nuclear X-ray source in addition to faint diffuse emission. Here we present a brief report on the new information from the Chandra observations of these galaxies.
A.1. NGC 3190 and other nearby galaxies
NGC 3190 is a member of the Hickson Compact Group 44, also the Leo III group, and is classified as a Low Ionization Nuclear Emission Region (LINER) galaxy. X-ray emission from this galaxy was first reported by Pildis et al. (1995) using a short (5 ks) ROSAT PSPC observation from which it was only possible to determine a broadband luminosity of ergs s-1 (0.07–3 keV band), where we have corrected their published result for our assumed distance to the galaxy. Liu & Bregman (2005) report the presence of a compact nuclear X-ray source with an estimated X-ray flux of ergs s-1 (0.3–8 keV band) based on ROSAT HRI data.
The Chandra data (Fig. 1) reveal that the compact nuclear source is spectrally hard and, in addition, is embedded in a faint, diffuse, spectrally soft, extended component. This latter component tends to lie north and east of the nucleus, and clearly avoids the prominent dust lane that runs through the galaxy from southeast to northwest some 10′′ south of the nucleus. The spectra shown in Fig. 5 were extracted from the 5 regions shown on Fig. 1. We have already discussed the bottommost spectrum in this figure (i.e., the background spectrum) in §3. All fits were carried out with the likelihood figure-of-merit function used for the background model fits, which does not yield an explicit goodness-of-fit criterion. However, the models, at least visually, provide a fairly good description of the spectral data. All spectral fits, except the absorbed nuclear power-law component, include absorption fixed at the Galactic HI column density value of .
The top spectrum comes from the innermost region: a circle 1.5′′ (160 pc) in radius centered on the mean position of the hard nuclear source (R.A.=10:18:05.63, Decl.=+21:49:56). For an acceptable fit the spectrum requires two components: a highly absorbed power-law as well as thermal emission (using the “mekal” model in xspec). The best fit thermal emission model has keV and emission measure, cm-3. The power-law component has a fixed photon index of with a best-fit intrinsic absorption of cm-2 and flux density at 1 keV of photons keV-1 cm-2 s-1. The unabsorbed flux (0.5–10 keV) of the power-law component is ergs cm-2 s-1 or a luminosity of ergs s-1. It is clear that the LINER nature of this galaxy is due to an obscured, low luminosity, active galactic nucleus (AGN).
The three spectra in the middle of Fig. 5 are of the spectrally soft, extended emission and all are well described by thermal emission alone. The red spectrum was extracted from the second smallest region on Fig. 1, an ellipse with semi-major axis lengths of 3.9′′ and 3.2′′ (420 pc 340 pc). The best fit values for the thermal emission were keV and cm-3. The green spectrum came from the next larger region: an ellipse with semi-major axis lengths of 9.6′′ and 8.4′′ (1.0 kpc 0.9 kpc). This was well fit by thermal emission alone with a best fit keV and cm-3. Finally the blue spectrum came from the next region: an ellipse with semi-major axis lengths of 45′′ and 25′′ (4.8 kpc 2.7 kpc). Three obvious point sources were excluded from this region. This was well fit by thermal emission alone with a best fit keV and emission measure, cm-3.
From the spectral extraction regions we estimate emitting volumes (assuming an ellipsoidal geometry with the line-of-sight depth equal to the mean of the axis lengths of the extraction regions) and then convert the emission measures given above into the density of the emitting plasma (for ). We find density values that vary from cm-3 near the nucleus through values of 0.069 cm-3 and 0.015 cm-3 for the inner and mid galaxy regions to a value of 0.0025 cm-3 for the outer galaxy. These values are broadly consistent with an r-2 profile perhaps pointing toward an outflow from the central regions of the galaxy. In summary, the X-ray emission properties of NGC 3190 closely resemble those of other LINER galaxies studied by Terashima et al. (2002): a low luminosity and obscured AGN with soft ( keV) extended thermal emission.
X-ray emission from two other galaxies (NGC 3193 and NCG 3185) in HCG 44 were also reported by Pildis et al. (1995). We also detect X-ray emission from these same galaxies in the Chandra data, which, thanks to a fortuitous value of the roll angle, happen to lie within the field of view. Although clearly detected, the emission from NGC 3193 falls near the gap between chips S3 and S4, which renders derived results somewhat inaccurate. We do not consider this galaxy further.
NCG 3185 is 9′ off-axis where the imaging quality of Chandra is modest (5′′). The PSF there is however sufficient to separate the compact nuclear emission from the fainter off-nuclear source, XMMU J101737.4+214144, discovered by Foschini et al. (2002). The published XMM-Newton luminosity for the off-nuclear source is ergs s-1 (0.5–10 keV band) assuming a power-law source with a photon index of 2.0 and distance of 21.3 Mpc. We detect this source in the Chandra data with a net total of counts above background from which we estimate a luminosity of ergs s-1 (in the same spectral energy band using the same spectral form as the XMM-Newton study). This suggests some variability in the X-ray luminosity of this off-nuclear source. The nuclear source is stronger (detected at counts above background) and generates a luminosity of ergs s-1 (again for the same band and spectral form). This agrees with the value published by Cappi et al. (2006) from XMM-Newton observations.
A.2. NGC 1371
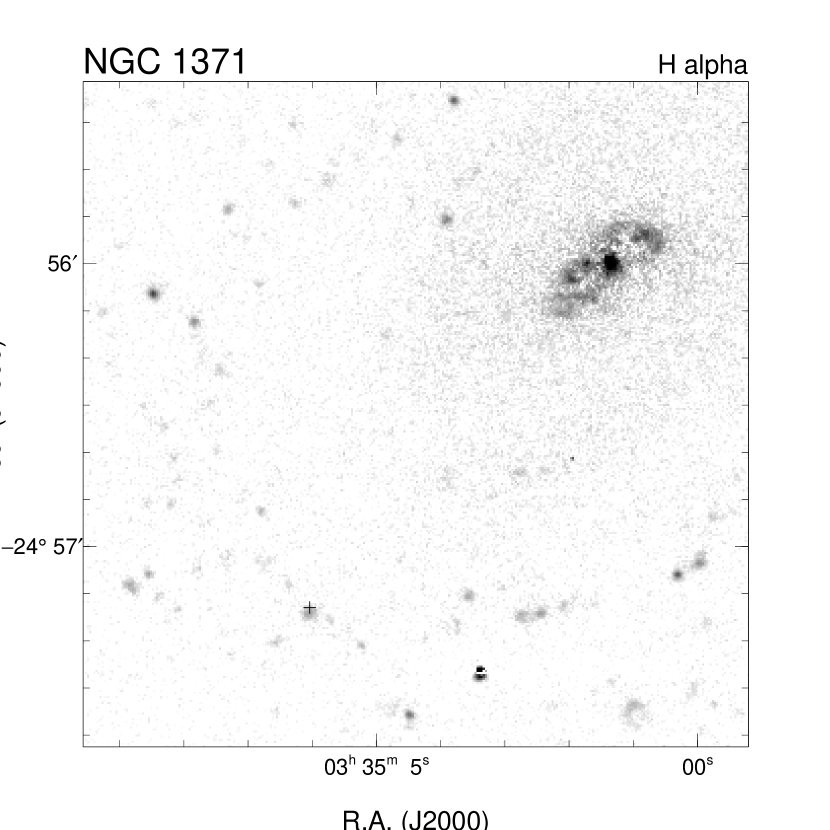
NGC1371 has typically been classified (see, e.g., Eskridge et al., 2002) as a weak bar, early-type spiral galaxy (SAB(rs)a according to the RC3). It is known to display an “Extended Nuclear Emission-line Region” (ENER) in the form of a disk-shaped zone of H emission (Hameed & Devereux, 1999) extending over an elliptical region with major axis lengths of roughly 30′′ 13′′ (2.5 kpc 1.1 kpc) (see Fig. 9). A compact nuclear source appears in H as well. The total H luminosity of the galaxy is ergs s-1, which is uncorrected for extinction and therefore a luminosity lower limit. The nuclear component (i.e., the emission within 1 kpc 12′′, which contains much of the ENER emission) contains roughly 6% of the total H luminosity. The nucleus of this galaxy has not been spectroscopically identified.
Our Chandra data reveal a compact source of X-ray emission at R.A.=03:35:01.35, Decl.=24:55:59.6 that is coincident with the nucleus and is well described by an absorbed power law spectrum (see top curve and data points in Fig. 6). The best-fit parameter values are a photon index of , intrinsic absorption of cm-2 (considerably higher than the Galactic column toward NGC 1371), and flux density at 1 keV of photons keV-1 cm-2 s-1. The unabsorbed flux (0.5–10 keV) is ergs cm-2 s-1 corresponding to a luminosity of ergs s-1. Whether the excess absorption is intrinsic to the nuclear source or comes from the intervening foreground portion of the galaxy is not clear. The nuclear X-ray and H luminosity values fall right on the published correlation between these quantities for Seyfert galaxies, LINERs, and AGN from Ho et al. (2001). Thus we conclude that NGC 1371 contains a low luminosity AGN with properties similar to those found in other nearby spiral galaxies.
We also detect diffuse X-ray emission on larger scales. The red spectrum in Fig. 6 (second from top) comes from the inner elliptical region identified on Fig. 4, which corresponds well to the extended H disk. The spectral extraction region used here has major axis lengths of 31.4′′ 16.1′′ (2.6 kpc 1.3 kpc) in size. Fits to the X-ray spectrum from this region prefer a two component model: low temperature thermal emission ( keV) in addition to either a hot thermal ( keV) or power law () component. Note that for these fits the absorbing column was fixed to the Galactic value (i.e., no extra absorption intrinsic to NGC 1371 was required). The unabsorbed 0.5–10 keV band flux of the hard component alone (for either spectral form) is ergs cm-2 s-1 corresponding to a luminosity of ergs s-1. The soft component yields a flux of ergs cm-2 s-1 (equivalent to a luminosity of ergs s-1) entirely in the 0.5–2 keV band.
Faint diffuse soft X-ray emission is visible on Fig. 4 within the outer elliptical region centered on the nucleus. This region, with major axis lengths of 104′′ 75′′ (8.6 kpc 6.2 kpc), covers the bright central portion of NGC 1371. Fits to the X-ray spectrum (shown as the blue curve and data points third from the top on Fig. 6) are consistent with a thermal spectrum ( keV). The X-ray flux is ergs cm-2 s-1 (equivalent to a luminosity of ergs s-1) and again appears entirely in the 0.5–2 keV band.
The fitted emission measure of the soft thermal component in the disk region is cm-3, while that of the outer elliptical region is cm-3. These values lead to mean gas densities of cm-3 in the disk region and cm-3 within the outer ellipse. For the inner disk-like region of NGC 1371, the close morphological match between the X-ray and H emission argues that the X-rays we see surrounding the nuclear AGN come from the integrated flux of sources linked to recent star formation, such as supernova remnants, winds from young massive stars, X-ray binaries, and so on. The composite nature of the X-ray spectrum, especially the presence of the hard emission component, points to the need for a contribution from a population of X-ray binaries. However no individual X-ray source is clearly visible in this region (aside from the nucleus) with a luminosity greater than ergs s-1.
There are three unresolved X-ray sources that are nearly coincident (i.e., offset by 3′′) with individual H II regions in the H image of Hameed & Devereux (1999). The brightest of these, CXOU J033506.0245713, is approximately 1.6′ southeast of the nucleus and is indicated by the cross in Fig. 9 (right panel). The 0.5–10 keV band flux of this source is ergs cm-2 s-1 assuming a hard power-law or high temperature bremsstrahlung spectral form, either of which describes the data well. The other two sources, CXOU J033500.2245437 and CXOU J033452.7245527, are each roughly one-third as bright in the Chandra data. The luminosities of these sources, if they are in NCG 1371 as seems likely, are ergs s-1 for the two fainter ones and ergs s-1 for the brighter one. With the exception of the nucleus, these are the brightest sources within the optical extent () of NGC 1371. Their high X-ray luminosity, generally hard spectra, and spatial association with H II regions argue that these are accreting high mass X-ray binaries.
Four other sources were detected at high significance (10 counts) within this area, while there were three others with 7–8 counts. None of these other sources shows a counterpart in the H or continuum images of (Hameed & Devereux, 1999) or in 2MASS infrared images (Jarrett et al., 2003). We expect only 3 unrelated background sources at these flux levels, so most of these should be new sources associated with NCG 1371.
References
- Aldering et al. (2006) Aldering, G., et al. 2006, ApJ, 650, 510
- Barentine et al. (2005) Barentine, J., et al. 2005, CBET, 247
- Benetti et al. (2002) Benetti, S., Altavilla, G., Pastorello, A., Riello, M., Turatto, M., Cappellaro, E., Tomov, T., & Mikolajewski, M. 2002, IAU Circ., 7848
- Benetti et al. (2004) Benetti, S., et al. 2004, MNRAS, 348, 261
- Benetti et al. (2006) Benetti, S., Cappellaro, E., Turatto, M., Taubenberger, S., Harutyunyan, A., & Valenti, S. 2006, ApJ, 653, L129
- Blondin (2001) Blondin, J. M. 2001, in Young Supernova Remnants, ed. S. S. Holt & U. Hwang (Melville, NY: AIP), 59
- Blondin & Ellison (2001) Blondin, J. M., & Ellison, D. C. 2001, ApJ, 560, 244
- Branch et al. (1995) Branch, D., Livio, M., Yungelson, L. R., Boffi, F. R., Baron, E. 1995, PASP, 107, 1019
- Cacella et al. (2002) Cacella, P., Hirose, Y., Nakano, S., Kushida, Y., Kushida, R., & Li, W. D. 2002, IAU Circ., 7847
- Cappi et al. (2006) Cappi, M., et al. 2006, A&A, 446, 459
- Chevalier (1982a) Chevalier, R. A. 1982a, ApJ, 258, 790
- Chevalier (1982b) Chevalier, R. A. 1982b, ApJ, 259, 302
- Chevalier & Blondin (1995) Chevalier R. A., & Blondin J. M. 1995, ApJ, 444, 312
- Chevalier & Fransson (1994) Chevalier, R. A., & Fransson, C. 1994, ApJ, 420, 268
- Chugai (1992) Chugai, N. N. 1992, SvA, 36, 63
- Chugai & Chevalier (2007) Chugai, N. N., & Chevalier, R. A. 2007, ApJ, 657, 378
- Chugai et al. (2004) Chugai, N. N., Chevalier, R. A., & Lundqvist, P. 2004, MNRAS, 355, 627 (CCL)
- Chugai & Yungelson (2004) Chugai, N. N., & Yungelson, L. R. 2004, Astron. Letters, 30, 65
- Cox et al. (2000) Cox, A. N. 2000, Allen’s Astrophysical Quantities, (4th ed.; New York: Springer-Verlag)
- Cumming et al. (1996) Cumming, R. J., Lundqvist, P., Smith, L. J., Pettini, M., & King, D. L. 1996, MNRAS, 283, 1355
- Deng et al. (2004) Deng, J., Kawabata, K. S., Ohyama, Y., Nomoto, K., Mazzali, P. A., Wang, L., Jeffery, D. J., Iye, M., Tomita, H., & Yoshii, Y. 2004, ApJ, 605, 37
- Dickey & Lockman (1990) Dickey, J. M., & Lockman, F. J. 1990, ARAA, 28, 215
- Eskridge et al. (2002) Eskridge, P. B., et al. 2002, ApJS, 143, 73
- Foschini et al. (2002) Foschini, L., et al. 2002, A&A, 392, 817
- Fransson et al. (1996) Fransson, C., Lundqvist, P., & Chevalier, R. A. 1996, ApJ, 461, 993
- Frieman (2005) Frieman, J. 2005, IAU Circ., 8616
- Gull (1973) Gull, S. F. 1973, MNRAS, 161, 47
- Hameed & Devereux (1999) Hameed, S., & Devereux, N. 1999, AJ, 118, 730
- Hamuy et al. (1995) Hamuy, M., Phillips, M. M., Maza, J., Suntzeff, N. B., Schommer, R., & Aviles, A. 1995, AJ, 109, 1
- Hamuy et al. (2002) Hamuy, M., Maza, J., & Phillips, M. 2003, IAU Circ., 8028
- Hamuy et al. (2003a) Hamuy, M., Phillips, M., & Maza, J. 2003, IAU Circ., 8151
- Hamuy et al. (2003b) Hamuy, M., Phillips, M., Suntzeff, N. B., Maza, J., Gonzalez, L. E.. Roth, M., Krisciunas, K., Morrell, N., Green, E. M., Persson, S. E., & Mccarthy, P. J. 2003b, Nature, 424, 651
- Ho et al. (2001) Ho, L. C., et al. 2001, ApJ, 549, L51
- Höflich & Khokhlov (1996) Höflich, P. & Khokhlov, A. M. 1996, ApJ, 457, 500
- Immler et al. (2005) Immler, S., Petre, R., & Brown, P. 2005, IAU Circ., 8633
- Immler et al. (2006) Immler, S., et al. 2006, ApJ, 648, L119
- Jarrett et al. (2003) Jarrett, T. H., Chester, T., Cutri, R., Schneider, S. E., & Huchra, J. P. 2003, AJ, 125, 525
- Jun at al. (1996) Jun, B.-I., Jones, T. W.. & Norman, M. L. 1996, ApJ, 468, L59
- Kawakita et al. (2002) Kawakita, H, Kinugasa, K., Ayani, K., & Yamaoka, H. 2002, IAU Circ., 7848
- Klein, McKee, & Colella (1994) Klein, R. I., McKee, C. F., & Colella, P. 1994, ApJ, 420, 213
- Krisciunas et al. (2004) Krisciunas, K., et al. 2004, AJ, 128, 3034
- Liu & Bregman (2005) Liu, J.-F., & Bregman, J. N. 2005, ApJS, 157, 59
- Matheson et al. (2002) Matheson, T., Jha, S., Challis, P., Kirshner, R., & Hradecky, V. 2002, IAU Circ., 7849
- Mattila et al. (2005) Mattila, S., Lundqvist, P., Sollerman, J., Kozma, C., Baron, E., Fransson, C., Leibundgut, B., & Nomoto, K. 2005, A&A, 443, 649
- Nomoto et al. (2005) Nomoto, K., Suzuki, T., Deng, J., Uenishi, T., & Hachisu, I. 2005, 1604-2004: Supernovae as Cosmological Lighthouses, 342, 105
- Panagia et al. (2006) Panagia, N., Van Dyk, S. D., Weiler, K. W., Sramek, R. A., Stockdale, C. J., & Murata, K. P. 2006, ApJ, 646, 369
- Patat et al. (2005) Patat, F., Baade, D., Wang, L., Taubenberger, S., & Wheeler, J. C. 2005, IAU Circ., 8631
- Perlmutter et al. (1999) Perlmutter, S., et al. 1999, ApJ, 517, 565
- Pildis et al. (1995) Pildis, R. A., Bregman, J. N., & Evrard, A. E. 1995, ApJ, 443, 514
- Pozdnyakov, Sobol, & Sunyaev (1976) Pozdnyakov, L. A., Sobol, I. M., & Sunyaev, R. A. 1976, SvAL, 2, 55
- Prieto et al. (2005) Prieto, J., Garnavich, P., DePoy, D., Marshall, J., Eastman, J., & Frank, S. 2005, IAU Circ., 8633
- Prieto et al. (2007) Prieto, J. L., et al. 2007, ArXiv e-prints, 706, arXiv:0706.4088
- Puckett et al. (2005) Puckett, T., Pelloni, A., Baek, M., Prasad, R. R., & Li, W. 2005, IAU Circ., 8630
- Riess et al. (1996) Riess, A. G., Press, W. H., & Kirshner, R. P. 1996, ApJ, 473, 88.
- Riess et al. (1998) Riess, A. G., et al. 1998, AJ, 116, 1009
- Riess et al. (1999) Riess, A. G., et al. 1998, AJ, 118, 2675
- Schlegel & Petre (1993) Schlegel, E. M., & Petre, R. 1993, ApJ, 412, L29
- Soderberg (2006) Soderberg, A. 2006, ATel, 722
- Terashima et al. (2002) Terashima, Y., Iyomoto, N., Ho, L. C., & Ptak, A. F. 2002, ApJS, 139, 1
- Tully (1988) Tully, R. B. 1988, Nearby Galaxies Catalog (Cambridge: Cambridge Univ. Press)
- Wang et al. (2004) Wang, L., Baade, D., Höflich, P., Wheeler, J. C., Kawabata, K., & Nomoto, K. 2004, ApJ, 604, L53
- Wood-Vasey et al. (2002) Wood-Vasey, W. M., et al. 2002, IAU Circ., 8019
- Wood-Vasey et al. (2004) Wood-Vasey, W. M., Wang, L., & Aldering, G. 2004, ApJ, 616, 339