Outflowing atomic and molecular gas at towards 1504+377
Abstract
We report the detection of OH 1667 MHz and wide Hi 21cm absorption at towards the red quasar 1504+377, with the Green Bank Telescope and the Giant Metrewave Radio Telescope. The Hi 21cm absorption extends over a velocity range of km/s blueward of the quasar redshift (), with the new OH 1667 MHz absorption component at km s-1, nearly coincident with earlier detections of mm-wave absorption at . The atomic and molecular absorption appear to arise from a fast gas outflow from the quasar, with a mass outflow rate yr-1 and a molecular hydrogen fraction . The radio structure of 1504+377 is consistent with the outflow arising due to a jet-cloud interaction, followed by rapid cooling of the cloud material. The observed ratio of HCO+ to OH column densities is times higher than typical values in Galactic and high- absorbers. This could arise due to small-scale structure in the outflowing gas on sub-parsec scales, which would also explain the observed variability in the Hi 21cm line.
keywords:
quasars: individual : quasars: absorption lines – galaxies: ISM1 Introduction
The quasar 1504+377 is a rare case of a radio-loud active galactic nucleus (AGN) hosted by a disk galaxy (e.g. Perlman et al. 1996; Carilli et al. 1997). The flat-spectrum radio emission arises from a compact core and a one-sided jet to the southwest, with the jet axis aligned (within ) with the major axis of the host galaxy (Polatidis et al., 1995; Fomalont et al., 2000). The AGN is heavily reddened (-K = 5.1) and was not detected in a deep R-band image, suggesting a high level of dust obscuration (Stickel et al., 1996). Consistent with this, strong redshifted mm-wave molecular absorption has been detected towards the radio source (Wiklind & Combes, 1996a), with two absorption complexes at (system A) and (system B), close to the redshift of the host galaxy (; Stickel & Kühr 1994).
Besides the mm-wave transitions, Hi 21cm, OH 1665 MHz and OH 1667 MHz absorption have all been detected from system A, with strong, wide profiles extending over a velocity range of km s-1 (Wiklind & Combes, 1996a; Carilli et al., 1997; Kanekar & Chengalur, 2002). In contrast, the mm-wave absorption in system B is quite narrow [full-width-at-half-maximum (FWHM) km s-1] and neither Hi 21cm nor OH absorption have been detected at this redshift (Carilli et al., 1997, 1998). This is the only mm-wave absorber that has not hitherto been detected in OH or Hi 21cm absorption (Wiklind & Combes, 1994, 1995, 1996a, 1996b; Chengalur et al., 1999; Kanekar & Chengalur, 2002; Kanekar et al., 2003) and is thus an excellent candidate for a deep search in these transitions. Beside studying physical conditions in the interstellar medium (ISM) of the QSO host, the detection of these lines would, in principle, also allow one to test for changes in the fundamental constants from to the present epoch (Darling, 2003; Chengalur & Kanekar, 2003; Kanekar et al., 2004). Unfortunately, the OH 1665 MHz line from lies at the same frequency as the known 1667 MHz absorption from (Kanekar & Chengalur, 2002), implying that it (and the latter 1667 MHz line) cannot be used to probe fundamental constant evolution. We report here a search for the other three redshifted OH ground-state lines (at rest frequencies of 1667.3590, 1612.2310 and 1720.5299 MHz) and the Hi 21cm line towards 1504+377 with the Giant Metrewave Radio Telescope (GMRT) and the Green Bank Telescope (GBT), resulting in the detection of OH 1667 MHz and Hi 21cm absorption at .
2 Observations and data analysis
A search for the 1667 MHz and 1720 MHz OH lines from was initially carried out with the GMRT on 26 and 27 March 2006, using the 256-channel mode of the correlator. Bandwidths of 1 and 4 MHz, centred at 997.37 and 1028.77 MHz, were used for the 1667 and 1720 MHz observations, respectively (also allowing a search for the 1720 MHz line from system A), yielding velocity resolutions of km s-1 and km s-1 after Hanning smoothing. 3C286 was used to calibrate the flux density scale and the bandpass shape; no secondary calibrator was observed as 1504+377 is a phase calibrator for the GMRT. The on-source times in the 1667 and 1720 MHz transitions were hours and hours, respectively.
The GMRT data were analysed in “classic” AIPS, using standard procedures. After initial editing to remove corrupted data, continuum images were made of the field at the two frequencies; both images yielded a flux density of Jy for 1504+377. The radio continuum at each frequency was then subtracted out using the task UVLIN and the residual visibilities shifted to the heliocentric frame and imaged in all channels. The final spectra were then extracted by a cut through the spectral cubes at the location of 1504+377.
The GMRT observations resulted in the detection of a weak absorption feature at the expected frequency of the redshifted 1667 MHz line. To confirm this and to obtain a better Hi 21cm spectrum, we retrieved archival GBT datasets covering the redshifted Hi 21cm line (from December 2003) and all four ground-state OH lines (from September 2004). The Hi 21cm line was later re-observed with the GBT in November 2006, to confirm the wide, weak absorption seen in the archival data.
The GBT observations were carried out in total-power, position-switched mode. The OH runs used four 12.5 MHz Auto-Correlation Spectrometer (ACS) bands, with 8192 channels, centred on the redshifted OH 18cm frequencies. This allowed simultaneous coverage of all four OH 18cm lines from both redshifts, with velocity resolutions of km s-1 after Hanning smoothing. The Hi 21cm observations of 2003 and 2006 used a single 12.5 MHz ACS band with 16384 and 32768 channels, respectively, giving resolutions of km s-1 (in 2003) and km s-1 (in 2006). The on-source times were 2.5 hours for the OH lines and 0.3 and 1.5 hours for the Hi 21cm line in 2003 and 2006, respectively.
All GBT data were analysed in DISH, the AIPS++ single-dish package, using standard procedures. After initial data editing and calibration, the continuum flux density was measured using RFI- and line-free channels. A second-order baseline was then fit to each (typically 10-second) record and subtracted out during the process of calibration; the residual data were then averaged together to obtain the final spectra for each transition. In the case of multiple observing epochs (e.g. the Hi 21cm line), the data from different runs were averaged together, after smoothing and interpolating to the same spectral resolution and frequency scale. The GBT 1720 MHz dataset was affected by strong terrestrial interference (RFI) and will hence not be discussed further.
3 Results
3.1 Spectra
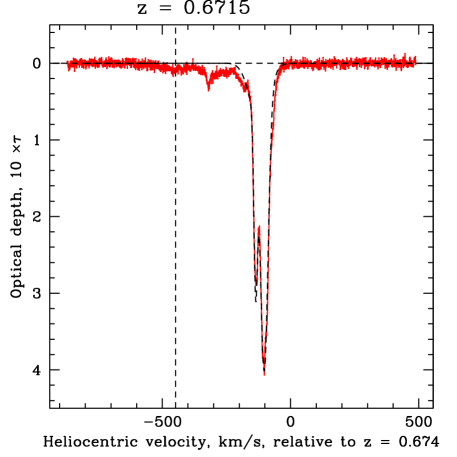
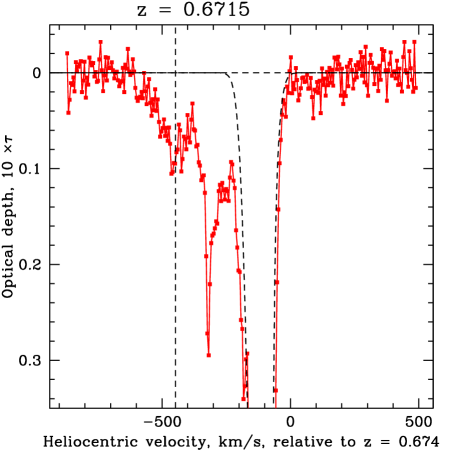
The left panel of Fig. 1 shows the final GBT Hi 21cm spectrum towards 1504+377, with optical depth (computed assuming a flux density of 1.04 Jy) plotted as a function of heliocentric velocity, in km s-1, relative to . This has a root-mean-square (RMS) noise of 0.0032, in optical depth units, per km s-1 channel. The strong 21cm absorption at km s-1 (system A) was detected by Carilli et al. (1997); the dashed curve shows the 3-Gaussian fit of Carilli et al. (1998) to their WSRT spectrum (which we note, in passing, is times less sensitive than the GBT spectrum of Fig. 1). The right panel of the figure shows a zoomed-in version of the spectrum, smoothed to a resolution of km s-1 to clearly display the wide absorption tail. The Hi 21cm absorption extends well beyond the absorption detected by Carilli et al. (1997, 1998), with a full-width-between-nulls (FWBN) of km s-1. The new extended absorption can be separated into three distinct parts, a narrow component at km s-1 (i.e. ), a broad feature at km s-1 [nearly the same redshift as the mm-wave absorption of Wiklind & Combes (1996a)] and a smooth weak tail, extending out to km s-1. The integrated Hi 21cm optical depth is km s-1, with around 15% of the integrated optical depth in the new components detected here.
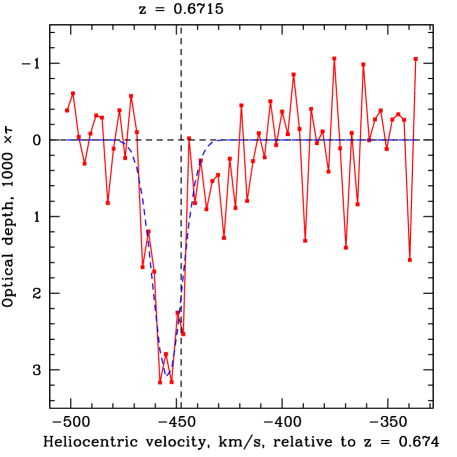
Weak narrow absorption was visible close to the expected frequency of the redshifted OH 1667 MHz line in both the GMRT and the GBT spectra (at significance in each spectrum, after averaging all channels). It is very unlikely that the absorption is due to local RFI, given that the spectra were taken at independent telescopes, separated by a period of 2.5 years and with very different doppler shifts. Fig. 2 shows our final OH 1667 MHz spectrum, obtained by averaging the GMRT and GBT spectra with weights determined by the RMS noise values [ (GMRT) and (GBT), per 2.75 km s-1 channel, in optical depth units]. The optical depth RMS noise on this spectrum is per km s-1 channel. The spectrum is well-fit by a single Gaussian model (the dashed curve in the figure), with FWHM km s-1 and a peak optical depth of , at . The integrated 1667 MHz optical depth is km s-1.
Finally, absorption was not detected in the redshifted OH 1612 and 1720 MHz lines (not shown here) at any velocity. The RMS noise on the GMRT 1720 MHz spectrum is per km s-1 channel, while that on the GBT 1612 MHz spectrum is per km s-1 channel, in optical depth units. The upper limits on the velocity-integrated optical depth in the 1720 and 1612 MHz lines are km s-1 and km s-1, after smoothing the GBT spectrum by 11 channels to a resolution of km s-1. These limits assume a Gaussian profile with FWHM km s-1, that of the fit to the OH 1667 MHz line. The ratio of the integrated optical depths in the 1665 MHz and 1612 MHz lines of system A is , higher than that expected () for gas in thermal equilibrium. Note that our sensitivity is insufficient to detect the satellite lines from system B, if the gas is in thermal equilibrium.
3.2 HI and OH column densities
For optically thin gas, the Hi and OH column densities can be derived from the Hi 21cm and OH 1667 MHz absorption profiles using the expressions
| (1) |
| (2) |
where (in K) is the Hi spin temperature, (in K), the OH excitation temperature, and and are the Hi and OH covering factors at the respective redshifted line frequencies. and have units of cm-2, while the integrals are over velocity, in km s-1. Carilli et al. (1997) used 1.6 and 5 GHz VLBI observations to estimate , if only the radio core (of angular size mas) is covered, and , if the inner jet is covered out to mas; this would require the absorbing material to have a spatial extent of pc and pc, respectively111We use the standard LCDM cosmology, with H km s-1 Mpc-1, and .. Typical sizes of Galactic molecular clouds range from pc (Blitz, 1990), somewhat smaller than the latter value; we will hence assume that at least the radio core is covered in both Hi 21cm and OH lines, i.e. and .
Next, it is not possible to determine either or using only the Hi 21cm or OH 1667 MHz absorption profiles. Spin temperature estimates range from K in the Galaxy and local and intermediate redshift spiral disks (e.g. Braun & Walterbos 1992) to K in high redshift damped Lyman- systems (Kanekar & Chengalur, 2003). Assuming K gives a lower limit to the Hi column density. Further, following Kanekar & Chengalur (2002), we will assume K, a typical temperature in dark clouds. We then obtain cm-2 and cm-2. It should be emphasized that the above Hi column density is for the entire profile, i.e. is not restricted to the absorption from system B, while the OH column density is merely for this system. Finally, we use the empirical relation (Liszt & Lucas, 1999) to estimate the molecular hydrogen column density to be cm-2 for system B. System A has cm-2 (Kanekar & Chengalur, 2002), giving a total column density of cm-2 at .
4 Discussion
4.1 Variability in the Hi 21cm profile
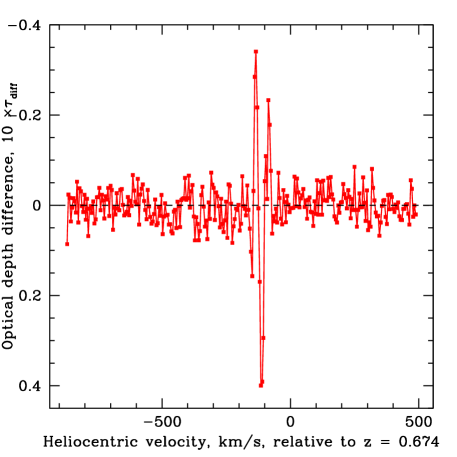
Fig. 3 shows a plot of the difference between the Hi 21cm optical depths in 2003 and 2006 versus heliocentric velocity, in km s-1, relative to . The strong features in the difference spectrum between km s-1 and km s-1 indicate significant changes ( of the line depth) in the Hi 21cm profile between 2003 and 2006. Note that the difference cannot be due to a simple scaling of one or both of the spectra, as different spectral components show changes of opposite sign. While the possibility that the observed change might be due to RFI cannot be ruled out, no evidence was seen for RFI at these frequencies, in either these or our other 850 MHz GBT datasets. The profile “variability” is coincident with the strongest spectral components, with the rest of the profile showing no evidence for changes within the noise.
Variability in redshifted Hi 21cm profiles has been seen earlier in two damped Lyman- systems, at towards 0235+164 (Wolfe et al., 1982) and towards 1127145 (Kanekar & Chengalur, 2001). While changes in the latter two profiles have been detected on far shorter timescales (a few days) than in 1504+377, it is interesting that all three sources contain highly compact ( mas-scale) components. Possible explanations for the observed changes towards 1504+377 include refractive scintillation in the Galactic interstellar medium (for which the background source need not be compact; Macquart 2005), or transverse motion of a source component on VLBI scales (Briggs, 1983). Both models require small-scale structure in the 21cm optical depth of the absorbing gas.
4.2 Physical conditions in the absorbing gas
The radio core of 1504+377 and the nucleus of the host galaxy are coincident within the errors () in the R-band image of Stickel & Kühr (1994). At mm-wave frequencies, the core dominates the quasar flux density, with very little emission coming from the steep-spectrum jet (Wiklind & Combes, 1996a). The core is also likely to be extremely compact at these frequencies, implying that both mm-wave absorbers arise along a single line of sight, which must also pass extremely close to the centre of the host galaxy. Wiklind & Combes (1996a) noted that it is impossible to produce two absorption components at very different velocities in such circumstances if the absorbing gas is in pure rotational motion. The large separation ( km s-1) between the two observed absorption velocities is thus suggestive of the presence of strong non-circular orbits; these authors argued in favour of a scenario in which the broad absorption from system A originates close to the nucleus (in a nuclear ring or a bar), while the narrow absorption of system A arises in a more-distant cloud in the disk of the host galaxy. In this picture, the systemic redshift is . On the other hand, Carilli et al. (1997) used the fact that the optical emission redshift of the host galaxy () is in excellent agreement with that of the higher-redshift complex to argue that the latter is the systemic redshift. They also pointed out that the outflow velocity of system A in this model ( km s-1) is too large for a cloud in the outer disk of the parent galaxy and suggested the possibility that it might arise in a high-velocity cloud, due to tidal interactions between the host galaxy and a nearby object seen in the R-band image of Stickel & Kühr (1994). Our new GBT Hi 21cm spectrum of Fig. 1 clearly shows that the two absorption systems are, in fact, part of a continuous absorption complex, spanning km s-1 and extending from the optical redshift of out to . The 21cm absorption lies entirely blueward of the optical redshift, implying that it must arise in gas that is outflowing from the quasar.
The large velocity spread of the Hi outflow in 1504+377 is similar to that seen in a number of low-redshift AGNs (Morganti et al., 2005). These authors note that all known fast Hi outflows have been detected in radio galaxies in early or re-started phases of their radio activity. There is also evidence that the most likely mechanism to explain such fast Hi outflows is interaction between the radio jets and the surrounding interstellar medium (e.g. Morganti et al. 2005), with rapid cooling taking place in the gas after a jet-cloud interaction, as expected from numerical simulations (e.g. Fragile et al. 2004). The fact that 1504+377 shows no extended radio structure (the outer jet extends to only mas, i.e. pc, from the nucleus; Polatidis et al. 1995) suggests that it too is in a early phase of its radio activity. Recent 5 GHz VLBI observations (Bolton et al., 2006) have found a new north-eastern extension, which was not seen in earlier (deeper) images (e.g. Fomalont et al. 2000), demonstrating that the source is currently in an active phase. Finally, the fact that the radio structure in 1504+377 is strongly one-sided (e.g. Fomalont et al. 2000) indicates that the jet lies close to the line of sight towards the core. The above suggestion that jet-cloud interactions are responsible for local gas cooling is consistent with the fact that mm-wave absorption (which takes place in cold gas and, as noted earlier, must arise towards the core) is seen at multiple velocities along the line of sight.
It thus appears that the wide Hi 21cm and molecular absorption towards 1504+377 arise in outflowing gas from the AGN that is cooling rapidly after an interaction with the south-western radio jet. This is the highest redshift at which such a high-velocity outflow has been observed (e.g. Morganti et al. 2005) and, perhaps more interesting, the first case where molecular gas has been detected in the outflow. The fraction is . Morganti et al. (2005) assume K to estimate Hi column densities for sources in their sample due to the proximity of the gas to the AGN and the likely presence of shocks. Using this value for consistency gives a molecular fraction of in the outflowing gas.
We estimate the mass outflow rate using the model of Heckman et al. (2000), in which a constant-velocity, mass-conserving wind flows into a solid angle from a minimum radius , viz.
| (3) |
where is the outflow velocity and , the total hydrogen column density of the outflowing gas. We will assume that the minimum radius is pc, the size of the radio core, and, following Morganti et al. (2005), that steradians and km s-1. The total hydrogen column density at is cm-2, again assuming K. This leads to an estimated mass outflow rate of yr-1, comparable to estimates in nearby fast Hi outflows (Morganti et al., 2005).
Wiklind & Combes (1996a) noted that HCO+ is highly over-abundant in system B, enhanced by at least an order of magnitude relative to expected abundances in chemical models. The ratios of HCO+ to CO and HCO+ to HCN column densities here are times larger than in system A. While such large differences in relative abundances between HCO+ and species such as CO, HCN, etc, have been observed in Galactic clouds (Lucas & Liszt, 1998), the ratio of OH to HCO+ column densities in both the Galaxy and a sample of four redshifted HCO+ and OH absorbers has been found to be fairly constant, with (Liszt & Lucas, 1996; Kanekar & Chengalur, 2002) over more than two orders of magnitude in HCO+ column density. Liszt & Lucas (2004) found this ratio to show a large spread (by a factor of ) in the clouds towards Cen.A and NGC1052, with the HCO+ and OH lines also showing very different kinematics, but argued that this could be explained by differing source structure and foreground free-free opacity at the OH and HCO+ frequencies, source variability between observing epochs, and excitation effects at high OH column densities ( cm-2; van Langevelde et al. 1995). Conversely, system B has , discrepant by more than an order of magnitude from the expected value. However, 1504+377 is highly compact at both mm-wave and cm-wave frequencies (with a cm-wave core-fraction of %; Carilli et al. 1997) and the HCO+ and OH lines have very similar FWHMs [ km s-1 (OH) and km s-1 (HCO+)], making it likely that they arise from similar gas. Increasing by an order of magnitude could resolve this problem but such high values have never been seen in the Galaxy (e.g. Liszt & Lucas 1996). Similarly, the ratio of peak optical depths in the HCO+ and Hi 21cm lines in system A is , far larger than that seen in Galactic clouds (; Lucas & Liszt 1996; Liszt & Lucas 1996). Carilli et al. (1997) point out that high values of could result from either far warmer Hi or low molecular dissociation, but this would not explain the discrepancy in the ratio of OH and HCO+ column densities. If the latter is not due to real chemical differences between OH and HCO+ (which seems unlikely; Liszt & Lucas 2000), a plausible explanation is extreme small-scale structure in the opacity of the absorbing gas on sub-parsec scales, smaller than the size of the radio core at cm wavelengths. This could arise due to internal shocks or turbulence in the rapidly outflowing gas. As noted earlier, the observed variability in the Hi 21cm absorption at suggests similar small-scale structure at a different location in the outflow, which could also account for the large velocity difference ( km s-1) in peak OH and HCO+ absorption in system A (Kanekar & Chengalur, 2002). Monitoring the mm-wave lines for variability would be one way of testing this hypothesis.
Finally, comparisons between the OH, Hi 21cm and HCO+ redshifts from an absorber can be used to test the evolution of fundamental constants (Darling, 2003; Chengalur & Kanekar, 2003). However, the above possibility of small-scale structure in the absorbing gas makes it likely that any such comparisons in the absorbing gas towards 1504+377 will be dominated by local systematic velocity offsets. We conclude that this absorber is unlikely to be useful for the purpose of probing fundamental constant evolution.
5 Acknowledgments
We thank Francoise Combes for providing us with an ASCII file of the HCO+ spectrum towards 1504+377. We also thank the staff of the GMRT who made these observations possible. The GMRT is run by the National Centre for Radio Astrophysics of the Tata Institute of Fundamental Research. The National Radio Astronomy Observatory is operated by Associated Universities, Inc. under cooperative agreement with the National Science Foundation.
References
- Blitz (1990) Blitz L., 1990, in Blitz L., ed., The Evolution of the Interstellar Medium Vol. 12 of ASP Conf. Ser.. p. 273
- Bolton et al. (2006) Bolton R. C., Chandler C. J., Cotter G., Pearson T. J., Pooley G. G., Readhead A. C. S., Riley J. M., Waldram E. M., 2006, MNRAS, 367, 323
- Braun & Walterbos (1992) Braun R., Walterbos R., 1992, ApJ, 386, 120
- Briggs (1983) Briggs F. H., 1983, ApJ, 274, 86
- Carilli et al. (1997) Carilli C. L., Menten K. M., Reid M. J., Rupen M. P., 1997, ApJ, 474, L89
- Carilli et al. (1998) Carilli C. L., Menten K. M., Reid M. J., Rupen M. P., Yun M. S., 1998, ApJ, 494, 175
- Chengalur et al. (1999) Chengalur J. N., de Bruyn A. G., Narasimha D., 1999, A&A, 343, L79
- Chengalur & Kanekar (2003) Chengalur J. N., Kanekar N., 2003, Phys. Rev. Lett., 91, 241302
- Darling (2003) Darling J., 2003, Phys. Rev. Lett., 91, 011301
- Fomalont et al. (2000) Fomalont E. B., Frey S., Paragi Z., Gurvits L. I., Scott W. K., Taylor A. R., Edwards P. G., Hirabayashi H., 2000, ApJS, 131, 95
- Fragile et al. (2004) Fragile P. C., Murray S. D., Anninos P., van Breugel W., 2004, ApJ, 604, 74
- Heckman et al. (2000) Heckman T. M., Lehnert M. D., Strickland D. K., Armus L., 2000, ApJS, 129, 493
- Kanekar & Chengalur (2001) Kanekar N., Chengalur J. N., 2001, MNRAS, 325, 631
- Kanekar & Chengalur (2002) Kanekar N., Chengalur J. N., 2002, A&A, 381, L73
- Kanekar & Chengalur (2003) Kanekar N., Chengalur J. N., 2003, A&A, 399, 857
- Kanekar et al. (2003) Kanekar N., Chengalur J. N., de Bruyn A. G., Narasimha D., 2003, MNRAS, 345, L7
- Kanekar et al. (2004) Kanekar N., Chengalur J. N., Ghosh T., 2004, Phys. Rev. Lett., 93, 051302
- Liszt & Lucas (1996) Liszt H., Lucas R., 1996, A&A, 314, 917
- Liszt & Lucas (1999) Liszt H., Lucas R., 1999, in Carilli C. L., et al. eds, Highly Redshifted Radio Lines Vol. 156 of ASP Conf. Ser.. p. 188
- Liszt & Lucas (2000) Liszt H., Lucas R., 2000, A&A, 355, 333
- Liszt & Lucas (2004) Liszt H., Lucas R., 2004, A&A, 428, 445
- Lucas & Liszt (1996) Lucas R., Liszt H., 1996, A&A, 307, 237
- Lucas & Liszt (1998) Lucas R., Liszt H., 1998, A&A, 337, 246
- Macquart (2005) Macquart J.-P., 2005, A&A, 433, 827
- Morganti et al. (2005) Morganti R., Oosterloo T. A., Tadhunter C. N., van Moorsel G., Emonts B., 2005, A&A, 439, 521
- Morganti et al. (2005) Morganti R., Tadhunter C. N., Oosterloo T. A., 2005, A&A, 444, L9
- Perlman et al. (1996) Perlman E. S., Carilli C. L., Stocke J. T., Conway J., 1996, AJ, 111, 1839
- Polatidis et al. (1995) Polatidis A. G., Wilkinson P. N., Xu W., Readhead A. C. S., Pearson T. J., Taylor G. B., Vermeulen R. C., 1995, ApJS, 98, 1
- Stickel & Kühr (1994) Stickel M., Kühr H., 1994, A&AS, 105, 67
- Stickel et al. (1996) Stickel M., Rieke G. H., Kühr H., Rieke M. J., 1996, ApJ, 468, 556
- van Langevelde et al. (1995) van Langevelde H. J., van Dishoek E. F., Sevenster M. N., Israel F. P., 1995, ApJ, 448, L123
- Wiklind & Combes (1994) Wiklind T., Combes F., 1994, A&A, 286, L9
- Wiklind & Combes (1995) Wiklind T., Combes F., 1995, A&A, 299, 382
- Wiklind & Combes (1996a) Wiklind T., Combes F., 1996a, A&A, 315, 86
- Wiklind & Combes (1996b) Wiklind T., Combes F., 1996b, Nature, 379, 139
- Wolfe et al. (1982) Wolfe A. M., Briggs F. H., Davis M. M., 1982, ApJ, 259, 495