Spitzer Constraints on the Stellar Populations of Lyman-alpha Emitting Galaxies at
Abstract
We investigate the stellar populations of a sample of 162 Ly emitting galaxies (LAEs) at in the Extended Chandra Deep Field South, using deep Spitzer IRAC data available from the GOODS and SIMPLE surveys to derive reliable stellar population estimates. We divide the LAEs according to their rest-frame near-IR luminosities into IRAC-detected and IRAC-undetected samples. About 70% of the LAEs are undetected in 3.6 µm down to AB. Stacking analysis reveals that the average stellar population of the IRAC-undetected sample has an age of Myr and a mass of , consistent with the expectation that LAEs are mostly young and low-mass galaxies. On the other hand, the IRAC-detected LAEs are on average significantly older and more massive, with an average age Gyr and mass . Comparing the IRAC colors and magnitudes of the LAEs to Lyman break galaxies (LBGs) shows that the IRAC-detected LAEs lie at the faint blue end of the LBG color-magnitude distribution, suggesting that IRAC-detected LAEs may be the low mass extension of the LBG population. We also present tentative evidence for a small fraction () of obscured AGN within the LAE sample. Our results suggest that LAEs posses a wide range of ages and masses. Additionally, the presence of evolved stellar populations inside LAEs suggests that the Ly luminous phase of galaxies may either be a long-lasting or recurring phenomenon.
Subject headings:
cosmology: observations — galaxies: evolution — galaxies: high-redshift — galaxies: stellar content1. Introduction
Lyman-alpha emitting galaxies (LAEs) are important tracers of galaxy formation. The Ly emission is produced by on-going star formation in the galaxies, and the line emission enables discovery of objects that may be too faint to be seen in the continuum. LAEs therefore offer an opportunity to probe the faint end of galaxy formation at high redshift, and may serve as building blocks of larger galaxies in a hierarchical universe.
In recent years, there have been great advancements in narrow-band surveys of LAEs. Large samples of candidate LAEs now exist at redshifts (e.g. Hu et al., 2004; Malhotra & Rhoads, 2004; Taniguchi et al., 2005; Shimasaku et al., 2006; Dawson et al., 2007; Murayama et al., 2007; Ouchi et al., 2007). One outstanding question regarding the LAEs is their stellar population, which is important for understanding the physical nature of the LAEs and their connection with other high redshift galaxy populations such as Lyman break galaxies (LBGs; Shapley et al., 2003; Ando et al., 2006; Pentericci et al., 2007; Stanway et al., 2007). A difficulty often encountered when studying the stellar population of high-redshift galaxies is the necessity to have observations at or redward of rest-frame optical in order to constrain the total stellar mass. At , this means having either deep near-IR or Spitzer IRAC observations. Much progress has been made recently, however, and several studies have suggested that LAEs are small galaxies with masses (Gawiser et al., 2006a; Lai et al., 2007; Finkelstein et al., 2007; Pirzkal et al., 2007; Nilsson et al., 2007).
In this study, we focus on a sample of 162 LAEs at discovered in a narrow-band survey of the Extended Chandra Deep Field South (ECDF-S) by Gronwall et al. (2007). The narrow-band 4990 Å imaging covers an area of 992 arcmin2 and reaches a completeness limit of erg cm-2 s-1 (equivalent to a Ly luminosity erg s-1). Spectroscopic results confirm the robustness of the sample (details of the spectroscopy will be presented in Gawiser et al. 2007 and Lira et al., in preparation). Of the 52 candidates with sufficient S/N in the spectra to yield redshifts, 51 were confirmed to be LAEs (the remaining object is a AGN with C III] 1909 Å emission). The most likely contaminants in our sample are [O II] emitters. However, there should be a negligible number of these objects in our sample because by requiring the observer’s frame equivalent width to be Å, we eliminate all but the strongest (and rarest) [O II] emitters (Gronwall et al., 2007).
The narrow-band imaging in ECDF-S is supplemented by optical and near-IR observations from MUSYC (Gawiser et al., 2006b), GOODS (Dickinson et al., 2003), and GEMS (Rix et al., 2004) surveys, and Spitzer observations from GOODS and SIMPLE111http://www.astro.yale.edu/dokkum/SIMPLE/ (Damen et al., in preparation). Using the multi-wavelength data available in ECDF-S, we study the rest-frame UV to near-IR properties of this large sample of LAEs. We place special emphasis on the new Spitzer IRAC observations, which sample the rest-frame µm emission from the LAEs and provide valuable constraints on their stellar population and star formation history.
We assume a CDM cosmology with , , and . All magnitudes are in the AB system.
2. IRAC Observations of LAEs
When working with deep IRAC observations, source confusion is often an issue because of the broad IRAC PSF ( FWHM). Since the LAEs are in general quite faint in the IRAC bands, it is important to select a subsample whose IRAC photometry is not significantly contaminated by nearby objects. Beginning with the original sample of 162 LAEs, we select those with no detected neighbors within a 4″ radius ( the IRAC FWHM), and additionally reject LAEs with very bright neighbors at radius by visual inspection. This results in a high confidence IRAC-uncontaminated sample of 76 LAEs.
We further separate the IRAC-uncontaminated sample into an IRAC-detected sample and a corresponding IRAC-undetected sample. This division separates the rest-frame near-IR luminous objects from the less luminous ones. Of the 76 IRAC-uncontaminated LAEs, 52 are undetected in the IRAC 3.6 µm channel down to a flux limit of 0.3 Jy (). This is nominally the 2 detection limit of the survey. However, since the LAE positions are well determined from the narrow band imaging, it is possible to do slightly better with aperture photometry. Aperture corrected fluxes are measured from the IRAC images using 25 diameter apertures. The flux cut of 0.3 Jy corresponds approximately to a 3 detection limit for the individual objects. The initial IRAC-detected sample consists of 24 objects, but 6 objects are rejected as possible AGN or dusty objects (see below), leaving a total of 18 objects in the IRAC-detected sample.
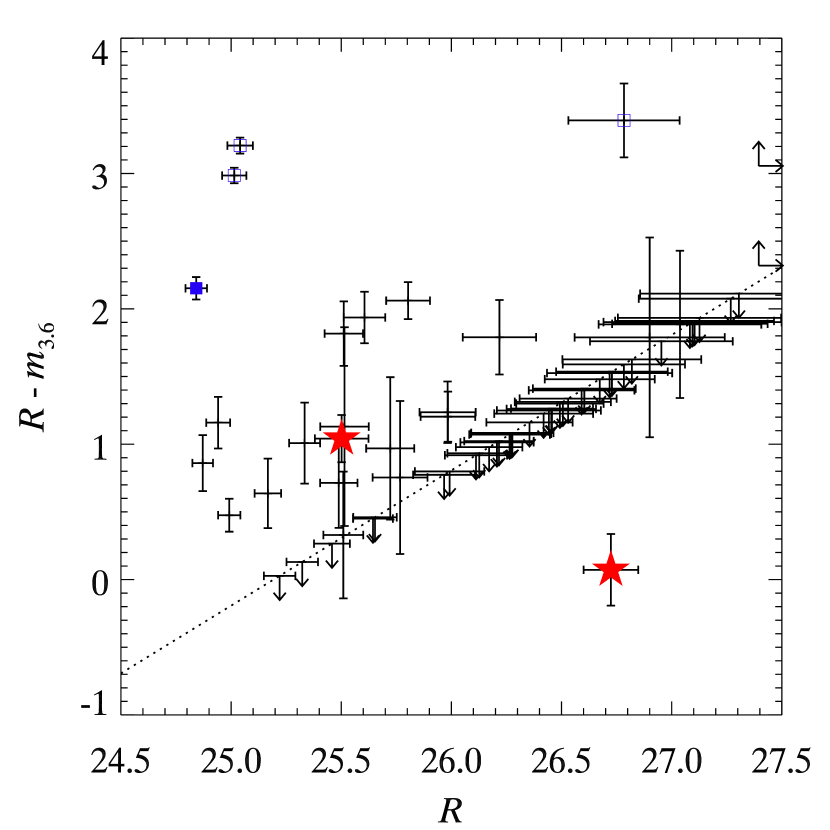
IRAC samples rest-frame µm at and provides important constraints on the mature stellar population in the LAEs. In particular, the color, shown for the IRAC-uncontaminated sample in Figure 1, probes the relative contribution from young and mature stellar populations, and is therefore an age indicator. The dotted line represents the flux limit for the IRAC-undetected sample. All objects in this sample will fall as upper limits on the dotted line. The survey limits imply that we are not sensitive to young stellar populations with . However, stacking analysis can be used to obtain constraints on the average properties of the IRAC-undetected sample (see next section). The IRAC-detected LAEs typically have red rest-frame UV to near-IR colors, , with a median of . The red colors of the IRAC-detected LAEs imply the possible presence of a significant mature stellar population in LAEs, a point we will examine more closely in the following section.
While the color traces the age of the stellar population, the 3.6 µm magnitude probes the mature stellar mass in the LAEs. Therefore, the IRAC-detected sample, which has 3.6 µm magnitudes ranging from , should in general be more massive than the IRAC-undetected sample. The IRAC-detected sample is also in general brighter in , with the majority of IRAC-detected LAEs being brighter than .
We also explore the possibility of a correlation between Ly luminosity and IRAC flux. The mean Ly luminosity of the IRAC-detected sample ( erg s-1) is about 40% higher than that of the IRAC-undetected sample ( erg s-1). This is only a weak correlation, considering that the average 3.6 µm flux of the IRAC-detected sample is higher than the IRAC-undetected sample (Figure 3). There is also significant overlap in the distributions of the two samples, in part due to the large ( dex) dispersion in within the subsamples.
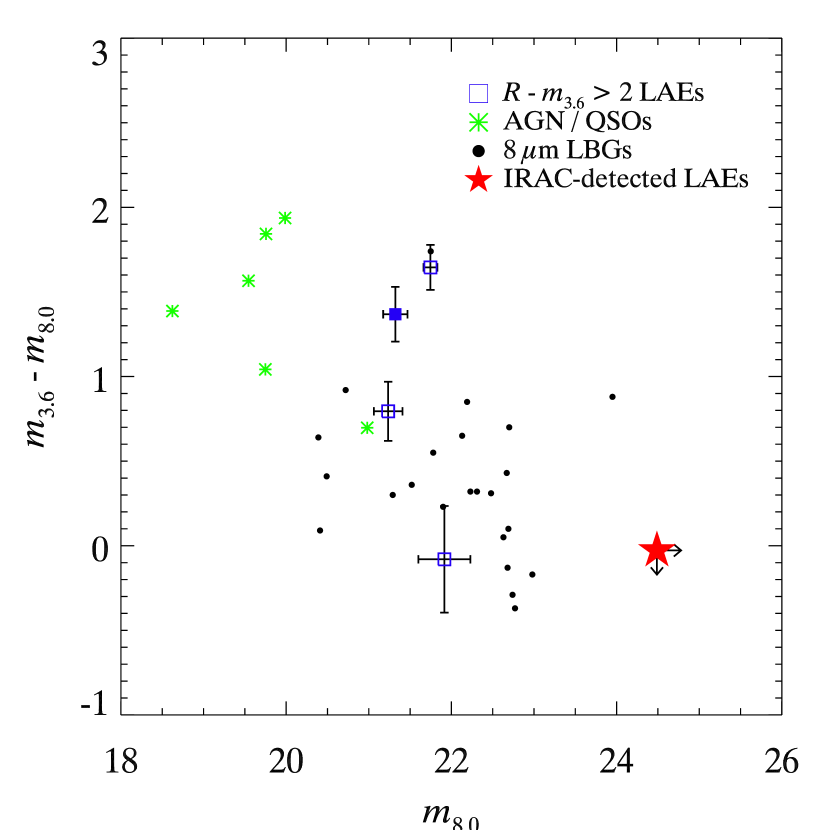
It is interesting to note that there are four objects in the sample, corresponding to LAE 1, 11, 117, and 144 in the Gronwall et al. (2007) catalog, with very red colors . LAE 1, the brightest Ly source in the sample, is detected in x-ray and is presumably an AGN (Gronwall et al., 2007). The similar colors of the remaining three x-ray undetected objects suggest that they may possibly be AGN as well. LAE 1, 11, and 117 are spectroscopically confirmed to be at . The x-ray detected object (LAE 1) shows C IV emission in its spectrum, while LAE 11 and 117 show only Ly emission (Lira et al., in preparation). LAE 144 is observed, but no line was detected in its spectrum. LAE 11 and 117 are in the central part of CDF-S where the keV (rest-frame keV) flux limit of erg s-1 cm-2 implies an upper limit of erg s-1 for the objects’ AGN x-ray luminosities. The four objects have colors ranging from , consistent with the colors of mid-IR selected AGN (Hickox et al., 2007). However, the observed colors can also be produced by a dusty stellar continuum with . These four objects are the only 8.0 µm detected sources in the IRAC-uncontaminated sample and with ranging from they are more than 2 mags brighter than the average IRAC-detected LAE (Figure 2). Two of the four objects have colors consistent with AGN and QSOs (Steidel et al. 2003; Magdis et al., in preparation). However, Figure 2 shows that the four objects have 8.0 µm magnitudes more similar to that of the 8 µm detected LBGs (Huang et al., 2005; Rigopoulou et al., 2006). There are a total of two x-ray detected objects in the original sample of 162 LAEs (the other x-ray detected object is not in the IRAC-uncontaminated sample), giving an AGN fraction of . The evidence presented here cannot rule out the possibility that the other three red LAEs are dusty LBG-like objects, but if they also turn out to be AGN, then the AGN fraction is .
Since the four LAEs have rather different properties than the rest of the LAE population, they are excluded from the conservative IRAC-detected sample. Two more objects are rejected since they are detected in 3.6 µm but not in , which may imply a large amount of dust reddening inconsistent with the rest of the IRAC-detected population. The subsequent analysis will be focused on the conservative IRAC-detected sample of 18 LAEs. However, we will also present results derived using the larger sample of 23 IRAC-detected LAEs (the x-ray detected LAE AGN is still excluded).
3. Stellar Population
Since the majority of the LAEs in our sample are undetected in the IRAC images, we perform a stacking analysis in order to measure the average properties of the sample. Again, we work only with the sample of 76 IRAC-uncontaminated LAEs. This is especially important when stacking the IRAC-undetected subsample because any flux contributions from bright neighbors could significantly skew the average. Because of crowdedness in the IRAC images, it is also necessary to clean the images before stacking by subtracting detected sources using a PSF fitting routine (StarFinder; Diolaiti et al., 2000). The optical and near-IR images are stacked in the same manner as the IRAC images, except that the subtraction of detected sources is not necessary in this case. Uncertainties in the stacked photometry are estimated by bootstrapping the original sample, and then repeating the stacking and flux measurement on the bootstrap samples. The uncertainties thus derived take into account both random fluctuations and the intrinsic luminosity dispersion among the LAE population.
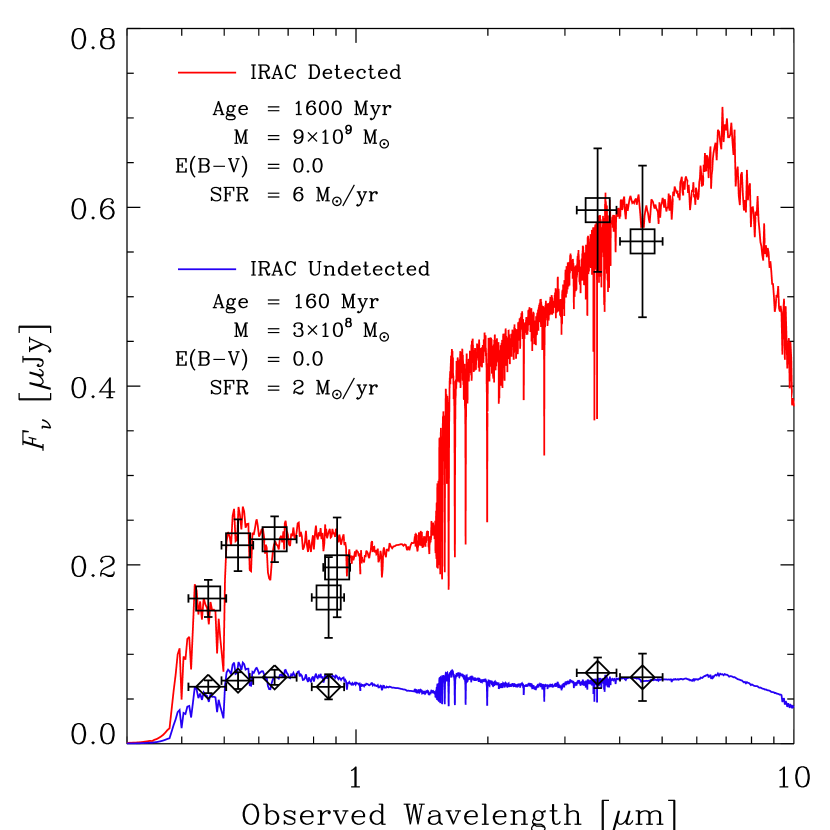
We fit Bruzual & Charlot (2003) stellar population synthesis models with a Salpeter initial mass function to the stacked photometry. The band flux is corrected for the contribution of the Ly emission before the fits. The best-fit model to the IRAC-undetected sample is shown together with the stacked SED in Figure 3. Assuming a constant SFR and solar metallicity, the IRAC-undetected sample is best fitted by a model with , age = Myr, and mass = .
The average mass of the IRAC-undetected LAEs is smaller than that of typical LBGs by more than a factor of 30. The average SFR derived from the best-fit model is 2 yr-1, which is not very large when compared to other populations of galaxies at such as the distant red galaxies (DRGs; Franx et al. 2003) which typically have SFR yr-1 (Förster Schreiber et al., 2004). However, the LAEs have a specific SFR (defined as SFR per unit mass) of yr-1, which is among the highest observed of galaxies at . In comparison, LBGs have specific SFR yr-1 (Shapley et al., 2001) and DRGs have specific SFR yr-1 (Förster Schreiber et al., 2004). This means that the stellar populations in LAEs are increasing in mass at a much faster rate than other populations of galaxies at similar redshifts, suggesting that they are in the early stages of formation.
The IRAC-detected sample appears to be significantly different from the IRAC-undetected sample (Figure 3). Again assuming a constant SFR and solar metallicity, we find that the average stellar population of the IRAC-detected LAEs is best fitted by a model with , age = Gyr, and mass = . Compared to the IRAC-undetected sample, the SFR of the IRAC-detected LAEs is slightly higher at 6 yr-1. The specific SFR, however, is about lower at yr-1, similar to LBGs with comparable stellar population ages (Shapley et al., 2001). We emphasize that although the IRAC-detected and IRAC-undetected samples have distinct properties on average, the individual LAEs exhibit a continuum of properties, as evident in Figure 1 (see also Gronwall et al., 2007). If we include the 5 red objects originally excluded from our conservative IRAC-detected sample (the x-ray detected LAE AGN is still excluded in this analysis), the best-fit age and mass increase slightly to 2.1 Gyr and , respectively.
The best-fit parameters presented above do not depend sensitively on the assumed metallicity. Fitting the data with a 0.2 model increases the best-fit mass and the age of the IRAC-undetected sample by 30% and 60%, respectively, while the effect on the IRAC-detected sample is even smaller at less than 10%. The best-fit parameters also do not depend sensitively on the assumed star formation history. Comparing constant and exponentially declining SFR models with the same metallicity, we find that the two models in general give best-fit masses and ages that are within of each other. This is because the best-fit exponential SFR models have mostly long star formation timescales ( Gyr) and are therefore very similar to a constant SFR model.
At , AGB stars may contribute significantly to the flux in the IRAC bands, which correspond to rest-frame 0.9 - 2 µm. In order to examine how the effects of AGB stars would change our conclusions, we perform alternate fits using Maraston (2005) stellar population synthesis models, which include larger contributions from AGB stars than Bruzual & Charlot (2003) models. Fitting exponentially declining SFR models with solar metallicity, we find for the IRAC-undetected sample a best-fit model with age = 100 Myr, star formation timescale = 250 Myr, , and mass = . For the IRAC-detected sample, the best-fit model has age = 700 Myr, star formation timescale = 2 Gyr, , and mass = . The Maraston models in general give lower mass and age estimates, but despite these differences, the distinction between the IRAC-detected and IRAC-undetected populations remains significant.
4. Discussion
There are several previous studies on the stellar population of LAEs at and beyond (Gawiser et al., 2006a; Finkelstein et al., 2007; Pirzkal et al., 2007; Nilsson et al., 2007). These previous studies found that LAEs have masses ranging from , and ages ranging from Gyr. Our best-fit average age of 160 Myr and mass of for the IRAC-undetected sample are broadly consistent with these previous studies. In a further analysis of the IRAC-undetected sample presented in this paper, Gawiser et al. (2007, submitted) fit two-component models and find that the IRAC-undetected LAEs have a total mass of , with a young stellar component (age Myr) accounting for of the total mass. These results are consistent with ours which are derived using single-component models and should be interpreted as the average properties of the entire stellar population within the LAEs.
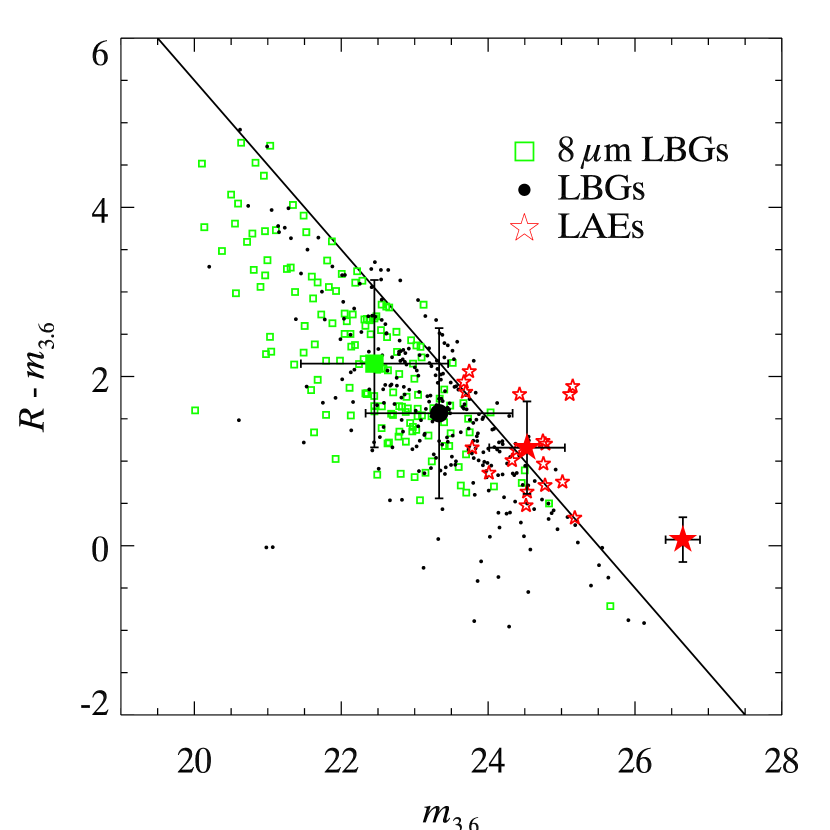
The IRAC-detected LAEs are more luminous than the IRAC-undetected LAEs in both rest-frame UV and near-IR, and represent the massive end of the LAE mass spectrum. Potentially, the IRAC-detected LAEs may provide a link between the LAEs and other galaxy populations. For instance, they may be the analogues to the similarly massive IRAC-detected LAEs found at (Lai et al., 2007). In Figure 4, we compare the colors and 3.6 µm magnitudes of the LAEs to 8 µm detected LBGs and regular LBGs at . The color and 3.6 µm magnitude correlate with stellar mass (Rigopoulou et al., 2006), with the 8 µm LBGs being the most massive ( ), followed by LBGs ( ), IRAC-detected LAEs ( ), and finally IRAC-undetected LAEs ( ). The IRAC-detected LAEs occupy the faint and blue end of the LBG color-magnitude distribution, suggesting that they may be the lower mass extension of the LBG population. This interpretation is supported by the fact that the inferred mass of the IRAC-detected LAEs ( ) is at the low end of the mass range found for LBGs ( ; Papovich et al. 2001; Shapley et al. 2001). Furthermore, most LAEs in the present sample have (observer frame) optical colors that would allow them to be selected as LBGs, although the LAEs tend to be fainter in the rest-frame UV (Gronwall et al., 2007; Gawiser et al., 2006a). It has also been observed that of LBGs at exhibit Ly emission strong enough to be narrow band excess objects (Steidel et al., 2000; Shapley et al., 2003). There is thus accumulating evidence suggesting that the IRAC-detected LAEs may be the bridge connecting the LAE and LBG populations.
Using the stellar mass estimates derived in the previous section and assuming a survey volume of Mpc3 (Gronwall et al., 2007), we find stellar mass densities of and Mpc-3 for the IRAC-undetected and IRAC-detected populations, respectively. The errors in the stellar mass densities include uncertainties in the mass from the fits and uncertainties in the number density coming from Poisson fluctuations and a cosmic variance given the observed LAE bias of (Gawiser et al., 2007, submitted). We should stress that the above stellar mass densities only account for LAEs with Ly luminosities above our survey completeness limit of erg s-1. The IRAC-undetected LAEs account for about of the total stellar mass in LAEs, even though they make up 2/3 of the total by number. Compared to LBGs and DRGs at , which have stellar mass densities of and Mpc-3 respectively (Grazian et al., 2007), the stellar mass contained in LAEs is smaller, but not insignificant. However, it is important to keep in mind that there may be substantial overlap between the LAEs and LBGs. A better understanding of the overlap between these two populations is necessary before a direct comparison of the stellar mass densities can be made.
The present results show that the LAEs posses a wide range of masses and ages, from the massive and evolved IRAC-detected LAEs to the young and small IRAC-undetected LAEs. The range of photometric properties shown in the LAE sample suggests that LAEs exhibit a continuum of properties between these two extremes. The presence of both young and evolved stellar populations within the overall LAE population implies that the Ly luminous phase of galaxies may last Gyr, or that the Ly luminous phase is recurring. Interestingly, Shapley et al. (2001) found that LBGs with best-fit stellar population ages Gyr also show strong Ly emission in their spectra. The authors suggest that vigorous past star formation has destroyed and/or expelled the dust inside the galaxies, allowing the Ly photons to escape. One characteristic of these evolved Ly emitting LBGs is that they tend to have more quiescent SFR than the rest of the population. The IRAC-detected LAEs, with their evolved stellar population and low specific SFR, are consistent with this scenario. If the LAE phase is recurring, then the young age of the IRAC-undetected LAEs implies that their number and stellar mass densities can be as much as a factor higher (very roughly the ratio of the age of the universe to the stellar age). Similarly young stellar populations ( Myr) have also been found at higher redshifts (Finkelstein et al., 2007; Pirzkal et al., 2007; Verma et al., 2007). The stochastic nature of galaxies with short lifetimes suggests that there may be a related population of undetected pre or post-starburst galaxies that may contribute significantly to the stellar mass and star formation rate densities at .
References
- Ando et al. (2006) Ando, M., Ohta, K., Iwata, I., Akiyama, M., Aoki, K., & Tamura, N. 2006, ApJ, 645, L9
- Bruzual & Charlot (2003) Bruzual, G. & Charlot, S. 2003, MNRAS, 344, 1000
- Dawson et al. (2007) Dawson, S., Rhoads, J. E., Malhotra, S., Stern, D., Wang, J., Dey, A., Spinrad, H., & Jannuzi, B. T. 2007, ArXiv e-prints (0707.4182)
- Dickinson et al. (2003) Dickinson, M., Giavalisco, M., & The Goods Team. 2003, in The Mass of Galaxies at Low and High Redshift, ed. R. Bender & A. Renzini, 324–+
- Diolaiti et al. (2000) Diolaiti, E., Bendinelli, O., Bonaccini, D., Close, L., Currie, D., & Parmeggiani, G. 2000, A&AS, 147, 335
- Finkelstein et al. (2007) Finkelstein, S. L., Rhoads, J. E., Malhotra, S., Pirzkal, N., & Wang, J. 2007, ApJ, 660, 1023
- Förster Schreiber et al. (2004) Förster Schreiber, N. M., et al. 2004, ApJ, 616, 40
- Franx et al. (2003) Franx, M., et al. 2003, ApJ, 587, L79
- Gawiser et al. (2007) Gawiser, E., et al. 2007, ArXiv e-prints (0710.2697)
- Gawiser et al. (2006a) Gawiser, E., et al. 2006a, ApJ, 642, L13
- Gawiser et al. (2006b) Gawiser, E., et al. 2006b, ApJS, 162, 1
- Grazian et al. (2007) Grazian, A., et al. 2007, A&A, 465, 393
- Gronwall et al. (2007) Gronwall, C., et al. 2007, ApJ, 667, 79
- Hickox et al. (2007) Hickox, R. C., et al. 2007, ArXiv e-prints (0708.3678)
- Hu et al. (2004) Hu, E. M., Cowie, L. L., Capak, P., McMahon, R. G., Hayashino, T., & Komiyama, Y. 2004, AJ, 127, 563
- Huang et al. (2005) Huang, J.-S., et al. 2005, ApJ, 634, 137
- Lai et al. (2007) Lai, K., Huang, J.-S., Fazio, G., Cowie, L. L., Hu, E. M., & Kakazu, Y. 2007, ApJ, 655, 704
- Malhotra & Rhoads (2004) Malhotra, S. & Rhoads, J. E. 2004, ApJ, 617, L5
- Maraston (2005) Maraston, C. 2005, MNRAS, 362, 799
- Murayama et al. (2007) Murayama, T., et al. 2007, ApJS, 172, 523
- Nilsson et al. (2007) Nilsson, K. K., et al. 2007, A&A, 471, 71
- Ouchi et al. (2007) Ouchi, M., et al. 2007, ArXiv e-prints (0707.3161)
- Papovich et al. (2001) Papovich, C., Dickinson, M., & Ferguson, H. C. 2001, ApJ, 559, 620
- Pentericci et al. (2007) Pentericci, L., Grazian, A., Fontana, A., Salimbeni, S., Santini, P., de Santis, C., Gallozzi, S., & Giallongo, E. 2007, A&A, 471, 433
- Pirzkal et al. (2007) Pirzkal, N., Malhotra, S., Rhoads, J. E., & Xu, C. 2007, ApJ, 667, 49
- Rigopoulou et al. (2006) Rigopoulou, D., et al. 2006, ApJ, 648, 81
- Rix et al. (2004) Rix, H.-W., et al. 2004, ApJS, 152, 163
- Shapley et al. (2001) Shapley, A. E., Steidel, C. C., Adelberger, K. L., Dickinson, M., Giavalisco, M., & Pettini, M. 2001, ApJ, 562, 95
- Shapley et al. (2003) Shapley, A. E., Steidel, C. C., Pettini, M., & Adelberger, K. L. 2003, ApJ, 588, 65
- Shimasaku et al. (2006) Shimasaku, K., et al. 2006, PASJ, 58, 313
- Stanway et al. (2007) Stanway, E. R., et al. 2007, MNRAS, 376, 727
- Steidel et al. (2000) Steidel, C. C., Adelberger, K. L., Shapley, A. E., Pettini, M., Dickinson, M., & Giavalisco, M. 2000, ApJ, 532, 170
- Steidel et al. (2003) —. 2003, ApJ, 592, 728
- Taniguchi et al. (2005) Taniguchi, Y., et al. 2005, PASJ, 57, 165
- Verma et al. (2007) Verma, A., Lehnert, M. D., Förster Schreiber, N. M., Bremer, M. N., & Douglas, L. 2007, MNRAS, 377, 1024