SN 2002cv: A Heavily Obscured Type Ia Supernova
Abstract
We present photometry, and optical and near-infrared spectroscopy, of the heavily extinguished Type Ia supernova (SN) 2002cv, located in NGC 3190, which is also the parent galaxy of the Type Ia SN 2002bo. SN 2002cv, not visible in the blue, has a total visual extinction of mag. In spite of this we were able to obtain the light curves between and +207 days from the maximum in the band, and also to follow the spectral evolution, deriving its key parameters. We found the peak -band brightness to be mag, the maximum absolute magnitude to be , and the parameter specifying the width of the -band light curve to be mag. The latter was derived using the relations between this parameter and and the time interval between the two maxima in the -band light curve. As has been found for previously observed, highly extinguished SNe Ia, a small value of was obtained here for the ratio of the total-to-selective extinction ratio for SN 2002cv, which implies a small mean size for the grains along the line of sight toward us. Since it was found for SN 2002bo a canonical value of 3.1, here we present a clear evidence of different dust properties inside NGC 3190.
keywords:
supernovae: general – supernovae: individual: SN 2002cv – extinction1 Introduction
Type Ia supernovae (SNe Ia) are believed to result from the explosion of white dwarfs when they reach the Chandrasekhar limit after accreting mass from a nearby companion star. The overall homogeneity and the small brightness dispersion at maximum qualify SNe Ia as the most powerful tools for measuring cosmological distances (see Filippenko 2005 for a comprehensive review). Over the last decade, a number of studies have been dedicated to the detailed analysis of light curves of SNe Ia and the determination of the peak magnitudes (e.g., Hamuy et al. 1996a; Riess, Press, & Kirshner 1996; Perlmutter et al. 1997; Phillips et al. 1999; Prieto, Rest & Suntzeff 2006), host-galaxy extinctions (e.g., Krisciunas et al. 2004b; Wang 2005; Krisciunas et al. 2006; Elias-Rosa et al. 2006), statistical analysis of spectral properties (e.g., Benetti et al. 2005; Mazzali et al. 2005; Branch et al. 2006; Hachinger, Mazzali & Benetti 2006; Mazzali et al. 2007), and progenitor and explosion models (Hillebrandt & Niemeyer 2000; Gamezo, Khokhlov & Oran 2005; Röpke et al. 2006, 2007; Nomoto et al. 2007). All these works have been possible only thanks to intensive campaigns of observation and accurate calibration of nearby SNe Ia (e.g., Suntzeff 1996; Krisciunas et al. 2003; Jha et al. 2006; Benetti et al. 2004; Pastorello et al. 2007b).
A crucial factor to be considered in the calibration of SNe is the extinction occurring inside the host galaxy, which is generally derived by measuring the reddening and adopting a standard value for the total-to-selective absorption ratio, =. On the other hand, it is well known that depends on the nature of interstellar dust and varies even with the line of sight inside the Galaxy from 2 to 5.5 (Fitzpatrick, 2004; Geminale & Popowski, 2005) with an average value = 3.1 (Seaton, 1979; Savage & Mathis, 1979). Whereas very little is known for other galaxies, usually it is assumed that the dust has the same average properties as in the Galaxy. In most cases, measurements along the line of sight to the SNe show canonical values of = 3.1 (e.g. SN 1994D - Patat et al. 1996, SN 2002bo - Benetti et al. 2004, SN 2004eo - Pastorello et al. 2007b), but for a few SNe these measurements show evidence for extremely low values of . In particular, the Type Ia SN 1999cl (Krisciunas et al., 2006) was reddened by dust with = 1.55 0.08. For the core-collapse SN 2002hh (Pozzo et al., 2006) a two-component extinction model has been proposed to match coeval spectral templates with = 3.3 mag, = 1.1, and with = 1.7 mag, = 3.1, respectively. For another heavily extinguished SN Ia, SN 2003cg, Elias-Rosa et al. (2006) found = 1.80 0.19 and = 1.33 0.11 mag. Given the dependence of on the dust properties, the dust along the line of sight to these SNe seems to have very small grain size. An alternative explanation calls for the contamination by unresolved light echo from circumstellar dust (Wang, 2005). The growing number of SNe Ia associated with dust clouds with unusual properties is of interest not only in the context of SN calibration, but also for the debate on progenitor scenarios (Patat et al., 2007).
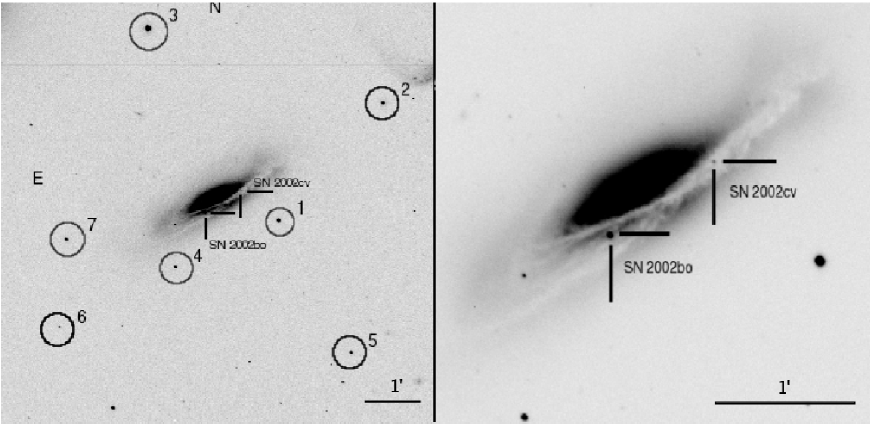
In this paper we discuss the case of SN 2002cv, one of the most obscured SNe ever observed (Di Paola et al., 2002). It was discovered in the spiral galaxy NGC 3190 (heliocentric velocity 1271 km s-1) on 2002 May 13.7 (UT dates are used throughout this paper) by Larionov & Arkharov (2002) during the campaign of monitoring of SN 2002bo, a SN Ia extensively studied by Benetti et al. (2004) and Krisciunas et al. (2004b). The new source was found 18″ W and 10″ N of the galactic nucleus (, J2000.0) projected on the galaxy dust lane (Figure 1). An early optical spectrum (Turatto et al., 2002) showed a very red continuum with almost no signal blueward of 600 nm, which was attributed to very high extinction. Infrared spectra taken at the United Kingdom Infrared Telescope (UKIRT) on May 22.3 and 23.3 (Meikle & Mattila, 2002) suggested that SN 2002cv was a SN Ia similar to the bright SN 1991T (Filippenko, 1997; Filippenko et al., 1992a). This classification was confirmed by Filippenko et al. (2002). Meikle & Mattila (2002) also estimated that the value of toward SN 2002cv actually exceeded 6 mag, the highest extinction ever recorded for a SN Ia.
Here we present a wide set of photometric data obtained worldwide for SN 2002cv along with selected spectroscopic observations. The description of the data reduction and the analysis of the light curves are given in Section 2. Section 3 presents the optical and IR spectra. In Section 4 we discuss the reddening, while in Section 5 we derive the main parameters of the SN using empirical relations both from the literature and derived here. We conclude with a summary of the results (Section 6).
2 Photometry
2.1 Data acquisition and reduction
The fact that another SN Ia, SN 2002bo, exploded in the same galaxy a few months before SN 2002cv, makes available pre-discovery optical and near-infrared (NIR) data and hence templates for photometric measurements via image subtraction. SN 2002cv was observed for seven months, from day to +205.9 relative to -band maximum light. Here we present the data collected by four different teams: University of California, Berkeley (USA), Imperial College (UK), Padova Observatory (INAF, Italy), and Teramo Observatory (INAF, Italy). A total of 9 different instrument configurations was used:
-
1.
1 m Nickel telescope (Lick Observatory, Mt. Hamilton, California, USA), equipped with a SITe thinned CCD ( pixels, 0.28″pix-1, field of view );
-
2.
0.72 m Teramo-Normale Telescope (Terano, Italy), equipped with a TK512CB1-1 CCD ( pixels, 0.46″pix-1, field of view );
-
3.
0.76 m Katzman Automatic Imaging Telescope (Lick Observatory, Mt. Hamilton, California, USA), equipped with a SITe AP7 CCD ( pixels, 0.8″pix-1, field of view );
-
4.
1.82 m Copernico telescope of Mt. Ekar (Asiago, Italy), equipped with AFOSC (thinned TEK CCD, pixels, 0.473″pix-1, field of view );
-
5.
3.6 m ESO/NTT telescope (La Silla, Chile), equipped with EMMI (Tektronix TK1034 CCD, pixels; blue arm 0.37″pix-1, field of view ; red arm 0.167″pix-1, field of view );
-
6.
2.5 m Isaac Newton Telescope (Roque de los Muchachos Observatory, La Palma, Spain), equipped with Wide Field Camera (4 thinned EEV CCDs, 2048 4096 pixels, 0.33″pix-1, field of view );
-
7.
1.0 m Jacob Kapteyn Telescope (Roque de los Muchachos Observatory, La Palma, Spain), equipped with JAG (SITe2 CCD, pixels, 0.33″pix-1, field of view );
-
8.
3.6 m ESO/NTT Telescope (La Silla, Chile), equipped with SofI (NIR HgCdTe Hawaii array, pixels, 0.288″pix-1, field of view );
-
9.
1.08 m AZT-24 telescope (Campo Imperatore, Italy), equipped with SWIRCAM (NIR HgCdTe PICNIC array, pixels, 1.04″pix-1, field of view ).
The photometric observations were processed using IRAF111IRAF is written and supported by the IRAF programming group at the National Optical Astronomy Observatories (NOAO) in Tucson, Arizona, which are operated by the Association of Universities for Research in Astronomy (AURA), Inc. under cooperative agreement with the National Science Foundation. routines with the standard recipe for CCD images (trimming, overscan, bias, and flat-field corrections). For the NIR bands, we also performed sky image subtraction, as well as image coaddition to improve the signal-to-noise ratio (S/N).
In all cases, because of the strong luminosity gradient at the SN position, we made use of the template subtraction technique in order to measure the SN magnitudes (Filippenko et al., 1986). Image subtraction was performed using the ISIS program (Alard, 2000). As reference images (templates) of the host galaxy, we selected those taken about two months before SN 2002cv discovery with the Asiago 1.82 m Copernico telescope + AFOSC on 2002 March 21, and the AZT-24 Telescope + SWIRCAM on 2002 March 28, for the optical and NIR bands, respectively. After geometrical and photometric registration of the two images (target image and template) and the degradation of the image with the best seeing to match the worst one, the template was subtracted from the target image. Hereafter, the instrumental magnitude of the SN was measured with the point-spread function (PSF) fitting technique using the DAOPHOT package on the subtracted image. Reference stars in the SN field (see Figure 1) were also measured using the IRAF PSF fitting routine on the original image.
In order to calibrate the instrumental magnitudes onto a standard photometric system, we used the specific colour-term equations for each of the various instrumental configurations. For the optical bands, these were derived from observations during photometric nights of several standard fields (Landolt, 1992). In turn, the photometric zero-points for non-photometric nights were determined using the magnitudes of the local sequence stars in the SN field (Table 1). For the NIR, because of the small number of standard stars observed each night, we used the average colour terms provided by the telescope teams.
Actually, after the detailed monitoring of SN 2002bo, accurate estimates are available for the magnitudes of a number of local standard stars which are used to calibrate our data (Benetti et al. 2004; Krisciunas et al. 2004b; KAIT observations). The order of the local sequence is that given by Benetti et al. (2004; see their Figure 1 and Table 1) with the addition of star number 7 which corresponds to star number 3 of Krisciunas et al. (2004b; see their Figure 1e and Table 1). For the NIR magnitudes we calibrated two stars of the local sequence during photometric nights. The NIR magnitudes of the single star in common with Krisciunas et al. (2004b) agree to better than 0.02 mag.
We also included the data from Di Paola et al. (2002) (see Section 2.2) obtained using the AZT-24 Telescope of the Campo Imperatore Observatory, equipped with the NIR camera SWIRCAM. These data were re-calibrated against our local sequence, while for a few deviant points a new measurement was necessary.
Whereas standard colour corrections properly bring the magnitudes of normal stars to the standard system, it is known that this does not work well for SNe because of their specific spectral energy distribution (SED). This and the differences between bandpasses cause a significant dispersion of the photometric measurements obtained with different instruments. We note that during the follow-up observations of SN 2002cv, we used seven different instruments for the optical and two for the NIR observations.
The accurate SN calibration procedure, usually called S-correction (Suntzeff 2000; Stritzinger et al. 2002; Krisciunas et al. 2003; Pignata et al. 2004; Pignata 2004b), requires that the SED of the object and the response curve of the instruments used for the observations are both accurately known.
We computed the S-corrections for the bands222We did not compute the S-correction for NIR bands and for the late time optical observations because of the lack of suitable spectra. by using the flux-calibrated spectra of SN 2002cv (Section 3). Since our spectra did not cover all photometric epochs, we completed the spectral database by adding spectra of unreddened normal SNe Ia such as SN 1992A (Suntzeff 1996), SN 1994D (Patat et al. 1996), and SN 1996X (Salvo et al. 2001), properly reddened to match those of SN 2002cv (see Section 4 for more details).
The corrections for SN 2002cv are in general relatively small
( mag), as seen in Figure 2 and Table
2, except for the band of the INT
and JKT, where the corrections are as high as 0.40 mag. These
telescopes use Sloan Gunn and Harris filters, respectively,
which differ significantly from the Bessell ones. The SN
magnitudes, calibrated using this technique, agree fairly well
(Figure 3). Note that the data from TNT and the Lick
Nickel 1 m telescope were not corrected because some of the
required instrumental information was not available. In any case,
the measurements from these instruments appear to be in good
agreement with the S-corrected photometry from other
instruments (see Figure 3).
Uncorrected and S-corrected optical magnitudes are reported in Tables 3 and 4, respectively, and NIR measurements are listed in Table 5. Magnitudes are presented together with their uncertainties, which were computed as the quadrature sum of the following contributions: the square root of the PSF fitting errors on the subtracted images, calibration errors (root-mean square [rms] of the observed magnitudes of the local sequence stars), and errors associated to the S-correction (rms deviation with respect to the low-order polynomial fit over phase).
| star | ||||||
|---|---|---|---|---|---|---|
| 1 | ||||||
| 2 | - | - | - | |||
| 3 | - | - | - | |||
| 4 | ||||||
| 5 | - | - | - | |||
| 6 | - | - | - | |||
| 7 | - | - | - |

| date | JD | Phase* | Instr. | |||
|---|---|---|---|---|---|---|
| 2,400,000.00 | (days) | |||||
| 15/05/02 | 52409.75 | 5.3 | - | 0.061(0.009) | 0.014(0.011) | KAIT |
| 15/05/02 | 52410.40 | 4.7 | - | - | 0.033(0.019) | EKAR |
| 17/05/02 | 52411.75 | 3.3 | - | 0.064(0.009) | - | KAIT |
| 23/05/02 | 52417.75 | 2.7 | - | 0.065(0.009) | 0.016(0.011) | KAIT |
| 27/05/02 | 52421.75 | 6.7 | - | 0.067(0.009) | 0.017(0.011) | KAIT |
| 31/05/02 | 52425.75 | 10.7 | - | 0.069(0.009) | 0.018(0.011) | KAIT |
| 04/06/02 | 52429.75 | 14.7 | - | 0.071(0.009) | 0.020(0.011) | KAIT |
| 06/06/02 | 52431.75 | 16.7 | - | 0.071(0.009) | 0.020(0.011) | KAIT |
| 10/06/02 | 52436.37 | 21.3 | 0.073(0.044) | - | 0.088(0.019) | EKAR |
| 11/06/02 | 52436.75 | 21.7 | - | 0.074(0.009) | 0.022(0.011) | KAIT |
| 14/06/02 | 52440.39 | 25.3 | 0.001(0.017) | 0.084(0.019) | -0.007(0.012) | EMMI |
| 26/06/02 | 52452.40 | 37.3 | 0.013(0.003) | 0.007(0.001) | -0.376(0.053) | INT |
| 27/06/02 | 52453.42 | 38.3 | - | 0.007(0.001) | -0.369(0.053) | INT |
| 29/06/02 | 52455.43 | 40.3 | - | - | 0.411(0.028) | JKT |
| 02/07/02 | 52458.45 | 43.4 | - | 0.057(0.006) | 0.412(0.028) | JKT |
*Relative to (JD = 2,452,415.09).
KAIT = 0.76 m Katzman Automatic Imaging Telescope + CCD, 0.80″pix-1; EKAR = 1.82 m Copernico telescope + AFOSC, 0.47″pix-1; EMMI = 3.6 m ESO NTT + EMMI, 0.167″pix-1; INT = 2.5 m Isaac Newton Telescope + WFC, 0.33″pix-1; JKT = 1.0 m Jacob Kapteyn Telescope + JAG, 0.33″pix-1.

| UT Date | JD | Phase* | Instr. | |||
|---|---|---|---|---|---|---|
| 2,400,000.00 | (days) | |||||
| 14/05/02 | 52408.75 | 6.3 | 19.81(0.18) | - | N1mT | |
| 14/05/02 | 52409.37 | 5.7 | - | 17.23(0.14) | TNT | |
| 15/05/02 | 52409.74 | 5.4 | 19.62(0.27) | 17.45(0.11) | N1mT | |
| 15/05/02 | 52409.75 | 5.3 | - | 19.79(0.26) | 17.48(0.03) | KAIT |
| 15/05/02 | 52410.39 | 4.7 | - | - | 17.18(0.44) | TNT |
| 15/05/02 | 52410.40 | 4.7 | - | - | 17.28(0.04) | EKAR |
| 16/05/02 | 52410.74 | 4.4 | 19.54(0.06) | 16.89(0.11) | N1mT | |
| 16/05/02 | 52411.41 | 3.7 | - | 19.42(0.68) | 16.69(0.18) | TNT |
| 17/05/02 | 52411.75 | 3.3 | - | 19.35(0.09) | - | KAIT |
| 17/05/02 | 52412.38 | 2.7 | - | - | 16.65(0.44) | TNT |
| 20/05/02 | 52415.39 | 0.3 | - | - | 16.67(0.09) | TNT |
| 23/05/02 | 52417.75 | 2.7 | - | 19.30(0.25) | 16.84(0.12) | KAIT |
| 27/05/02 | 52421.75 | 6.7 | - | 19.34(0.18) | 17.04(0.14) | KAIT |
| 28/05/02 | 52423.37 | 8.3 | - | - | 17.25(0.12) | TNT |
| 29/05/02 | 52424.33 | 9.2 | - | - | 17.23(0.10) | TNT |
| 30/05/02 | 52425.36 | 10.3 | - | - | 17.24(0.10) | TNT |
| 31/05/02 | 52425.75 | 10.7 | - | 19.65(0.07) | 17.33(0.30) | KAIT |
| 01/06/02 | 52427.28 | 12.2 | - | - | 17.19(0.07) | TNT |
| 04/06/02 | 52429.75 | 14.7 | - | 20.12(0.16) | 17.31(0.56) | KAIT |
| 06/06/02 | 52431.75 | 16.7 | - | 19.72(0.12) | 17.24(0.46) | KAIT |
| 08/06/02 | 52433.70 | 18.6 | 20.27(0.12) | 17.15(0.14) | N1mT | |
| 10/06/02 | 52436.37 | 21.3 | - | 17.20(0.02) | EKAR | |
| 11/06/02 | 52436.71 | 21.6 | 19.65(0.16) | 17.08(0.10) | N1mT | |
| 11/06/02 | 52436.75 | 21.7 | - | 19.62(0.20) | 17.25(0.24) | KAIT |
| 14/06/02 | 52440.39 | 25.3 | 19.18(0.08) | 17.22(0.02) | EMMI | |
| 26/06/02 | 52452.40 | 37.3 | - | 20.09(0.08) | 18.16(0.05) | INT |
| 27/06/02 | 52453.42 | 38.3 | 20.08(0.11) | 18.33(0.06) | INT | |
| 29/06/02 | 52455.43 | 40.3 | - | - | 17.85(0.30) | JKT |
| 02/07/02 | 52458.45 | 43.4 | - | 20.07(0.23) | 17.82(0.07) | JKT |
| 05/12/02 | 52613.93 | 198.8 | - | N1mT | ||
| 12/12/02 | 52620.98 | 205.9 | N1mT |
*Relative to (JD = 2,452,415.09).
N1mT = 1 m Nickel telescope + CCD, 0.28″pix-1; TNT = 0.72 m Teramo-Normale Telescope + CCD, 0.46″pix-1; KAIT = 0.76 m Katzman Automatic Imaging Telescope + CCD, 0.80″pix-1; EKAR = 1.82 m Copernico telescope + AFOSC, 0.47″pix-1; EMMI = 3.6 m ESO NTT + EMMI, 0.167″pix-1; INT = 2.5 m Isaac Newton Telescope + WFC, 0.33″pix-1; JKT = 1.0 m Jacob Kapteyn Telescope + JAG, 0.33″pix-1.
| UT Date | JD | Phase* | Instr.1 | |||
|---|---|---|---|---|---|---|
| 2,400,000.00 | (days) | |||||
| 14/05/02 | 52408.75 | 6.3 | 19.81(0.18) | - | N1mT | |
| 14/05/02 | 52409.37 | 5.7 | - | 17.23(0.14) | TNT | |
| 15/05/02 | 52409.74 | 5.4 | 19.62(0.06) | 17.45(0.02) | N1mT | |
| 15/05/02 | 52409.75 | 5.3 | - | 19.73(0.12) | 17.49(0.05) | KAIT |
| 15/05/02 | 52410.39 | 4.7 | - | - | 17.18(0.12) | TNT |
| 15/05/02 | 52410.40 | 4.7 | - | - | 17.32(0.04) | EKAR |
| 16/05/02 | 52410.74 | 4.4 | 19.54(0.06) | 16.89(0.03) | N1mT | |
| 16/05/02 | 52411.41 | 3.7 | - | 19.42(0.10) | 16.69(0.02) | TNT |
| 17/05/02 | 52411.75 | 3.3 | - | 19.28(0.09) | - | KAIT |
| 17/05/02 | 52412.38 | 2.7 | - | - | 16.65(0.05) | TNT |
| 20/05/02 | 52415.39 | 0.3 | - | - | 16.67(0.06) | TNT |
| 23/05/02 | 52417.75 | 2.7 | - | 19.24(0.08) | 16.86(0.06) | KAIT |
| 27/05/02 | 52421.75 | 6.7 | - | 19.28(0.12) | 17.06(0.08) | KAIT |
| 28/05/02 | 52423.37 | 8.3 | - | - | 17.25(0.04) | TNT |
| 29/05/02 | 52424.33 | 9.2 | - | - | 17.23(0.04) | TNT |
| 30/05/02 | 52425.36 | 10.3 | - | - | 17.24(0.02) | TNT |
| 31/05/02 | 52425.75 | 10.7 | - | 19.58(0.04) | 17.35(0.04) | KAIT |
| 01/06/02 | 52427.28 | 12.2 | - | - | 17.19(0.02) | TNT |
| 04/06/02 | 52429.75 | 14.7 | - | 20.05(0.16) | 17.33(0.28) | KAIT |
| 06/06/02 | 52431.75 | 16.7 | - | 19.65(0.12) | 17.26(0.23) | KAIT |
| 08/06/02 | 52433.70 | 18.6 | 20.27(0.12) | 17.15(0.03) | N1mT | |
| 10/06/02 | 52436.37 | 21.3 | - | 17.29(0.03) | EKAR | |
| 11/06/02 | 52436.71 | 21.6 | 19.65(0.07) | 17.08(0.03) | N1mT | |
| 11/06/02 | 52436.75 | 21.7 | - | 19.54(0.20) | 17.27(0.12) | KAIT |
| 14/06/02 | 52440.39 | 25.3 | 19.26(0.08) | 17.21(0.02) | EMMI | |
| 26/06/02 | 52452.40 | 37.3 | - | 20.09(0.08) | 17.78(0.07) | INT |
| 27/06/02 | 52453.42 | 38.3 | 20.07(0.03) | 17.96(0.06) | INT | |
| 29/06/02 | 52455.43 | 40.3 | - | - | 18.26(0.04) | JKT |
| 02/07/02 | 52458.45 | 43.4 | - | 20.01(0.23) | 18.24(0.08) | JKT |
| 05/12/02 | 52613.93 | 198.8 | - | N1mT | ||
| 12/12/02 | 52620.98 | 205.9 | N1mT |
*Relative to (JD = 2,452,415.09).
1See note to Table 3 for the telescope coding.
| UT Date | JD | Phase* | Instr. | |||
|---|---|---|---|---|---|---|
| 2,400,000.00 | (days) | |||||
| 09/05/02 | 52404.39 | 10.7 | 17.05(0.11) | - | 16.64(0.11) | AZT |
| 13/05/02 | 52408.35 | 6.7 | 15.46(0.01) | 14.92(0.02) | 14.73(0.05) | AZT |
| 14/05/02 | 52409.35 | 5.7 | 15.26(0.01) | 14.61(0.02) | 14.36(0.03) | AZTDP |
| 15/05/02 | 52410.32 | 4.8 | 15.07(0.02) | 14.56(0.03) | 14.25(0.04) | AZTDP |
| 16/05/02 | 52411.36 | 3.7 | 14.90(0.01) | 14.44(0.02) | 14.21(0.03) | AZT |
| 17/05/02 | 52412.38 | 2.7 | 14.89(0.01) | 14.34(0.01) | - | AZTDP |
| 20/05/02 | 52415.33 | 0.2 | 14.75(0.03) | - | 13.95(0.03) | AZT |
| 26/05/02 | 52421.43 | 6.3 | - | - | 14.06(0.04) | AZT |
| 27/05/02 | 52422.36 | 7.3 | - | - | 14.06(0.05) | AZTDP |
| 28/05/02 | 52423.41 | 8.3 | 15.37(0.04) | - | - | AZT |
| 29/05/02 | 52424.38 | 9.3 | - | 14.74(0.02) | - | AZT |
| 30/05/02 | 52425.36 | 10.3 | - | - | 14.16(0.03) | AZTDP |
| 30/05/02 | 52425.42 | 10.3 | 15.69(0.07) | - | - | AZT |
| 31/05/02 | 52426.41 | 11.3 | 15.80(0.02) | - | - | AZTDP |
| 01/06/02 | 52427.33 | 12.2 | 15.85(0.04) | 14.71(0.03) | 14.41(0.04) | AZTDP |
| 05/06/02 | 52431.36 | 16.3 | 16.87(0.08) | 14.49(0.04) | 14.94(0.07) | AZT |
| 12/06/02 | 52438.35 | 23.3 | 16.33(0.03) | 14.41(0.03) | 14.26(0.04) | AZT |
| 16/06/02 | 52441.53 | 26.4 | 16.04(0.01) | - | 14.17(0.01) | SofI |
| 20/06/02 | 52446.36 | 31.3 | 15.77(0.05) | - | 13.95(0.10) | AZT |
| 04/07/02 | 52460.33 | 45.2 | - | - | 14.40(0.06) | AZT |
| 09/07/02 | 52465.33 | 50.2 | 15.87(0.09) | - | - | AZT |
| 10/07/02 | 52466.33 | 51.2 | - | 15.39(0.10) | - | AZT |
| 11/07/02 | 52467.32 | 52.2 | - | - | 14.89(0.07) | AZT |
| 12/07/02 | 52468.33 | 53.2 | 16.50(0.10) | - | - | AZT |
| 22/07/02 | 52478.30 | 63.2 | - | - | 14.25(0.80) | AZT |
*Relative to (JD = 2,452,415.09).
Photometric night.
AZT = 1.08 m AZT-24 + SWIRCAM, 1.04″pix-1; AZTDP = data from Di Paola et al. (2002) using the same configuration as AZT; SofI = 3.6 m ESO NTT + SofI, 0.29″pix-1.
2.2 Light curves
The early light curves are shown in Figure 4. Since SN 2002cv is not visible in the band, the phase is relative to the epoch of the first -band maximum, which occurred on 2002 May 20.6 (JD = 2,452,415.1 0.2).
The light curves have good sampling from to +64 days after maximum, except in where only upper limits could be measured. SN 2002cv was discovered in the bands about 10.7 days before the maximum, making these measurements among the earliest NIR observations available for a SN Ia.
A secondary maximum in the red and NIR light curves is easily visible, which is typical of SNe Ia and confirms the early classification of SN 2002cv. We remind the reader that no definite classification was assigned to SN 2002cv because of the lack of clear spectral features blueward of 6000 Å. Another typical SN Ia signature is the first maximum occurring before those in and the NIR (e.g., Contardo, Leibundgut & Vacca 2000).
The -band light curve presents a pronounced secondary maximum, which is unusual for a SN Ia. This is probably due to the high reddening suffered by SN 2002cv, which shifts the effective wavelength of the bandpass to the red, mimicking the light curve of an unreddened SN Ia. In fact, we verified that given the SN 2002cv spectrum, the actual effective wavelength shifts from 6550 Å to 7100 Å, which leads to a difference in magnitude up to 0.3, mainly visible at the phase of the secondary maximum. This effect is negligible in the bands.
We note also that the post-maximum decline of the light curve is much steeper than that in the band, showing a pronounced minimum around day +16. On the other hand, a shallow minimum occurs a few days earlier than those in and . All these features, except the broad peak, are typical of SNe Ia (Meikle, 2000).
For comparison, in Figure 5 we plot the light
curves of three nearby SNe Ia (see Section 5 for
more information) having different values of : SN 1991T
( = 0.94 mag), SN 1991bg ( = 1.94 mag), and SN 1992A
( = 1.47 mag). The light
curves have been shifted to match the first maximum. The light
curve of SN 2002cv is best matched by that of SN 1992A even if in
the former the first maximum is slightly narrower. Assuming that
the two SNe were also similar in the band, we can assign
tentatively to SN 2002cv a value 1.5 mag. We
obtain a better estimate of in Section 5.3.


2.3 Colour and pseudo bolometric curves
In Figure 6 the evolution of the intrinsic (-NIR) colours for SN 2002cv (corrected for the reddening as discussed in Section 4) are compared with those of a sample of SNe Ia. The colour curves are in general very similar to those of normal SNe Ia such as SN 2001cz (Krisciunas et al., 2004b) or SN 2001el (Krisciunas et al., 2003), but with some differences in .
The good match of the SN 2002cv colour curve with those of other normal SNe Ia is another confirmation of the Type Ia classification of this SN. This is strengthened by the comparison presented in Figure 7, in which the curve of SN 2002cv is compared with those of different types of SNe: SN 2001el (Type Ia, Krisciunas et al. 2003), SN 2004aw (Type Ic, Taubenberger et al. 2006), and SN 2005cs (Type IIP, Pastorello et al. 2006; Pastorello et al. 2007c). During the pre-maximum period all curves have similar colours, but thereafter the three SN types follow different patterns, with SN 2002cv turning to the blue, as did SN Ia 2001el.
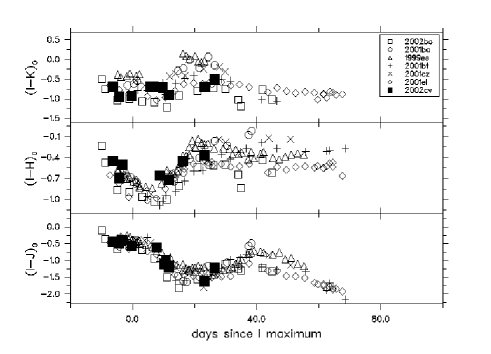
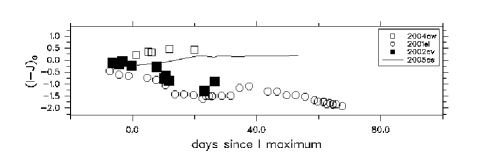
Figure 8 shows the “pseudo-bolometric” luminosity evolution of SN 2002cv derived by integrating the flux in the 333We have checked that changing the effective wavelength of the band in the calculation of the bolometric light curve results in differences of 0.1 dex in the luminosity. This was taken into account in the error estimate. bands (with the distance modulus and reddening discussed in Section 4). Total uncertainties were computed taking into account photometry errors, and the uncertainties in reddening and distance. We have also plotted the pseudo-bolometric light curves for SN 2002bo and SN 2004eo. The reddening-corrected bolometric luminosity at maximum is log () = 42.54 0.30 (erg s-1). While the first maximum of SN 2002cv is fainter and narrower than those of the other SNe Ia, its secondary maximum is bright and broad, similar to that of SN 2004eo. This is not unexpected, since an overall similarity between SN 2004eo and SN 1992A was noted by Pastorello et al. (2007b).
It is well known that for SNe Ia around maximum, most of the flux is
emitted in the bands. From the photometry of other SNe Ia,
we can estimate that the integrated flux carried by the
bands is approximately 40% (with a variation around 10%) of the
integrated “uvoir” flux from the through bands
(see also Figure 6 of Contardo, Leibundgut & Vacca 2000). Therefore, we estimate
that the total uvoir luminosity at maximum of SN 2002cv was
log = 42.94 0.60 (erg s-1).
Considering that in general, the maximum occurs approximately three days after the maximum, we can derive the epoch of the secondary maximum relative to maximum and read the 56Ni mass from Figure 11 of Kasen (2006). In that work, the prominence and timing of the and secondary maxima were measured and plotted vs. MNi for and -band models. Kasen (2006) also computed the 56Ni mass of their models considering the absolute maximum and the deep minimum in the band (Figure 10 of Kasen 2006) and reproduced synthetic model light curves by varying the mass of 56Ni. These models suggest that SN 2002cv has (56Ni) 0.45 M⊙. This is in good agreement with the 56Ni mass derived from the total uvoir luminosity of SN 2002cv at maximum, the Arnett rule (Arnett, 1982; Stritzinger & Leibundgut, 2005), and a rise time of 19 days, which gives an estimate of the 56Ni mass (56Ni) = 0.44 0.07 M⊙. This is also remarkably similar to the 56Ni mass derived by Pastorello et al. (2007b) for SN 2004eo (0.45 M⊙).

3 Spectroscopy
3.1 Data reduction
The spectroscopic observations are summarised in Table 6 and the instruments used are as follows:
-
1.
1.82 m Copernico telescope of Mt. Ekar (Asiago, Italy), equipped with AFOSC (see Section 2.1). Grism#2 (wavelength region 5250–10,300 Å, dispersion 15.67 Å pix-1, and resolution 38 Å with the 2.1″slit) was used;
-
2.
3 m Shane reflector (Lick Observatory, Mt. Hamilton, California, USA), equipped with Kast (double spectrograph with simultaneous red/blue spectra, wavelength range 3300–10,400 Å);
-
3.
3.6 m ESO/NTT telescope (La Silla, Chile), equipped with EMMI (see Section 2.1). For low-dispersion spectroscopy, grism#2 (wavelength range 3800–9700 Å, dispersion 1.74 Å pix-1) was used;
-
4.
3.8 m United Kingdom Infrared Telescope (Mauna Kea, Hawaii, USA), equipped with CGS4 (Cooled Grating Spectrometer Mk 4, 1.22 ″pix-1). The 40 line mm-1 grating and the filters (wavelength range 8250–25,100 Å) were used;
-
5.
3.6 m ESO/NTT telescope (La Silla, Chile), equipped with SofI (see Section 2.1). The grism GBF (wavelength range 9450-16,520 Å, dispersion 6.96 Å pix-1, and resolution 30 Å) was used.
The spectra were reduced using IRAF and FIGARO (for NIR data) routines. The pre-processing of the spectroscopic data (trimming, bias, overscan, and flat-field correction) were the same as for the imaging. For the NIR spectra, before extraction, the contribution of the night-sky lines was removed from the two-dimensional NIR spectrum, subtracting another two-dimensional spectrum with the target placed in a different position along the slit. The one-dimensional spectra were wavelength calibrated by comparison with arc-lamp spectra obtained during the same night and with the same instrumental configuration, and flux calibrated using spectrophotometric standard stars. The zero-point of the wavelength calibration was verified against the bright night-sky emission lines. The standard-star spectra were also used to model and remove the telluric absorption. The absolute flux calibration of the spectra was checked against the photometry and when necessary, the spectra were re-scaled. After that, the typical deviation from photometry is less than 10% in all bands.
| UT Date | JD | Phase* | Grism/Grating | Range | Instr. |
|---|---|---|---|---|---|
| 2,400,000.00 | (days) | (Å) | |||
| 15/05/02 | 52410.42 | 4.7 | gm2 | 5250–10,300 | Ekar |
| 19/05/02 | 52413.77 | 1.3 | 3300–10,400 | Shane | |
| 08/06/02 | 52433.75 | +18.7 | 3300–10,400 | Shane | |
| 15/06/02 | 52440.52 | +25.4 | gm2 | 3900–9700 | EMMI |
| UT Date | JD | Phase* | Grism/Grating | Range | Instr. |
| 2,400,000.00 | (days) | (Å) | |||
| 22/05/02 | 52417.25 | +2.2 | gmij | 8250–13,500 | UKIRT |
| 23/05/02 | 52418.25 | +3.2 | gmk | 19800–25,100 | UKIRT |
| 15/06/02 | 52441.49 | +26.4 | gmB | 9450–16,512 | SofI |
*Relative to (JD = 2,452,415.09).
grating 300/7500 + grism 600/4310.
Ekar = 1.82 m Copernico Telescope + AFOSC; Shane = 3 m Shane reflector + Kast dual spectrograph; EMMI = 3.6 m ESO NTT + EMMI; UKIRT = 3.8 m United Kingdom Infrared Telescope + CGS4; SofI = 3.6 m ESO NTT + SofI.
3.2 Optical and NIR spectra
SN 2002cv was a faint target, especially in the optical: we were
able to secure only four spectra in the optical
and three in the NIR (Table 6).
The sequence of optical spectra of SN 2002cv is shown in Figure 9. The spectra are distributed from days to +25.4 days relative to the -band maximum. Spectra are truncated below 5000 Å because at shorter wavelengths no significant signal from the SN was detected. The most notable feature of the optical spectra is the very red continuum, with almost no sign of individual lines except for the Ca ii NIR triplet ( 8500 Å), which is clearly seen two weeks after maximum. In the last spectra there might also be evidence of the Si ii absorption at 6350 Å.

The NIR spectra of SN 2002cv are shown in Figure 10. The spectral evolution is typical of SNe Ia. The earliest two spectra are dominated by the continuum. The spectrum at phase +2.2 days shows a weak feature with P-Cygni profile at about 10,900 Å (rest wavelength) possibly due to Mg ii (Wheeler et al., 1998). Weak emission is also visible at 20,500 Å on day +3.2, perhaps due to Co ii lines (Marion et al., 2003). In the +26.4 day spectrum, several individual broad features are remarkably strong. In particular a prominent absorption at 12,300 Å (Marion et al., 2003) is attributed to Fe ii. At about 15,000 Å, SN 2002cv shows the rapid flux turnover also observed in other SNe Ia. According to Wheeler et al. (1998) and Marion et al. (2003), this occurs because the region between 11,000 and 15,000 Å has fewer blends of iron-group lines compared to adjacent wavelengths.

Figure 11 shows the combined, nearly coeval optical and NIR spectra of SN 2002cv (NTT+EMMI at +25.4 days and NTT+SofI at phase +26.4 days) compared with similar-age spectra of SN 2004eo (SN Ia, Pastorello et al. 2007b), SN 2004aw (SN Ic, Taubenberger et al. 2006), and SN 1999em444The SN 1999em spectra were downloaded from SUSPECT (The Online Supernova Spectrum Archive): http://bruford.nhn.ou.edu/ suspect/index1.html . (SN IIP, Hamuy et al. 2001; Leonard et al. 2002). This comparison definitely confirms that SN 2002cv is a SN Ia (see, in particular, the overall similarity to SN 2004eo). Moreover, the pronounced P-Cygni profile of H and P of SNe II (SN 1999em, 6562.8 Å and 12,818 Å), and the He i and C i around 10,830 Å of SNe Ic (SN 2004aw), are not present in SN 2002cv.

4 The Reddening Estimate
We mentioned in the introduction that extinction can be the dominant source of error in the spectrophotometric calibration of SNe Ia. This is especially true for SN 2002cv because of the very high extinction.
Di Paola et al. (2002) derived an estimate of the extinction of SN 2002cv after assuming typical , , and absolute magnitudes for SNe Ia, as follows:
| (1) |
Using a standard extinction law, these NIR estimates were converted to an average = 7.90 0.90 mag. However, we found that using this approach for different bands gives values of which are inconsistent, with progressively lower values moving from red to blue bands. As in other similar cases (e.g., Krisciunas et al. 2006, Elias-Rosa et al. 2006), the simplest explanation is that has a value smaller than the standard 3.1.
To derive consistent estimates of both and , we adopt three different procedures, all based on the comparison of the SED and the luminosity of SN 2002cv with those of other standard SNe Ia.
-
1.
We performed a simultaneous match of the , , and colour curves of SN 2002cv with those of other normal SNe Ia (Figure 6). As in the case of SN 2003cg (Elias-Rosa et al., 2006), it turns out that the best fit requires a value of smaller than the canonical one. The best match is for = 8.99 0.30 mag and = 1.97 0.30.
It is interesting to apply the same methods to SN 2002bo, which exploded in the same host galaxy as SN 2002cv. In this case we can make use of more colours, namely , , , , , and . Matching the colours of SN 2002bo to those of normal SNe Ia (Figure 12) gives a best fit of = 1.50 0.30 mag and = 2.99 0.30. This dust-extinction law is consistent with the average one in the Galaxy. However, we note in Figure 12 that the -NIR colour curves of SN 2002bo do not fit those of normal SNe Ia well. This was already noted by Krisciunas et al. (2004a) and attributed to a real peculiarity in the SED of this SN.
Since is related to the grain size, the different extinction laws found for SN 2002bo and SN 2002cv show that in NGC 3190, dust having different average properties coexists. This is an important fact but at the same time not surprising, since in the Galaxy we also observe regions with very different values of (Fitzpatrick, 2004; Geminale & Popowski, 2005).
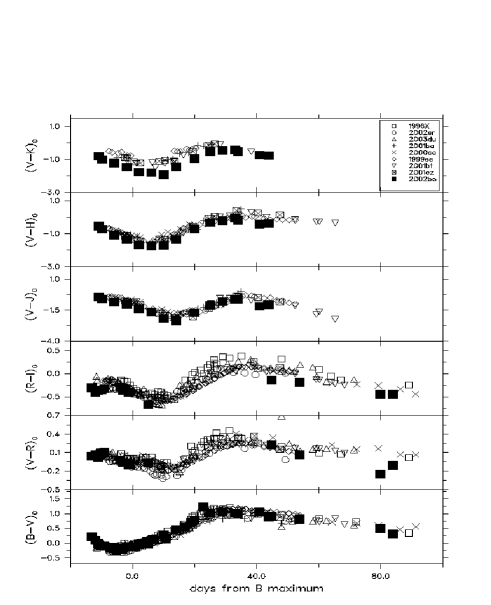
Figure 12: As in Figure 6 for SN 2002bo. The best match of the curves is obtained for = 1.50 0.30 mag and = 2.99 0.30. -
2.
The observed extinction curve is derived by comparing the observed optical ( Å) and NIR SED of SN 2002cv with those of unreddened SNe Ia, at similar epochs. The spectra used for this comparison were previously corrected for redshift and Galactic reddening, and scaled to the distance of SN 2002cv (an example is shown in Figure 13). This method was applied by Elias-Rosa et al. (2006) to derive the extinction law to SN 2003cg.
We used as templates the spectra of SN 1992A, SN 1994D, SN 1996X, and SN 2004eo (see Section 5 for more details about these SNe), comparing a total of twelve pairs of spectra at different epochs and obtaining in each case an estimate of and . The average values are = 8.17 0.57 mag and = 1.52 0.11.

Figure 13: Best fit of the observed extinction law () with the theoretical CCM laws (dashed line). In the example, the extinction curve of SN 2002cv was obtained by dividing the spectrum of SN 2002cv on day +26 by that of SN 2004eo from 6000 to 12,500 Å. For comparison, we also plot the CCM extinction curve for = 3.1 (dotted line). From the average of 12 comparisons using 4 different SNe as templates (see the text for more information), we obtained = 8.17 0.57 mag and = 1.52 0.11. -
3.
Exploiting the fact that SN 2002bo exploded in the same galaxy as SN 2002cv, we performed a multi-dimensional maximum-likelihood estimate555The maximum-likelihood method is the procedure of finding the value of one or more parameters for a given statistic which makes the known likelihood distribution a maximum (Myung, 2003). to find the values of , , and that give the best match to the measurements in columns 3 and 5 of Table 7 according to the relation
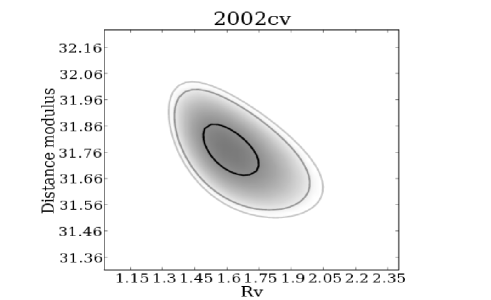
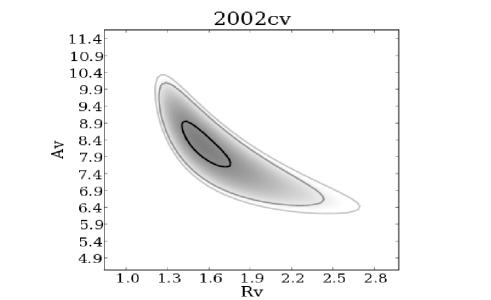
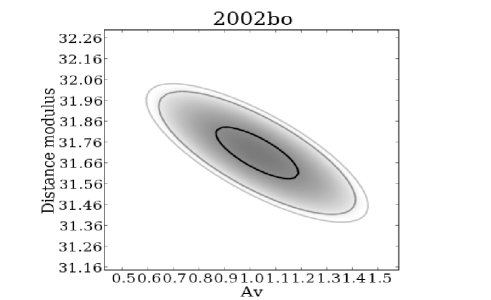
(2) where and are wavelength-dependent coefficients given by CCM. Here we remind the reader of the shift in the effective wavelength due to the high extinction of SN 2002cv (see Section 2.2). This effect is smaller at maximum light than in the later phases, and hence we included the -band measurements in our fit (Table 7). For a simultaneous fit to the data of the two SNe, the free parameters are , , , , and = = .
Actually, following the results of method (i), we fixed for SN 2002bo a standard value = 3.1. Also, due to the different -NIR colour curves of SN 2002bo (see Krisciunas et al. 2004a and method (i)), we did not include the NIR bands of this SN in our fit.
Figure 14 shows the , , and confidence levels projected in the planes of selected parameter pairs. The uncertainty in and can be read from the 1 contour. The maximum-likelihood test gives the following results: = 8.40 0.35 mag, = 1.60 0.10 for SN 2002cv, = 1.00 0.10 mag for SN 2002bo, and a distance modulus of = 31.76 0.07 mag for NGC 3190.
| Filter | 1 | 2 | 3 | 4 | |
|---|---|---|---|---|---|
| – | – | 0.102 | |||
| – | – | 0.078 | |||
| 0.063 | |||||
| 0.046 | |||||
| – | – | 0.022 | |||
| – | – | 0.015 | |||
| – | – | 0.009 |
1Observed magnitudes at maximum of SN 2002cv for each band (see Section 5.3).
2Adopted absolute magnitudes of SN 2002cv. For and see 5.3; for , , and we used the mean absolute magnitudes given by Krisciunas et al. (2004b).
3Observed magnitudes at maximum of SN 2002bo (Benetti et al., 2004).
4Adopted absolute magnitudes of SN 2002bo (Prieto, Rest & Suntzeff, 2006).
We note that the value of found here is in excellent
agreement with = 31.77 mag, the distance modulus derived using
the relative distance of NGC 3190 from the Virgo cluster (1.48 mag,
Kraan-Korteweg 1986), and assuming a Virgo cluster distance of 15.3 Mpc
(Freedman et al., 2001). An alternative estimate of the distance is
obtained considering that NGC 3190 is a member of the Leo III
group (García, 1993); the surface brightness fluctuation
(Tonry et al., 2001a) distance of another possible member of the
group, NGC 3226, is = 31.86 0.24 mag (Krisciunas et al., 2004b).
This is also in good agreement with our estimate above, which we
hereafter adopt.
In summary, the and estimates obtained with the three different procedures are listed in Table 8. The weighted averages of these values are = 8.66 0.21 mag and = 1.59 0.07.
Including the Galactic extinction component, Gal = 0.025 mag
(Schlegel, Finkbeiner & Davis, 1998), the total extinction suffered by SN 2002cv is
tot = 8.74 0.21 mag, making SN 2002cv one of the most
highly extinguished SNe Ia ever observed.
| Method | (mag) | |
|---|---|---|
| Colour Evolution | ||
| Comp-CCM | ||
| Multi-dimensional |
With regard to the extinction law, we stress that all three methods give a low value of . The small value of obtained for this source, which is deeply embedded in a dust lane, appears consistent with the scenario proposed by Goudfrooij et al. (1994) and Patil et al. (2007), who suggest that the observed dust-grain size in the host-galaxy dust lanes may be altered by different mechanisms, such as destruction of grains due to sputtering in supernova blast waves, grain-grain collisions, or sputtering by warm and hot thermal ions (Goudfrooij et al., 1994). A possible different mechanism for producing small dust grains is erosion by the SN radiation field (Whittet, 1992). In this case, the dust must be located close to the SN, possibly even originating in the progenitor evolution.
We should mention, however the alternative explanation for the small apparent value of proposed by Wang (2005), which invokes the effect of a light echo from circumstellar dust. In this scenario, the physical properties of the dust are much less important than its distribution in the immediate neighborhood of SNe Ia.
In conclusion, SNe Ia can be a very useful tool for studying the properties of dust in distant galaxies.
5 Photometric parameters
The parameters characterizing the photometric behaviour of SNe Ia are usually derived from and light curves. For SN 2002cv, the and bands are heavily extinguished and no measurements were obtained (we measured only upper limits in the band). Hence, to characterize this SN with respect to other events we will seek general correlations between blue to red light-curve parameters of SNe Ia.
5.1 decline rates vs.
Hamuy et al. (1996c), using a sample of seven SNe Ia, showed a strong correlation between and other light-curve parameters, namely (B), (V), (V), and (I). They also found that for the band, the time interval between the minimum and the secondary maximum is greater for the slowly declining SNe Ia.
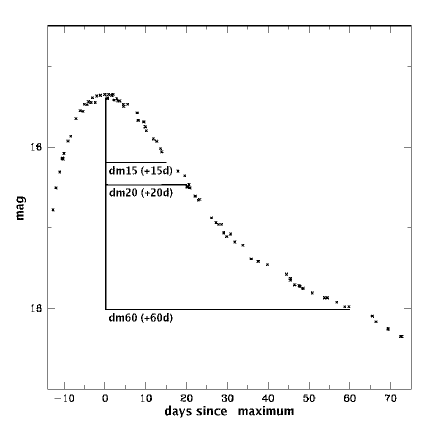
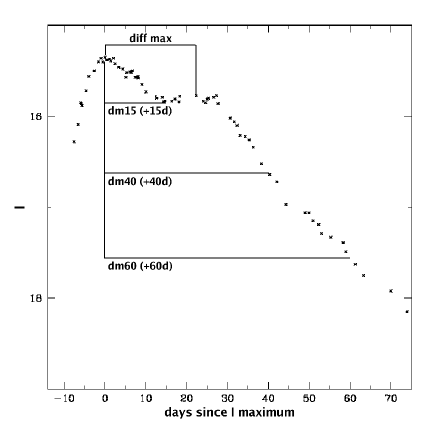
Here, we extend the statistics of Hamuy et al. (1996c) to a sample of 20 SNe Ia (Table 9) spanning a range in between 0.90 and 1.94 mag. For each SN we obtained the epoch and magnitude of the maximum light in the , , and bands, and measured the decay in the first 15, 20, 40, and 60 days after maximum in each band. See Figure 15 for a graphical description of these parameters.
We note that the decline rates presented here are not corrected for extinction. Phillips et al. (1999) showed that has a weak dependence on reddening. To check if a similar correction was required in the other bands, we measured , the decline rates in other bands, as well as using the spectrophotometry of three SNe Ia (SN 1994D, SN 1996X, and SN 2004eo). The measurements were performed for (a) the unreddened spectra and (b) the spectra reddened by the Galactic and host-galaxy extinction with the laws found for SN 2002cv (see Section 4). We confirm the correction for given by Phillips et al. (1999), but the corrections for the -band parameters turned out to be negligible.
Figure 16 (bottom) shows the decline rates of the , , and light curves versus . The correlations between the different decline rates with are similar to those found by Hamuy et al. (1996c).
The behaviour of the -band decline rates (Figure 16, middle) is different according to the different intervals considered. While there are no correlations between and or except for rapidly declining SNe (SN 1991bg), we find a stronger correlation with . This behaviour of the decline rates is probably due to the change of opacity and concentration of iron-peak elements in the central regions during these first days (Kasen, 2006), which produce the secondary maximum. According to this model, a SN Ia with homogeneous abundance distribution shows red light curves in which the first and second maxima are indistinguishable. This could be the case for SN 1991bg, which has no secondary maximum and exhibits fast decline in the band and in redder bands.
In Figure 16 (top) we also compare the parameters measured for the -band light curve with . While it appears that remains constant, there is a clear correlation between and and .

In the band, the secondary maxima are very pronounced, as well as in the , , and light curves. The strength and phase of the secondary maximum is found to correlate with , being more prominent and delayed in luminous SNe Ia (Hamuy et al., 1996c; Nobili et al., 2005). We measured the magnitude difference and time interval between the primary and secondary peaks in the -band light curve for the SNe of our sample (see Figure 15), and compared them with . Note that SNe with 1.8 mag, similar to SN 1991bg, are not included in the diagram because their light curves do not show a secondary maximum.
While shows no clear correlation with
(Figure 17, bottom), the correlation between
and is tight (Figure 17, top), with
the phase delay of the secondary maximum being longer for
slowly declining SNe Ia.

5.2 -band magnitudes and

It is well known that the early-time decline rate in the -band light curve of SNe Ia correlates with the luminosity. Since the band is not available for SN 2002cv, we are forced to find alternative indicators to establish the photometric subclass of this SN. In Figure 5 we have already shown that the light-curve shapes of SNe 2002cv and 1992A were similar, so it is likely that they have similar mag.
In order to obtain a more accurate estimate of , we exploit the previously derived correlations with (SN 2002cv was observed until +44.2 days after maximum) and . Using the code developed by Akritas & Bershady (1996) for linear regression analysis, we performed a linear fit to the points in Figures 16 (top) and 17 (top), obtaining (respectively)
| (3) |
and
| (4) |
For equation 3, we used 16 SNe Ia and the Pearson
correlation coefficient is ; for equation
4, we used 18 SNe Ia and the Pearson correlation
coefficient is 0.93666In the fit of vs. we
excluded SN 1991T which appears to deviate (as in
Hamuy et al. 1996c). Indeed, SN 1991T was an abnormal object with a
number of pre-maximum spectroscopic peculiarities
(Filippenko et al., 1992a; Phillips et al., 1992).
Since is related to the luminosity of SNe Ia, we could expect a similar relation between and , the absolute magnitude of the first maximum, and also between and . Figure 18 confirms this expectation, though in both cases the dispersion is high mainly due to the uncertainties in the distance moduli used for computing .
The linear fits give
| (5) |
and
| (6) |
For the two relations 15 and 18 SNe Ia were used, and the
correlation coefficients are 0.57 and 0.73, respectively.
| SN | JD() | sources | ||||||
|---|---|---|---|---|---|---|---|---|
| 2,400,000.00 | ||||||||
| SN 1992bc | 0.90(0.05) | 48910.84(0.50) | 15.56(0.05) | 0.98(0.06) | 33.13(1.13) | 34.56 | 0.04 | 0,1,2,3 |
| SN 1991T | 0.94(0.05) | 48371.60(0.50) | 11.62(0.04) | 0.69(0.01) | 27.75(0.51) | 30.74 | 0.33 | 0,1,2,4,5,6,7 |
| SN 2003du | 1.02(0.05) | 52764.92(0.50) | 13.83(0.02) | 0.97(0.03) | 29.78(0.71) | 32.42 | 0.01 | 0,1,8 |
| SN 1990N | 1.05(0.05) | 48080.70(0.50) | 12.95(0.02) | – | 28.86(1.05) | 31.07 | 0.10 | 0,1,2,6 |
| SN 1992al | 1.09(0.05) | 48836.86(0.50) | 14.93(0.04) | 1.02(0.02) | 27.50(0.71) | 33.82 | 0.05 | 0,1,2,3 |
| SN 2005cf | 1.11(0.03) | 53532.00(0.50) | 13.70(0.03) | 0.96(0.03) | 29.60(0.55) | 32.19 | 0.14 | 0,1,9 |
| SN 2003cg | 1.12(0.05) | 52728.22(0.50) | 13.82(0.04) | 1.13(0.04) | 28.08(0.71) | 31.61 | 1.14 | 0,1,10 |
| SN 2001el | 1.13(0.05) | 52181.43(1.00) | 12.81(0.04) | 0.97(0.04) | 27.26(1.01) | 31.29 | 0.27 | 0,1,2,11 |
| SN 2002bo | 1.17(0.05) | 52355.50(1.00) | 13.49(0.10) | 0.98(0.10) | 27.94(1.00) | 31.77 | 0.56 | 0,1,12,13 |
| SN 1995E | 1.19(0.05) | 49771.00(0.50) | 15.33(0.05) | 1.01(0.05) | – | 33.43 | 1.01 | 0,1,2,14 |
| SN 1998dh | 1.23(0.17) | 51029.32(0.50) | 14.10(0.05) | 1.21(0.05) | 27.50(0.69) | 32.92 | 0.31 | 0,1,2,15 |
| SN 1994D | 1.31(0.05) | 49428.50(1.00) | 12.11(0.05) | 1.31(0.06) | 25.02(1.01) | 31.14 | 0.04 | 0,1,16,17,18,19 |
| SN 1996X | 1.32(0.05) | 50188.00(1.00) | 13.39(0.01) | 1.10(0.02) | 27.71(1.05) | 32.17 | 0.10 | 0,1,14,20 |
| SN 2002er | 1.33(0.04) | 52523.56(0.50) | 14.49(0.05) | 1.40(0.09) | 26.14(0.71) | 32.90 | 0.53 | 0,1,21 |
| SN 1997E | 1.39(0.06) | 50466.19(0.50) | 15.46(0.05) | 1.44(0.07) | 22.78(1.41) | 33.72 | 0.28 | 0,1,2,15 |
| SN 2004eo | 1.45(0.04) | 53276.30(1.00) | 15.36(0.04) | 1.26(0.04) | 24.13(1.03) | 34.12 | 0.21 | 0,1,22 |
| SN 1992A | 1.47(0.05) | 48638.00(0.50) | 12.80(0.04) | 1.46(0.05) | 22.08(0.56) | 31.41 | 0.09 | 0,1,2,7,23 |
| SN 2000cn | 1.58(0.12) | 51706.93(0.50) | 16.63(0.05) | – | – | 34.93 | 0.16 | 0,1,2,15 |
| SN 1992bo | 1.69(0.05) | 48984.94(0.50) | 15.95(0.05) | 1.68(0.05) | 20.00(0.71) | 34.28 | 0.08 | 0,1,2,3 |
| SN 1991bg | 1.94(0.05) | 48608.60(1.00) | 13.51(0.05) | 2.42(0.05) | – | 31.32 | 0.06 | 0,1,2,24,25,26,27 |
0 = This work; 1 = LEDA; 2 = Reindl et al. (2005); 3 = Hamuy et al. (1996b); 4 = Schmidt et al. (1994); 5 = Cappellaro et al. (1997); 6 = Lira et al. (1998); 7 = Altavilla et al. (2004); 8 = Stanishev et al. (2007); 9 = Pastorello et al. (2007a); 10 = Elias-Rosa et al. (2006); 11 = Krisciunas et al. (2003); 12 = Benetti et al. (2004); 13 = Krisciunas et al. (2004a); 14 = Riess et al. (1999); 15 = Jha et al. (2006); 16 = Richmond et al. (2005); 17 = Tsvetkov & Pavlyuk (1995); 18 = Patat et al. (1996); 19 = Meikle et al. (1996); 20 = Salvo et al. (2001); 21 = Pignata et al. (2004); 22 = Pastorello et al. (2007b); 23 = Suntzeff (1996); 24 = Filippenko et al. (1992b); 25 = Leibundgut et al. (1993); 26 = Turatto et al. (1996); 27 = Tonry et al. (2001b); ∗ + ; † = 0.18 mag, with = 2.88; ‡ average from different sources.
| Host-Galaxy Data | NGC 3190 | Ref. |
| (2000) | 1 | |
| (2000) | 1 | |
| Galaxy type | SA(s)a pec | 1 |
| B magnitude | 12.12 | 1 |
| Gal | 0.025 | 2 |
| (km s-1)∗ | 1271 | 1 |
| 31.76 0.07 | 3 | |
| SN Data | SN 2002cv | Ref. |
| (2000) | 4 | |
| (2000) | 4 | |
| Offset SN-Gal. nucleus | 4 | |
| Discovery date (UT) | 2002 May 13.7 | 4 |
| Discovery date (JD) | 2452408.20 | 4 |
| host | 5.45 0.28 | 3 |
| host | 1.59 0.07 | 3 |
| tot | 8.74 0.21 | 3 |
| Date of max (JD) | 2,452,415.09 0.22 | 3 |
| Magnitude and epoch | ; +5.8 (days) | 3 |
| at max wrt max | = 19.08 0.20; +3.2 (days) | 3 |
| = 16.57 0.10; 0.0 (days) | 3 | |
| = 14.75 0.03; -0.4 (days) | 3 | |
| = 14.34 0.01; -2.0 (days) | 3 | |
| = 13.91 0.04; +1.6 (days) | 3 | |
| Magnitude and epoch | = 17.11 0.10; +23.1 (days) | 3 |
| of secondary | = 15.24 0.19; +41.5 (days) | 3 |
| max wrt max | = 14.40 0.11; +25.9 (days) | 3 |
| = 13.88 0.29; +35.2 (days) | 3 | |
| Estimated | 1.46 0.17 | 3 |
| Absolute magnitude | 3 | |
| (derived from the distance) | 3 | |
| 3 | ||
| 3 | ||
| 3 | ||
| log () | 42.54 0.30 (erg s-1) | 3 |
| log | 42.94 0.60 (erg s-1) | 3 |
| M(56Ni) | 0.44 (M⊙) | 3 |
∗Heliocentric radial velocity.
5.3 Main photometric parameters of SN 2002cv
The maximum-light epochs and magnitudes for the different bands, reported in Table 10, were derived by fitting low-order polynomials (lower than 5 deg) to the light curves. The first maximum is found on JD() = 2,452,415.09 0.22 (May 20.6, 2002 UT) with mag. The -band secondary maximum occurred = 23.06 0.59 days later, with magnitude 17.11 0.10. We also measured mag.
Using equations 3 and 4, we derived an average value = 1.46 0.17, indeed very close to that of SN 1992A and SN 2004eo.
Hereafter, from the measured and , and equations 5 and 6, we derive an estimate of the intrinsic absolute magnitude at maximum for SN 2002cv. The values obtained are mag and (respectively), with a weighted average value of mag. This magnitude is close to the average value for SNe Ia found by Saha et al. (1999): mag (scaled to = 72 km s-1).
For the band we can also derive the absolute magnitude through the relation with . Using (a) the known relation between the peak luminosity and the of Hamuy et al. (1996a) (“peak subsample” case), (b) Phillips et al. (1999) (see their Table 3), and (c) Prieto, Rest & Suntzeff (2006) (complete sample reported in Table 3), scaled to = 72 km s-1, we derived quite close to that estimated with our equations (see Table 11). We note that equation 2 with the parameters previously derived provide mag, in excellent agreement with the above estimate within the calculated errors. Note that we consider the absolute magnitudes of SN 2002cv to be those obtained using the distance modulus.
Considering again the Prieto, Rest & Suntzeff (2006) relation, we obtain an analogous estimate in the band, mag. Hamuy et al. (1996a) and Phillips et al. (1999) do not provide an average relation in the band. As before, by applying equation 2, we obtain a value in excellent agreement, mag.
The NIR absolute magnitudes were estimated from the observed peak magnitude and . Their values ( mag, mag, and mag) are consistent with the average values found by Krisciunas et al. (2004b) within the uncertainties ( mag, mag, and mag).
| (mag) | Method | Reference |
|---|---|---|
| distance | this work | |
| eq. 5 and 6 | this work | |
| vs. | Hamuy et al. (1996a)1 | |
| vs. | Phillips et al. (1999)2 | |
| vs. | Prieto, Rest & Suntzeff (2006)3 |
() According to the relation given in Table 3 of Hamuy et al. (1996a) (peak luminosity);
() according to the relation given in Table 3 of Phillips et al. (1999);
() according to the relation given in Table 3 of Prieto, Rest & Suntzeff (2006) (for the complete sample – ALL).
6 Summary
We have presented optical and NIR data on SN 2002cv and completed the study of this SN started by Di Paola et al. (2002) including the available data collected worldwide. SN 2002cv exploded in the same galaxy as SN 2002bo, a few months later, and it suffered a very high extinction. The presence of clear secondary maxima in the red and NIR light curves, the colour curves, and the spectral features confirm its early classification as a SN Ia.
We have used different methods to estimate the extinction, adopting in all cases a CCM extinction law with as a free parameter. We obtained = 5.45 0.28 mag and = 1.59 0.07 ( = 8.66 0.21) inside the host galaxy, which give a total absorption = 8.74 0.21 mag. It turns out that SN 2002cv is one of the most reddened SNe ever observed, and a new entry in the growing list of SNe with a low value of (e.g., SN 1999cl, Krisciunas et al. 2006; SN 2001el, Krisciunas et al. 2007; SN 2002hh, Pozzo et al. 2006; SN 2003cg, Elias-Rosa et al. 2006).
We have constructed empirical relations between and , the delay of the secondary maximum (), and the decline rate at 40 days in the band (). These allow us to derive the luminosity class of a SN Ia, without the use of the unavailable -band data. With these average relations for SN 2002cv, we derive mag and mag, which is marginally fainter than that estimated from the observed peak magnitude and : mag.
Since is related to the grain size, the different values of this found for SN 2002bo and SN 2002cv show that in NGC 3190 there is dust with different properties (at least for the two line of sights measured) which are different from those of typical Galactic dust. A possible explanation for the different grain sizes might be the effect of SN radiation on local circumstellar dust or the peculiar physical conditions in dust lanes.
A better understanding of this phenomenon is important both for
understanding the nature of the exploding stars and for the
calibration of SNe Ia for cosmological use.
ACKNOWLEDGMENTS
This work is based on observations collected at the European Southern Observatory, Chile, under programmes ID 69.D-0672(B) and ID 069.D-0672(C), at the Isaac Newton and Jacob Kapteyn 1.0 m Telescopes of the Isaac Newton Group (La Palma); the Asiago 1.82 m Copernico Telescope; the Teramo-Normale Telescope and the AZT-24 Telescope (INAF Observatories, Italy); the 0.76 m Katzman Automatic Imaging Telescope, the Nickel 1 m telescope, and the Shane 3 m reflector (Lick Observatory, California, USA); and the United Kingdom Infrared Telescope (Hawaii). The INT and JKT are operated on the island of La Palma by the Isaac Newton Group (ING) in the Spanish Observatorio del Roque de los Muchachos of the Instituto de Astrofísica de Canarias. The European observations were obtained in the framework of the European Supernova Collaboration (ESC)777http://www.mpa-garching.mpg.de/rtn/ funded as a European Research Training Network (HPRN-CT-2002-00303). AZT-24 Telescope is installed in Campo Imperatore (Italy) under agreement between Pulkovo, Rome and Teramo observatories. KAIT was constructed and supported by donations from Sun Microsystems, Inc., the Hewlett-Packard Company, AutoScope Corporation, Lick Observatory, the US National Science Foundation (NSF), the University of California, the Sylvia & Jim Katzman Foundation, and the TABASGO Foundation. UKIRT is operated by the Joint Astronomy Centre on behalf of the U.K. Particle Physics and Astronomy Research Council. Some of the data reported here were obtained as part of the ING and UKIRT Service Programmes. A.V.F.’s supernova group at U.C. Berkeley is funded by NSF grant AST–0607485 and the TABASGO Foundation. This work has made use of the NASA/IPAC Extragalactic Database (NED), which is operated by the Jet Propulsion Laboratory, California Institute of Technology, under contract with the National Aeronautics and Space Administration.
References
- Akritas & Bershady (1996) Akritas, M. G., & Bershady, M. A., 1996, ApJ, 470, 706
- Alard (2000) Alard, C., 2000, A&AS, 144, 363
- Altavilla et al. (2004) Altavilla, G. et al., 2004, MNRAS, 349, 1344
- Arnett (1982) Arnett, W. D., 1982, ApJ, 253, 785
- Benetti et al. (2004) Benetti, S. et al., 2004, MNRAS, 348, 261
- Benetti et al. (2005) Benetti, S. et al., 2005, ApJ, 623, 1011
- Branch et al. (2006) Branch, D. et al., 2006, PASP, 118, 560
- Cappellaro et al. (1997) Cappellaro, E., Mazzali, P. A., Benetti, S., Danziger, I. J., Turatto, M., Della Valle, M., & Patat, F., 1997, A&A, 328, 203
- Cardelli, Clayton & Mathis (1989) Cardelli, J. A., Clayton, G. C., & Mathis, J. S., 1989, ApJ, 345, 245
- Contardo, Leibundgut & Vacca (2000) Contardo, G., Leibundgut, B., & Vacca, W. D., 2000, A&A, 359, 876
- Di Paola et al. (2002) Di Paola, A., Larionov, V., Arkharov, A., Bernardi, F., Caratti o Garatti, A., Dolci, M., Di Carlo, E., & Valentini, G., 2002, A&A, 393, L21
- Elias-Rosa et al. (2006) Elias-Rosa, N., et al., 2006, MNRAS, 369, 1880
- Filippenko (1997) Filippenko, A. V., 1997, ARAA, 35, 309
- Filippenko (2005) Filippenko, A. V., 2005, in White Dwarfs: Cosmological and Galactic Probes, ed. E. M. Sion, S. Vennes, & H. L. Shipman (Dordrecht: Springer), 97
- Filippenko et al. (2002) Filippenko, A. V., Chornock, R., Foley, R. J., & Li, W., 2002, IAUC 7917
- Filippenko et al. (1986) Filippenko, A. V., et al., 1986, AJ, 92, 1341
- Filippenko et al. (1992a) Filippenko, A. V., et al., 1992a, ApJ, 384, L15
- Filippenko et al. (1992b) Filippenko, A. V., et al., 1992b, AJ, 104, 1543
- Fitzpatrick (2004) Fitzpatrick, E. L., 2004, in Astrophysics of Dust, ed. A. N. Witt, G. C. Clayton, & B. T. Draine (San Francisco: ASP, Conf. Ser. 309), 57
- Freedman et al. (2001) Freedman, W. L., et al., 2001, ApJ, 553, 47
- Gamezo, Khokhlov & Oran (2005) Gamezo, V. N., Khokhlov, A. M., & Oran, E. S., 2005, ApJ, 623, 337
- Garavini et al. (2007) Garavini, G., et al., 2007, A&A, 471, 527
- García (1993) García, A. M., 1993, A&AS, 100, 47
- Geminale & Popowski (2005) Geminale, A., & Popowski, P., 2005, preprint (astro-ph/0502540)
- Goudfrooij et al. (1994) Goudfrooij, P., de Jong, T., Hansen, L., & Nrgaard-Nielsen, H. U., 1994, MNRAS, 271, 833
- Hachinger, Mazzali & Benetti (2006) Hachinger, S., Mazzali, P.,A., & Benetti, S., 2006, MNRAS, 370, 299
- Hamuy et al. (1996a) Hamuy, M., Phillips, M. M., Suntzeff, N. B., Schommer, R. A., Maza, J., & Aviles, R., 1996a, AJ, 112, 2391
- Hamuy et al. (1996b) Hamuy, M., et al., 1996b, AJ, 112, 2408
- Hamuy et al. (1996c) Hamuy, M., Phillips, M. M., Suntzeff, N. B., Schommer, R. A., Maza, J., Smith, R. C., Lira, P., & Aviles, R., et al., 1996c, AJ, 112, 2438
- Hamuy et al. (2001) Hamuy, M., et al., 2001, ApJ, 558, 615
- Hillebrandt & Niemeyer (2000) Hillebrandt, W., & Niemeyer, J. C., 2000, ARA&A, 38, 191
- Jha et al. (2006) Jha, S., et al., 2006, AJ, 131, 527
- Kasen (2006) Kasen, D., 2006, ApJ, 649, 939
- Kraan-Korteweg (1986) Kraan-Korteweg, R. C., 1986, A&AS, 66, 255
- Krisciunas et al. (2006) Krisciunas, K., Prieto, J. L., Garnavich, P. M., Riley, J. G., Rest, A., Stubbs, C., & McMillan, R., 2006, AJ, 131, 1639
- Krisciunas et al. (2003) Krisciunas, K., et al., 2003, AJ, 125, 166
- Krisciunas et al. (2004a) Krisciunas, K., et al., 2004a, AJ, 127, 1664
- Krisciunas et al. (2004b) Krisciunas, K., et al., 2004b, AJ, 128, 3034
- Krisciunas et al. (2007) Krisciunas, K. et al., 2007, AJ, 133, 58
- Landolt (1992) Landolt, A. U., 1992, AJ, 104, 340
- Larionov & Arkharov (2002) Larionov, V., & Arkharov, A., 2002, IAUC 7901
- Leibundgut et al. (1993) Leibundgut, B., et al., 1993, AJ, 105, 301
- Leonard et al. (2002) Leonard, D. C., et al., 2002, PASP, 114, 35
- Lira (1995) Lira, P., 1995, Masters thesis, University of Chile
- Lira et al. (1998) Lira, P., et al., 1998, AJ, 115, 234
- Marion et al. (2003) Marion, G. H., et al., 2003, ApJ, 591, 316
- Mazzali et al. (2005) Mazzali, P. A., et al., 2005, ApJ, 623, L37
- Mazzali et al. (2007) Mazzali, P. A., Röpke, F. K., Benetti, S., & Hillebrandt, W., 2007, Science, 315, 825
- Meikle (2000) Meikle, W. P. S., 2000, MNRAS, 314, 782
- Meikle & Mattila (2002) Meikle, P., & Mattila, S., 2002, IAUC 7911
- Meikle et al. (1996) Meikle, W. P. S., et al., 1996, MNRAS, 281, 263
- Myung (2003) Myung, J., 2003, Journal of Mathematical Psychology, 47, 90
- Nobili et al. (2005) Nobili, S., et al., 2005, A&A, 437, 789
- Nomoto et al. (2007) Nomoto, K., Saio, H., Kato, M., & Hachisu, I., 2007, ApJ (astro-ph/0603351)
- Pastorello et al. (2006) Pastorello, A., et al., 2006, MNRAS, 370, 1752
- Pastorello et al. (2007a) Pastorello, A., et al., 2007a, MNRAS, 376, 1301
- Pastorello et al. (2007b) Pastorello, A., et al., 2007b, MNRAS, 377, 1531
- Pastorello et al. (2007c) Pastorello, A., et al., 2007c, MNRAS, in prep.
- Patat et al. (1996) Patat, F., Benetti, S., Cappellaro, E., Danziger, I. J., Della Valle, M., Mazzali, P. A., & Turatto, M., 1996, MNRAS, 278, 111
- Patat et al. (2007) Patat, F., et al., 2007, Science, 317, 924
- Patil et al. (2007) Patil, M. K., Pandey, S. K., Sahu, D. K., & Kembhavi, A., 2007, A&A, 461, 103
- Perlmutter et al. (1997) Perlmutter, S., et al., 1997, ApJ, 483, 565
- Phillips et al. (1992) Phillips, M. M., Wells, L. A., Suntzeff, N. B., Hamuy, M., Leibundgut, B., Kirshner, R. P., & Foltz, C. B., 1992, AJ, 103, 1632
- Phillips et al. (1999) Phillips, M. M., Lira, P., Suntzeff, N. B., Schommer, R. A., Hamuy, M., & Maza, J., 1999, AJ, 118, 1766
- Pignata (2004b) Pignata, G., 2004, PhD thesis, Univ. Padova
- Pignata et al. (2004) Pignata, G., et al., 2004, MNRAS, 355, 178
- Pozzo et al. (2006) Pozzo, M., et al., 2006, MNRAS, 368, 1169
- Prieto, Rest & Suntzeff (2006) Prieto, J. L., Rest, A., & Suntzeff, N. B., 2006, ApJ, 647, 501
- Reindl et al. (2005) Reindl, B., Tammann, G. A., Sandage, A., & Saha, A., 2005, ApJ, 624, 532
- Richmond et al. (2005) Richmond, M. W., et al., 1995, AJ, 109, 2121
- Riess, Press, & Kirshner (1996) Riess, A. G., Press, W., & Kirshner, R. P. 1996, ApJ, 473, 88
- Riess et al. (1999) Riess, A. G., et al., 1999, AJ, 117, 707
- Röpke et al. (2006) Röpke, F. K., Hillebrandt, W., & Blinnikov, S. I., 2006, in Beyond Einstein — Physics for the 21st Century, ed. A. M. Cruise & L. Ouwehond (ESA-SP, vol. 637), 16.1 (astro-ph/0609631)
- Röpke et al. (2007) Röpke, F. K., Woosley, S. E., & Hillebrandt, W., 2007, ApJ, 660, 1344
- Saha et al. (1999) Saha, A., Sandage, A., Tammann, G. A., Labhardt, L., Macchetto, F. D., & Panagia, N., 1999, ApJ, 522, 802
- Salvo et al. (2001) Salvo, M. E., Cappellaro, E., Mazzali, P. A., Benetti, S., Danziger, I. J., Patat, F., & Turatto, M., 2001, MNRAS, 321, 254
- Savage & Mathis (1979) Savage, B. D., & Mathis, J. S., 1979, Ann. Rev. Astr. Ap., 17, 73
- Schlegel, Finkbeiner & Davis (1998) Schlegel, D. J., Finkbeiner, D. P., & Davis, M., 1998, ApJ, 500, 525
- Schmidt et al. (1994) Schmidt, B. P., Kirshner, R. P., Leibundgut, B., Wells, L. A., Porter, A. C., Ruiz-Lapuente, P., Challis, P., & Filippenko, A. V., 1994, ApJ, 434, 19
- Seaton (1979) Seaton, M. J., 1979, MNRAS, 187, 73p
- Stanishev et al. (2007) Stanishev, V., et al., 2007, A&A, 469, 645
- Stritzinger et al. (2002) Stritzinger, M. et al., 2002, AJ, 124, 2100
- Stritzinger & Leibundgut (2005) Stritzinger, M., & Leibundgut, B., 2005, A&A, 431, 423
- Suntzeff (2000) Suntzeff, N. B., 2000, in Cosmic Explosions, ed. S. S. Holt & W. W. Zhang (New York: American Institute of Physics), 65
- Suntzeff (1996) Suntzeff, N. B., 1996, in Supernovae and Supernova Remnants, ed. R. McCray & Z. Wang (Cambridge: Cambridge Univ. Press), 41
- Taubenberger et al. (2006) Taubenberger, S., et al., 2006, MNRAS, 371, 1459
- Tonry et al. (2001a) Tonry, J. L., Blakeslee, J. P., Ajhar, E. A., & Dressler, A., 2001a, ApJ, 475, 399
- Tonry et al. (2001b) Tonry J. L., Dressler, A., Blakeslee, J. P., Ajhar, E. A., Fletcher, A. B., Luppino, G. A., Metzger, M. R., & Moore C. B., 2001b, ApJ, 546, 681
- Tsvetkov & Pavlyuk (1995) Tsvetkov, D. Yu., & Pavlyuk, N. N., 1995, AstL, 21, 606
- Turatto et al. (1996) Turatto, M., Benetti, S., Cappellaro, E., Danziger, I. J., Della Valle, M., Gouiffes, C., Mazzali, P. A., & Patat, F., 1996, MNRAS, 283, 1
- Turatto et al. (2002) Turatto, M., Desidera, S., Benetti, S., Altavilla, G., Pastorello, A., Riello, M., & Cappellaro, E., 2002, IAUC 7901
- Wang (2005) Wang, L., 2005, ApJ, 635, L33
- Wheeler et al. (1998) Wheeler, J. C., et al., 1998, ApJ, 496, 908
- Whittet (1992) Whittet, D. C. B., 1992, Series in Astronomy and Astrophysics, Dust in the Galactic Environment. Institute of Physics Publishing, Bristol & Philadelphia.