Binary coalescence from case A evolution – mergers and blue stragglers
Abstract
We constructed some main-sequence mergers from case A binary evolution and studied their characteristics via Eggleton’s stellar evolution code. Both total mass and orbital angular momentum are conservative in our binary evolutions. Assuming that the matter from the secondary homogeneously mixes with the envelope of the primary and that no mass are lost from the system during the merger process, we found that some mergers might be on the left of the zero-age main sequence as defined by normal surface composition (i.e helium content with metallicity for Pop I) on a colour-magnitude diagram(CMD) because of enhanced surface helium content. The study also shows that central hydrogen content of the mergers is independent of mass. Our simple models provide a possible way to explain a few blue stragglers (BSs) observed on the left of zero-age main sequence in some clusters, but the concentration toward the blue side of the main sequence with decreasing mass predicted by Sandquist et al. will not appear in our models. The products with little central hydrogen in our models are probably subgiants when they are formed, since the primaries in the progenitors also have little central hydrogen and will likely leave the main sequence during merger process. As a consequence, we fit the formula of magnitude and of the mergers when they return back to thermal equilibrium with maximum error 0.29 and 0.037, respectively.
Employing the consequences above, we performed Monte Carlo simulations to examine our models in an old open cluster NGC 2682 and an intermediate-age cluster NGC 2660. Angular momentum loss (AML) of low mass binaries is very important in NGC 2682 and its effect was estimated in a simple way. In NGC 2682, binary mergers from our models cover the region with high luminosity and those from AML are located in the region with low luminosity, existing a certain width. The BSs from AML are much more than those from our models, indicating that AML of low mass binaries makes a major contribution to BSs in this old cluster. Our models are corresponding for several BSs in NGC 2660. At the region with the most opportunity on the CMD, however, no BSs have been observed at present. Our results are well-matched to the observations if there is of mass loss in the merger process, but a physical mechanism for this much mass loss is a problem.
keywords:
binaries:close -stars:evolution - blue stragglers1 Introduction
Much evidence shows that primordial binaries make an important contribution to blue stragglers (BSs) [2003, 2004, 2004]. At present, a few BSs, i.e. F190, Car, have already been confirmed to be in binaries by observations, and their formation may be interpreted by mass transfer between the components of a binary. Whereas in intermediate-age and old open and globular clusters, the number of observed close binaries among well-studied BSs is consistent with the hypothesis of binary coalescence. For example, Mateo et al. [1990] made a comparison of the number of close binaries with the total number of BSs in NGC 5466 and found that it is an acceptable claim that all non-eclipsing BSs are formed as the result of mergers of the components in close binaries, though the possibility of other mechanisms to produce BSs cannot be ruled out due to the large uncertainties in their analysis. Monte-Carlo simulations of binary stellar evolution [1994] also show that binary coalescence may be an important channel to form BSs in some clusters (e.g. with an age greater than 40 Myr). Meanwhile, the arguments in theory show that W UMa binaries (low-mass contact binaries) must eventually merge into a single star [1976, 1985, 1987, 1990]. Observationally, the lack of radial velocity variations for most BSs further indicates that binary coalescence may be more important than mass transfer for BS formation [1993, 1994]. FK Comae stars are generally considered to be direct evidence for binary coalescence [1993]. The smallest mass ratio of components among observed W UMa systems to date is about 0.06. All of the above show that it is important to study the remnants of close binaries. However the merge process is complicated and the physics during the process is still uncertain. Recently, Andronov, Pinsonneault & Terndrup [2006] studied the mergers of close primordial binaries by employing the angular momentum loss rate inferred from the spindown of open cluster stars. Their study shows that main sequence mergers can account for the observed number of single BSs in M67 and that such mergers are responsible for at least one third of the BSs in open clusters older than 1 Gyr. The physics of mergers are limiting case treatments in the study of Andronov, Pinsonneault & Terndrup [2006]. Based on previous studies of contact binaries and some assumptions, we construct a series of merger models in this paper, to study the structure and evolution of the models and show some comparisons with observations.
Case A binary evolution has been well studied by Nelson & Eggleton [2001]. They defined six major subtypes for the evolution (AD, AR, AS, AE, AL and AN) and two rare cases (AG and AB). Three of the subtypes (AD, AR, AS) lead the binary contact as both components are main–sequence stars and two cases (AE and AG) reach contact with one or both components having left the main sequence. As there is no description for weird objects except for two merged main–sequence stars, merger products (except for two main-sequences stars) are generally assumed to have terminated their evolution [1994], i.e. they have left the main sequence and cannot be recognized as BSs. Here we are interested in the cases of two main-sequence stars, i.e. cases AS, AR and AD. If , , represent the dynamic timescale, thermal timescale and main sequence timescale of the primary (the initial massive star,*1), respectively, the following shows a simple definition of the three evolutionary cases: AD–dynamic Roche lobe overflow (RLOF), ; AR–rapid evolution to contact, ; AS–slow evolution to contact, , where and are the ages at which RLOF begins and the binary comes into contact, respectively. In case AD, the core of the secondary spirals in quickly and stays in the center of the merger. The merger then has a chemical composition similar to that of the primary, resembling the result of smoothed particle hydrodynamic calculations [1996, 1997, 2001]. We therefore studied just the systems in cases AR and AS for this work.
2 Assumptions
Using the stellar evolution code devised by Eggleton [1971, 1972, 1973], which has been updated with the latest physics over the last three decades [1994, 1995, 1998], we re-calculate the models of cases AS and AR with primary masses between 0.89 and until the systems become contact binaries. The structures of the primaries and the compositions of the secondaries are stored to construct the merger remnants.
Before the system comes into contact, the accreting matter is assumed to be deposited onto the surface of the secondary with zero falling velocity and distributed homogeneously all over the outer layers. The change of chemical composition on the secondary’s surface caused by the accreting matter is
| (1) |
where is the mass accretion rate, and are element abundances of the accreting matter and of the secondary’s surface for species , respectively, and is the mass of the outermost layer of the secondary. The value of will change with the moving of the non-Lagrangian mesh as well as the chosen model resolution, but it is so small () in comparison with () during RLOF that we may ignore the effect of various on element abundances. Before and after RLOF, we get from the equation, which is reasonable in the absence of mixing [2004].
The merger models are constructed based on the following assumptions: (i) contact binaries with two main-sequence components coalesce finally and the changes of structures of individual components during coalescence are ignored; (ii) the matter of the secondary is homogeneously mixed with that of the primary beyond the core-envelope transition point, which separates the core and the envelope of the mass donor; (iii) the system mass is conserved.
Firstly, we present a brief discussion on these assumptions. Webbink [1976] studied the evolutionary fate of low-mass contact binaries, and found that a system cannot sustain its binary character beyond the limits set by marginal contact evolution (). He stated that a contact binary will very likely coalesce as the primary is still on the main sequence in a real system. Up to now, it is widely believed that case AD probably leads to common envelope, spiral-in, and coalescence on quite a short timescale. The final consequences of AS and AR are not very clear, but Eggleton [2000] pointed out that systems undergoing AR or AS evolution may maintain a shallow contact (perhaps intermittently) as the mass ratio becomes more extreme, and finally coalesce. Recent study on W UMa (Li, Zhang & Han, 2005) also shows that these systems will be eventually coalescence. The merged timescale, i.e. the time from a binary contact to coalescence, is important here. If it is too long, the structures of both components will change remarkably and the system may have not completed coalescence within the cluster age. There are many conflicting estimates for the timescale, however, from observations and theoretical models of the merger process. Early observational estimates range from – yr in various environments [1979, 1989]. The following study explored the average age about yr [1994, 2002]. Bilir et al. [2005] pointed out that the age difference between field contact binaries and chromospherically active binaries, 1.61 Gyr, is likely an upper limit for the contact stage by assuming an equilibrium in the Galaxy, whereas the study of W UMa by Li, Han & Zhang [2004] suggested a much longer timescale, about 7 Gyr. We adopt the empirically estimated values in this paper (i.e from to yrs) and ignore the changes of structure of individual components during merger process. For low-mass contact binaries, the common envelope is convective [1976], and the matter in it is thus homogeneous. If a system mimics shallow contact during coalescence, it is reasonable to assume that the matter of the secondary mixes with the envelope homogeneously. Van’t Veer [1997] found that the mass loss from the system during coalescence is at a rate of about by observations. If we consider that the coalescence time is yr in a binary, only is lost from the system as the binary finally becomes a single star. We then roughly assume that the mass is conservative during coalescence. However mass loss might be an important way to carry orbital angular momentum away from the binary in this process.
Secondly, we discuss the choice of the core-envelope transition point which separates the core and the envelope in the primary. Many characteristics of the merger are relevant to the choice, e.g. the chemical composition in the envelope, evolutionary track on Hertzsprung-Russel diagram, and some observational characteristics. Unfortunately, one cannot find the core-envelope transition point in a main-sequence star as easily as in evolved stars because the density profile, as well as many other thermodynamic quantities (entropy, pressure, temperature etc.), is smooth and does not have a deep gradient for main-sequence stars. Chen & Han [2005] studied the influences of core-envelope transition point on the mergers of contact binaries with two main-sequence components. They found that one may ignore the effects which result from different choices of the transition point on colours and magnitudes of the merger if it is outside the nuclear reaction region of the primary, which is commonly considered as the nearest boundary of the secondary reaches in cases AS and AR. In this paper, the core-envelope transition is determined as the point within which the core produces 99 per cent of total luminosity. This choice is generally outside the nuclear reaction regions and has little effect on the final results.
Finally the merger remnant is constructed as follows: it has the total mass of the system and a chemical composition within similar to the core of the primary. The chemical composition in the envelope of the merger is given by
| (2) |
where and denote the total masses of species of the secondary and of the primary’s envelope, respectively. is the envelope mass of the primary. There might be a region in which the helium abundance is less than that of the outer region. The matter in this region then has a lower mean molecular weight than that in the outer region. This results in secular instability and thermohaline mixing [1980, 1972]. We include it as a diffusion process in our code [2004].
In the models of Nelson & Eggleton [2001], both total mass and angular momentum are conservative. It was mentioned by the authors, however, that these assumptions were only reasonable for a restricted range of intermediate masses, i.e spectra from about G0 to B1 and luminosity class III-V. Observationally, some low mass binaries with late-type components show clear signs of magnetic activity, which indicates that the systems evolve by way of a scenario implying angular momentum loss (AML) by magnetic braking [1984]. Magnetized stellar winds probably do not carry off much mass, but they are rich in angular momentum because of magnetic linkage to the binaries. For close binaries, rotation is expected to synchronize with orbital period, so AML is at the expense of the orbital angular momentum, resulting in orbital decaying and the components approaching each other. A detached binaries, then, may become contact and finally coalesce at or before the cluster age [1995]. There are a number of subjects including the treatment of AML [2004, 2006, 2006, 2006]. For simplicity, the conservative assumption is also adopted in our binary evolutions. In old clusters, however, AML of low mass binaries is very important and we estimate its importance in another way (see section 4.2).
3 Evolutionary Results
A set of binaries undergoing AS and AR evolution from Nelson & Eggleton [2001] are choosen to study the characteristics of the merger products and their connections with blue stragglers. Table A1 gives the initial parameters of the binary systems, their RLOF information and the structures and evolutionary consequences of the mergers. The first three columns contain the initial mass of the primary , the initial mass ratio (the primary to the secondary) and the initial orbital period in logarithmic, where is given by (Nelson & Eggleton, 2001)
| (3) |
The fourth and fifth columns are the ages at which Roche lobe overflow begins () and the binary comes into contact () in our calculation. The next three columns show some system parameters at , i.e. the mass of the primary , the mass of the secondary and the orbital period . The remaining columns present the evolutionary results of the mergers: the lifetime on the main sequence (), the central hydrogen mass fraction of the merger as constructed () and after adjustment (), surface abundances for the elements H (), He () and the ratio of C/N at the surface ().
Figure. 1 shows the location of the mergers on a colour-magnitude diagram (CMD) when the central hydrogen mass fraction reaches its maximum, at which we consider that the merger returns to thermal equilibrium and begins normal evolution. In a real case, the thermal equilibrium point of the constructed models are probably not just at the maximum of central hydrogen mass, but the divergence should be very small and have no influence on the results. ‘.’ and ‘’ in the figure represent the mergers from AS and AR, respectively. Open circles show the possible BSs produced from our models in an old open cluster M67 and the dashed one shows zero-age main sequence (ZAMS) for , where is metallicity and is helium content. In figure 1 we see that most of the mergers are located in the main sequence while a few are to the left of ZAMS. Surface chemical composition and central hydrogen content are both responsible for placing objects to the left of ZAMS. Generally the mergers have a larger helium content than 0.28 because the matter from the secondary, including some helium-rich matter produced via nuclear reaction, homogeneously mixes in the envelope of the primary. They are thus bluer than stars of the same mass and of the same central hydrogen mass fraction with . Furthermore, the mergers may be on the left of ZAMS if central H contents close to 0.7, initial H mass fraction for Pop I.
Sandquist, Bolte & Hernquist [1997] argued that a fainter BS should have a less massive progenitor, and therefore has a lower helium content in the core. This means that BSs should spend an increasing amount of time near the ZAMS with decreasing mass, which will lead to a definite concentration toward the blue side of the main sequence in the region of low mass BSs. In Fig. 2 we present the distribution of central hydrogen mass fraction at its maximum with the mass of the merger. No evidence in the figure shows that lower mass mergers should have higher hydrogen mass fractions in the center (say, more close to ZAMS). In our models, there are at least two factors affecting the central hydrogen mass fraction of a merger, i.e. the evolutionary degree of the parent stars when the system comes into contact and the development of the central convective region of the merger before normal evolution. The former is relevant to the mass of the progenitor and their contact ages. If we simply assume that all BSs in a cluster are formed at a same time (which is obviously not true), larger (more massive) progenitors have less hydrogen content in the center, but their mergers may develop larger convective regions in the centers, involving more of the H-rich matter from around the nuclear region of the primary in the center of the merger. As a consequence, the enhancement of central hydrogen content might be comparable to, or larger than, the less massive mergers. On the other hand, if a fainter BS is produced earlier than a brighter one – the formation time of a BS is strongly dependent on some other system’s initial parameters as well as its progenitors’ mass. The fainter BS has then evolved for a relatively longer time and may have less hydrogen in the center than the larger one. Therefore the blue concentration with mass decreasing predicted by Sandquist, Bolte & Hernquist [1997] may be not true in a real case. In fact, we have not found the concentration observationally, whereas there is a certain width of BSs sequence.
We obtained some models with very little central hydrogen content, i.e very close to zero. Seen in Fig. 2, all these objects are from the AS channel. Long-time RLOFs of their progenitors lead the primaries be near the termination of main sequence when the systems being contact. Detailed calculations for these mergers show that their main-sequence timescales are in order of yrs. Such unusually long lifetimes are relevant to the development of central convective core. Comparison to the primaries of the progenitors, the products have higher masses and will develop larger convective core masses in the following evolutions, leading central hydrogen increase. On the other hand, nuclear reactions will consume some hydrogen in the core. The maximum of central hydrogen mass fraction is the equibibrium point at which the hydrogen involved in the core is comparable to that exhausted by nuclear reactions. After that, the consumed hydrogen is more than that involved in the core, but the growth of convective core adds fresh fuels and extends the lifetime in this phase. For a star with a stable convective core, it is just about yr when hydrogen mass fraction ranges from 0.005 to 0.0000, while about yr in these models.
We should pay more attention to the mergers with little central hydrogen content. The triangles in figure 1 show the positions of these objects. From Table A1, we see that the primaries are very close to the exhausted of hydrogen. So it is very likely that the primaries have left the main sequence as eventually coalescence, and the mergers are subgiants and much redder than that shown in Fig. 1. Meanwhile, the development of convective core and the merger process are probably synchronous. After coalescence, the convective core develops more quickly than that in our models. Sandquist, Bolte & Hernquist [1997] once suggested that low-mass BSs (near the turnoff of a cluster) in M67 might be subgiant stars and a very small central hydrogen content in these objects may remarkably shorten their MS lifetimes and increase the chance of them being in the subgiant region. This may explain the observed spread in colour of low-mass BSs. These mergers with little central hydrogen in our models are similar to the objects mentioned by Sandquist, Bolte & Hernquist [1997], but they may be up to , not just staying in the region around the turnoff in M67.


Figures.3 and 4 show how the magnitude in the V band, , and the colour, , change with the merger mass at . is calculated by
| (4) |
where and are obtained by linear interpolation from the BaSel-2.0 model [1997, 1998].
As seen in the figures, and are affected not only by the total mass, but also by the initial orbital period. For , Figs. 5 and 6 present vs and vs , respectively. The solid lines are fitted by (two models marked with star are ruled out because they are outliers):
| (5) |
| (6) |
The maximum errors for the two equations are 0.19 and 0.019, respectively.
Considering the initial orbital period, we get
| (7) |
| (8) |
The maximum errors for the two equations are 0.29 and 0.037, respectively. The four models marked with stars in Figs.3 and 4 are also ruled out in the fitting for the same reason as above. The distribution of error for eqs.(6) and (7), from detailed calculation, are shown in Figs.7 and 8.


Initial parameters of the four systems ruled out in eqs.(6) and (7) are ()= (0.89, 0.2, 0.1), (0.89, 0.25, 0.1), (1.26, 0.15, 0.15) and (1.41, 0.25, 0..2). From Table A1, we see that all four of these mergers have central hydrogen content close to zero, i.e. 0.0007, 0.0020, 0.0028 and 0.0007, respectively. This might be the reason that they deviate from most of our models
The evolutionary tracks of the mergers with (()=(1.41, 0.40)) are shown in Fig. 9. Two stars with and and are also presented in the figure (dotted lines) for convenient comparison. In the figure, we can hardly distinguish the difference from various initial orbital period except for the main-sequence life, , of the mergers. Though cannot be directly observed, it may affect observations, i.e. together with of the progenitor system, it is crucial for whether or not the merger can be observed or not by now. At the same time, various initial orbital periods result in different luminosity functions for mergers – a longer initial orbital period leads a shorter , but during the shorter , the merger mainly stays in the relatively high luminosity region (Fig. 9).


4 the mergers and BSs in open clusters
If a BS in a cluster is the merger remnant of binary coalescence 111It just means AS and AR evolutionary channels in this section, then there are some constrains on the progenitor and on the merger itself. Firstly the total mass of the progenitor should be larger than the turnoff of the cluster . Secondly, the contact age of the progenitor should be appropriate. It cannot be so short that the merger has terminated its evolution on the main sequence, indicating . Here is the timescale from binary contact to final merger. also cannot be too long to complete its merger process at , indicating . If a binary has already come into contact but has not completed the mergering process (i.e. a W UMa system), it can also be considered as a BS [1993], e.g. S1036 and S1282 in M67. The initial parameter space for W UMa systems may be obtained by .
| ID | |||||
|---|---|---|---|---|---|
| Be 33 | 0.7 | 0.005 | 2 | 1 | 270 |
| Tom 2 | 1 | 0.009 | 17 | 4 | 440 |
| NGC 2243 | 1.1 | 0.007 | 9 | 2 | 120 |
| NGC 2158 | 1.2 | 0.006 | 40 | 700 | |
| NGC 2660 | 1.2 | 0.02 | 8 | 150 | |
| NGC 6939 | 1.6 | 0.02 | 5 | 180 | |
| NGC 3680 | 1.6 | 0.026 | 1 | 30 | |
| NGC 752 | 1.7 | 0.014 | 1 | 1 | 25 |
| NGC 7789 | 2.0 | 0.016 | 22 | 5 | 130 |
| NGC 2682 | 4.0 | 0.02 | 30 | 3 | 175 |
| NGC 188 | 7.0 | 0.024 | 24 | 7 | 185 |
| NGC 6791 | 7.2 | 0.039 | 75 | 4 | 800 |
| Be 39 | 8.0 | 0.01 | 43 | 9 | 600 |
Figure 10 presents the lives of the mergers on the main sequence. We see that some low-mass BSs (i. e. ) may exist for about yr, which is long enough to be observed. In most cases, it is in order of yr, which is similar to that of W UMa stars from observations, and therefore we may roughly estimate the contribution to BSs from AS and AR via the number of W UMa systems in a cluster. The estimation, however, is not absolutely since both of the two timescales have wide ranges and large uncertainties, and we cannot rule out other methods for creating W UMa systems except for AS and AR. Table 1 presents characteristics of some open clusters and the numbers of BSs and W UMa systems in them from observations. We see that in old clusters (i.e Gyr) and in half of the left clusters, indicating that our models (binary coalescence from AS and AR) are not important for the produce of BSs in old open clusters, while likely play a critical role in some younger open clusters. In old open clusters, where stellar collisions may be ignored because of low stellar density, AML of low mass binaries is possibly dominated in producing BSs, since the time is long enough for binaries with initial orbital period about 2 d evolving from detached to contact by AML and the mergers may be more massive than the turnoff. Meanwhile, from initial mass functions which have been presented, most stars are concentrated on low mass. Since the individual components almost have not evolved before contact, their mergers from this way have much longer timescales on the main sequences.
4.1 Binary Samples
To investigate BSs resulting from binary coalescence, we have performed a Monte Carlo simulation where a sample of binaries are considered (very wide binaries are actually single stars) including BSs originated from AS and AR evolution channels. A single starburst is assumed in the simulation, i.e. all the stars have the same age and metallicity (). The initial mass function (IMF) of the primary, the initial mass ratio distribution and the distribution of initial orbital separation are as follows:
i) the IMF of Miller & Scalo [1979] is used and the primary mass is generated from the formula of Eggleton, Fitchett & Tout [1989]:
| (9) |
where is a random number uniformly distributed between 0 and 1. The mass ranges from 0.1 to 100.
ii)the mass ratio distribution is quite controversial and, for simplity, we only consider a constant mass ratio distribution [1992].
| (10) |
where .
iii)We assume that all stars are members of binary systems and the distribution of separations is constant in log ( is separation).
| (11) |
where and . This distribution gives an equal number of wide binary systems per logarithmic interval and 50 per cent of systems with orbital periods of less than 100 yr.
4.2 NGC 2682
Some studies show that the metallicity of NGC 2682 is a little different from the solar [1996, 1996], while some other studies concur that it is virtually indistinguishable from solar [1991, 1993]. So we select this cluster as the first sample to examine our models. The distance modulus and the reddening [1996, 1996] as we translate the theory results to observations.
Previous studies on the age of this cluster showed several discrepancies. It may range from 3.2+0.4 Gyr [2003] to 6.0 Gyr [1994]. The study of VandenBerg & Stetson [2004] derived an age of 4.0 Gyr. In the N-body model of this cluster [2005], the authors investigated the behaviour around 4 Gyr. As mentioned in section 2, it is also a great uncertainty for the timescale . Table 2 and Table 3 present initial parameter spaces from different considerations for both BSs and W UMa systems in our grid. In Table 2, we fixed the cluster age at yr (corresponding to the turnoff of ) and varied , i.e yr, yr and yr. In Table 3, we set yr while the age of the cluster has a width from 3.2 to 4.2 Gyr. then the conditions for valid parameter space to form BSs via case AS or AR are yr, yr, and the constrains for W UMa systems in the cluster are yr and yr.
In Table LABEL:1, we see that will remarkably affect on initial parameter space for both of the two kinds of objects. For example, the initial parameter space is much larger for yr than those with other . We should bear in mind that, however, the long may be unreasonable from both of observations and theories (see section 2). The long may delay the appearance of the mergers and shorten their timescales on the main sequence, since individual evolution during mergering process are ignored. Especially for the primaries with a very littler hydrogen in the center at the system contact, the mergers may have never been on the main sequence.
From Table LABEL:2, we see that, because of the existence of an age range, some models might be either mergers or W UMa systems. For large uncertainties of the age of the cluster, the initial parameter defined this way include almost all the models in Table LABEL:1.
| yr | |||
| the mergers | 1.26 | 0.15 | 0.1 |
| W UMa | 1.26 | 0.05 | 0.2 |
| yr | |||
| the mergers | 1.26 | 0.25 | 0.05 |
| 1.41 | 0.15 | 0.2 | |
| W UMa | 1.26 | 0.05 | 0.2 |
| 1.26 | 0.15 | 0.1 | |
| yr | |||
| the mergers | 1.12 | 0.05 | 0.05 |
| 1.12 | 0.3 | 0.05 | |
| 1.26 | 0.05 | 0.15 | |
| 1.26 | 0.1 | 0.1 | |
| 1.26 | 0.25 | 0.05 | |
| 1.26 | 0.35 | 0.15 | |
| 1.26 | 0.4 | 0.15 | |
| 1.41 | 0.2 | 0.15 | |
| 1.41 | 0.3 | 0.15 | |
| W UMa | 1.26 | 0.05 | 0.2 |
| 1.26 | 0.15 | 0.1 | |
| 1.41 | 0.15 | 0.2 | |
| 1.41 | 0.25 | 0.15 |
| the mergers | W UMa | |||||||
|---|---|---|---|---|---|---|---|---|
| 1.12 | 0.05 | 0.05 | 1.12 | 0.1 | 0.05 | |||
| 1.12 | 0.3 | 0.05 | ||||||
| 1.26 | 0.05 | 0.15 | 1.26 | 0.05 | 0.15 | |||
| 1.26 | 0.1 | 0.1 | 1.26 | 0.05 | 0.2 | |||
| 1.26 | 0.15 | 0.1 | 1.26 | 0.1 | 0.1 | |||
| 1.26 | 0.25 | 0.05 | 1.26 | 0.15 | 0.1 | |||
| 1.26 | 0.35 | 0.15 | 1.26 | 0.3 | 0.1 | |||
| 1.26 | 0.4 | 0.15 | ||||||
| 1.41 | 0.05 | 0.25 | 1.41 | 0.15 | 0.2 | |||
| 1.41 | 0.15 | 0.2 | 1.41 | 0.2 | 0.15 | |||
| 1.41 | 0.2 | 0.15 | 1.41 | 0.25 | 0.15 | |||
| 1.41 | 0.25 | 0.15 | 1.41 | 0.25 | 0.2 | |||
| 1.41 | 0.3 | 0.15 | 1.41 | 0.3 | 0.2 | |||
| 1.41 | 0.35 | 0.3 | ||||||
| 1.41 | 0.4 | 0.3 |
Some models with appear in Table LABEL:1. We checked the evolutionary details of them in Table A1 and find that the system ()= (1.41, 0.15, 0.2) begins RLOF at 1.4 Gyr and becomes contact at 3.3 Gyr. As yrs, the merger is formed at 3.8 Gyr with after self-adjustment and will leave the main sequence after 0.45 Gyr. As discussed in section 3, the merger of this system is very likely to be a subgiant when it formed. For other binaries with in Table LABEL:1, though the primary is not near to zero, relatively long contact timescales () lead the mergers be formed at about 3.5 to 3.8 Gyr. So they are still on the main sequence at the cluster age.
Now we consider another case which is related to the BSs in a binary BS+MS in this cluster. It means that the secondary is a BS before the system being contact. The parent binary for this case should fulfill the conditions as follows: (a) ; (b) at , . Only one model is found in our results to possibly produce BS+MS in M67. The initial parameters for the model are . At the age yr, the secondary is and the system comes into contact at yr with an orbital period of 0.5276 d. It means that the BS+MS may exist at least for yr. A system like this should be near the turn-off if only the secondary (BS) is considered. However no observed BSs in this region are located in a binary like this. The evolved component may contribute to some luminosity [2006].
| conditions | |||
|---|---|---|---|
| case 1 | yr | 5 | 3 |
| yr | |||
| case 2 | yr | 5 | 10 |
| yr | |||
| case 3 | yr | 14 | 15 |
| yr | |||
| case 4 | yr | 20 | 13 |
| yr | |||
| case 5 | yr | 25 | 19 |
| yr | |||
| case 6 | yr | 38 | 36 |
| yr |
| conditions | |||
|---|---|---|---|
| case 1 | yr | 855 | 14 |
| yr | |||
| case 2 | yr | 964 | 84 |
| yr | |||
| case 3 | yr | 1079 | 204 |
| yr | |||
| case 4 | yr | 824 | 0 |
| yr | |||
| case 5 | yr | 996 | 120 |
| yr | |||
| case 6 | yr | 1194 | 109 |
| yr |

By interpolating from Table A1, we get different numbers of BS () under various conditions (Table LABEL:3). The location of the produced BSs on a CMD are presented in Fig.11.
As mentioned before, AML of low mass binaries probably makes a major contribution to BSs in this old open cluster. For low mass binaries, the individual components have almost not evolved (very close to ZAMS) before contact, and therefore their mergers may be replaced with ZAMS models with a mass of the parent binaries. After coalescence, however, the mergers are much more massive and their evolutions cannot be negected agian. To examine the effect of AML in this cluster, we simply deal with low-mass binaries () as follows:
(1) From the binary sample, we found out some binaries with and with the orbital period less than 0.5 d at the cluster age by AML. The lower mass limit is sure that the mergers are probably larger than the turnoff, and the constrain on the orbital period leads the binaries possibly be contact before or at the cluster age. A semi-empirical formula for the orbital period variation is adopted here [2006]:
| (12) |
where in days and time in years. For very short orbital periods the exponential factor is close to unity and varies very little during the subsequent evolution of the orbital period of the binaries. So it is ignored in this paper.
(2)Find out the time, , at which the primary is full of its Roche lobe for the selected binaries from step 1. A rapid binary evolution code written by Hurley, Pols & Tout (2002) is employed here and the Roche lobe of the primary is calculated by [1983]
| (13) |
where A is the separation and
(3)Evolve the mergers to the cluster age. The mergers are ZAMS models instead with a mass of the systems. The starting age is , since the systems will reach contact very quickly from the onset of RLOF because of AML. Different timescales are adopted here. Some of the binaries from step 1 have left the main sequence, but most of them remain on the main sequence.
Table 5 gives the results from different cluster age assumptions and different , and the magnitudes and colors for the mergers from these cases are also presented in Fig. 11.
In Fig.11, we see that, the products from binary evolution (AS and AR in the paper) and those from AML cover different regions. The mergers from conservative evolution are located in the region of high luminosity, i.e far away from the the turnoff, and the remnants from AML occupy the region with low luminosity and have a scatter on the color. The figure also indicates that AML of low-mass binaries is much more important in this old open cluster. In some cases (case 3 to 6), the produced BSs from conservative evolutionary appears a certain width with decreasing mass. Another phenomena worth noticing is in case 6, the produced BSs result extends very close to F81, the observed brightest BSs in this cluster. Further study shows that the lower limit of the cluster age may be 3.8 Gyr for yr to result in the produced BSs extending to the position of F81.
As shown in Table 4, we only obtained 38 BSs from a binary sample in the widest condition. NGC 2682 is an open cluster and has a much less stars than . In Hurley et al. [2005], 12000 single stars and 12000 binaries () are adopted in the best fitting model. Multipying this factor, we just got 1 BS with high luminosity. There are 3 BSs from the observations, however, located in the region covered by the mergers from AS and AR. The number of stars initially in this cluster is important here, but it is difficult for us to estimate it because of the incompleteness of observations as determing the current mass and the uncertainties of mass loss history of the cluster when converting to an initial mass . IMF may also affect the results. We adopt the field single star IMF for the primaries and the lower mass limit is in the binary sample, however, M67 is an old open cluster and rich in binaries, and then it possibly has different IMF as well as different lower mass limit as described by Chabrier [2003].
In the region with low luminosity, i.e the region covered by the mergers of AML, the numbers shown in Table 5 are enough to account for BSs in this region. Dynamically unstable mass transfer (AD) is also possible to form BSs in this region, since the binaries undergoing AD have larger initial mass ratios in general, leading the smaller mergers. According to the result of Nelson & Eggleton (2001), we roughly estimate the number of binaries undergoing AD evolution with initial primary mass between 0.89 and as . It is about 41–63 and the mass of the binaries are less than , indicating that AD may produce BSs near the turnoff indeed, but the contribution is much smaller than that of AML in low-mass binaries.
In Hurley et al.[2005], the authors obtained seven BSs from case A mass transfer leading to coalescence by unperturbed evolution. The age of the mergers in that paper were calculated based on the assumption that core hydrogen burning proceeds uniformly and that the end of the main sequence is reached when 10 per cent of the total hydrogen has been burnt. These assumptions for calculating the MS lives of the mergers are questionable as they mentioned in the paper. According to our calculations, almost all of the mergers have relatively short main-sequence lives, i. e. less than yr (see Fig.10). It means that five of the seven BSs are likely to leave the main sequence and no longer be observed as BSs at 4 Gyr. The range of age for M67 is likely to improve the result.
4.3 NGC 2660
| conditions | |||||
|---|---|---|---|---|---|
| case 1 | , yr | 268 | 59 | 70 | 11 |
| case 2 | , yr | 284 | 117 | 71 | 21 |
| case 3 | , yr | 296 | 631 | 72 | 126 |
| case 4 | , yr | 87 | 1038 | 21 | 220 |
| case 5 | , yr | 693 | 454 | 141 | 87 |
| case 6 | , yr | 703 | 525 | 149 | 106 |
| case 7 | , yr | 445 | 934 | 102 | 194 |
| case 8 | , yr | 87 | 1125 | 21 | 241 |
NGC 2660 is an intermediate-age open cluster with a solar metallicity. The early study by Hartwick & Hesser (1973) showed the following properties for this cluster: , , age Gyr, metallicity similar to the Hyades, and high possibility of membership for the N-type carbon star. There are some uncertainties for the determination of the cluster age, e.g. Lynga (1987) cited 1.6 Gyr, Jane & Phelps (1994) gave an age of 0.9 Gyr, while Carrio & Chiosi (1994) derived 0.7 Gyr. The latest report on this cluster is Sandrelli et al. (1999). It was shown that, metallicity about solar, , , age , with a fraction of binaries of about 30 per cent.
According to the new catalogue of blue stragglers in open clusters [2007], there are 8 BSs in this cluster while the cluster age is (about 1.1 Gyr). The turnoff is around for this age, indicating that AML in low-mass binaries has little influence on the product of BSs in this cluster. Table 6 presents our simulation results from different assumptions of the cluster age and by interpolating in Table A1.
Though we show the simulation results for and yr in Table LABEL:2660t, we should bear in mind that NGC 2660 is an intermediate-age cluster and a long is unreasonable for it from both observations and our models. Such a long as or yr will inevitably cause large differences of both components of a binary in our models, and therefore a shorter , namely, and yr, is more appropriate for this cluster. From Table LABEL:2660t we see that BS number is not sensitive to in this cluster, but the contact systems are very sensitive to , since a longer indicates a larger parameter space for these systems. Contact binaries exist in the cluster for all the cases in Table LABEL:2660t, but it is less than the BSs number produced from AS and AR when and yr, especially in case 1, it is just of 1/6 to 1/5 of that of BSs.
There are 150 stars on the main sequence to two magnitudes below the turnoff in NGC 2660 and 175 in NGC 2682, as shown in Ahumada & Lapasset [2007]. From this comparison, our models may produce the necessary BSs in NGC 2660 when . If for the binary sample, however, the produced BSs number from AS and AR is just 1/5 to 1/4 of that from . Normalization is necessary here to estimate the BSs birthrate from our models in this cluster and the same problem mentioned in section 4.2 appears here again. Nevertheless, our models may explain several BSs in this intermediate age cluster.
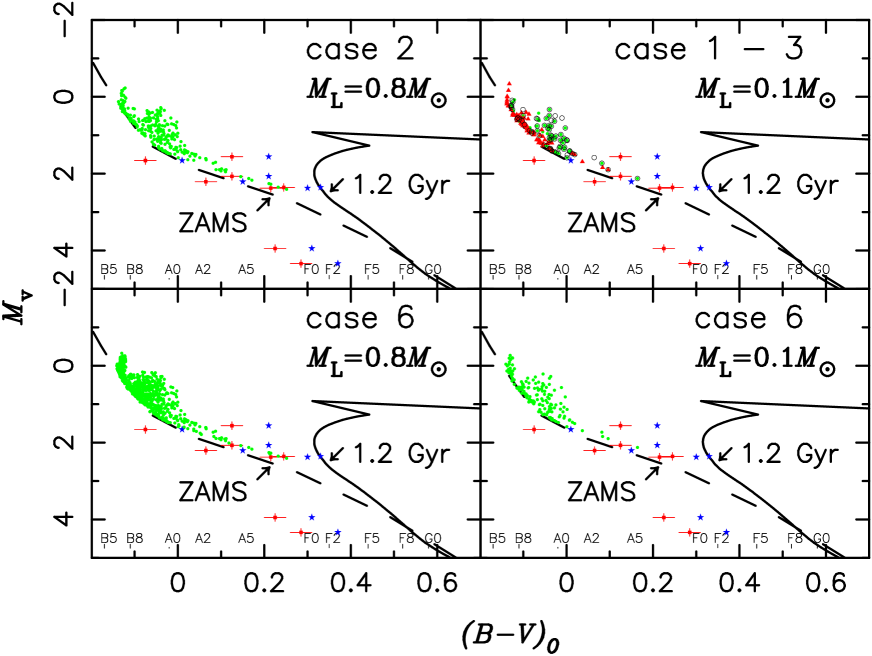
Figure 12 shows some examples from Monte Carlo simulation on CMD. The observed BSs [2007] and an isochrone () are also plotted in the figure. Several BSs are located in the region of our models from AS and AR. In the region with the most chance from our models , however, there are no BSs observed at present. The observed peak appears about , one magnitude lower than the theoretical value. Mass loss during merger process may shorten the discrepancies, but we should find out an appropriate mechanism to explain such a large mass loss about , which is much larger than that from observations and from smooth particle hydrodynamic simulations.
Though the BSs number (or birthrate) from our models is not sensitive to , the initial parameter space will change with , resulting in some differences for the mergers. In the upper right panel, we show the results from case 1 to case 3 with . As seen in this figure, the mergers from a long , i.e. yr, extend to a higher luminosity and concentrated on the ZAMS, but small differences appear between yr and yr.
We have not considered the effect of AML in this cluster, since we simply assume that the conservation assumptions are reasonable for stars with spectra from G0 (about ) to B1 according to Nelson & Eggleton [2001]. In fact, a main sequence star can generate a magnetic field as long as it has a sufficiently thick convective envelop, i.e. with a spectrum later than F8. In the study of Andronov, Pinsonneault & Terndrup [2006], the mass threshold for AML is between 1.2 and , then the total mass of the merger might be up to 2.4 and , above the turnoff of this cluster. So it could be possible that AML is also impacting the blue straggler population in this intermediate-age cluster. This provides another possible explanation for the magnitude offset from the models and observations.
5 DISCUSSIONS AND CONCLUSIONS
In Sect.4, we notice that the timescale from contact to complete coalescence, , strongly affects the initial parameter space of primordial binaries which eventually produce single BSs in a cluster. On the other hand, there are some conflicting estimates for from observations and theoretical models. In this paper we adopt empirical values, i.e. is short in comparison to the evolution timescale of both components in a binary, and ignore the changes during the merger process. In this section, we will first discuss the consequences of a long . Because of evolution of both components during the merger process, the primaries have lower central hydrogen content and the matter from the secondaries have larger He content. The former results in a redder colour for the mergers while the latter makes the mergers bluer. So the final positions of the mergers are possibly similar to those shown in this paper, except that the primaries have left the main sequence at final coalescence. This case will appear in the mergers with little central hydrogen. For example, a star with may evolve from ZAMS to exhausted of central hydrogen in yr, and then none of the mergers from binaries with primary’ masses larger than will be on the main sequence if yr. For the primaries with very little hydrogen in the center at contact, the mergers may never be on the main sequence even in the cases of short . The long also delays the appearance of the mergers and shortens their timescales on the main sequence. The latter has not been exactly expressed in our models, and therefore we just see that the mergers from a long have larger luminosities as shown in section 4.
In our binary evolutions, we have not included AML, which exists in low-mass binaries and may be the main course making the binaries change from detached to contact and finally coalesce, resulting in a large contribution to BSs in old clusters, e.g NGC 2682. In young and intermediate-age clusters, however, AML has little contribution to the birthrate of BSs, since (a) the time is not long enough for binaries to go from detached to contact and (b) the mass of the mergers is probably less than the turnoff of the cluster even though their parents may coalesce in the cluster age. So, we simply estimated the effect of AML in NGC 2682 while negecting it in NGC 2660.
The mass loss during the merger process can also affect our result, mainly the location on the CMD of the products. As shown in NGC 2660, no BSs have been observed in the region with the most opportunity from our models. Because of mass loss, the mergers will be fainter than those given in the paper. However the faintness will be slight since the mass loss is not vast from both observations and smooth particle hydrodynamic simulations [1996, 1997, 2001]. The lost mass may carry some angular momentum out from the parent binary. By analyzing the BS spectra from Hubble Space Telescope (there is an apparent continuum deficit on the short-wavelength side of Balmer discontinuity ), De Marco et al. [2004] argued that some BSs might be surrounded by a circumstellar disk. However, Porter & Townsend [2005] showed that the flux deficits may be attributed wholly to rapid rotation. The rotation rates needed are of the order of those found in the study of De Macro et al. [2005]. Whether the flux deficits shortward of the Balmer jump are induced by a circumstellar disk or rapid rotation, it provides a possible explanation for the orbital angular momentum of the system after coalescence. Such a large mass loss as shown in NGC 2660 (about ), however, is a problem and should be explained reasonably in physics.
Based on some assumptions, we studied the mergers of close binaries from AS and AR evolution by detailed evolutionary calculations. The products from our models may stay on the left of the ZAMS and have no central concentration with decreasing mass. Because of the development of the convective core, the mergers with little central hydrogen (less than 0.01) in our models have unusually long timescales on the main sequence ( yrs). These objects are probably subgiants as they are formed, since the primaries in the progenitors also have little central hydrogen and may have left the main sequence during merger process.
The mergers from our models stay on the main sequence for a timescale in order of yrs. Some low-mass mergers may stay on the MS for about yrs. The timescale is similar to that of W UMa stars from observations, and therefore we may roughly estimate the contribution to BSs from AS and AR via the number of W UMa systems in a cluster. The estimation, however, is not absolutely since both of the two timescales have wide ranges and large uncertainties, and we cannot rule out other methods for creating W UMa systems except for AS and AR. Comparison to observations indicates that our models (binary coalescence from AS and AR) are not important for the produce of BSs in old open clusters, while likely play a critical role in some younger open clusters.
We performed Monte Carlo simulations to examine our models in an old open cluster NGC 2682 and in an intermediate-age cluster NGC 2660. The effect of AML was estimated in NGC 2682 in a simple way, where the mergers are replaced with ZAMS models. In NGC 2682, binary mergers from our models cover the region with high luminosity and those from AML are located in the region with low luminosity, existing a certain width. The BSs from AML are much more than those from our models, indicating that AML of low mass binaries makes a major contribution to BSs in this cluster. Our models are corresponding for several BSs in NGC 2660. In the region with the most opportunity on CMD, however, no BSs have been observed. Our results are well-matched to the observations if there are of mass loss in the merger process, but a physical mechanism for this much mass loss is a problem.
6 ACKNOWLEDGMENTS
The authors thank R. S. Pokorny for his improvement in language. This work is supported by the Chinese National Science Foundation (Grant Nos. 06GJ061001 and 10433030), the Yunnan Natural Science Foundation (Grant No. 2004A0022Q) and the Chinese Academy of Sciences (Grant No. O6YQ011001).
References
- [2007] Ahumada J. A., Lapasset E., 2007, A&A, 463, 789
- [2006] Andronov N., Pinsonneault M. H., Terndrup D. M., 2006, ApJ, 646, 1160
- [2005] Bilir S., Karatas Y., Demircan O., Eker Z., 2005, MNRAS, 357, 497
- [2003] Bonatto Ch., Bica E., 2003, A&A, 405, 525
- [1996] Carraro G., Girardi L., Bressan A., Chiosi C., 1996, A&A, 305, 849
- [2003] Chabrier G., 2003, PASP, 115, 763
- [2004] Chen X., Han Z., 2004, MNRAS, 355, 1182
- [2005] Chen X., Han Z., 2005, ChJAA, 5, 65
- [2004] Davies M. B., Piotto G., De Angeli F., 2004, MNRAS, 349, 129
- [2004] De Macro, O., Lanz, T., Oueellette, J. A., Zurek, D., Shara, M. M., 2004, ApJ, 606, L151
- [2005] De Macro, O., Shara, M. M., Zurek, D., L Oueellette, J. A., Lanz, T.,Saffer, R. A., Sepinsky, J. F., 2005, ApJ, 632, 894
- [ 2006] Demircan O., Eker Z., Karatas Y. et al., 2006, MNRAS, 366, 2511
- [ 2002] Dryomova G. N., Svechnikov M. A., 2002, Ap, 45, 158
- [1989] Eggen O. J., Iben I. Jr., 1989, AJ, 97, 431
- [1971] Eggleton P.P., 1971, MNRAS, 151, 351
- [1972] Eggleton P.P., 1972, MNRAS, 156, 361
- [1973] Eggleton P.P., 1973, MNRAS, 163, 179
- [1983] Eggleton P.P., 1983, ApJ, 268, 368
- [1989] Eggleton P.P., Fitchett M. J., Tout C. A., 1989, ApJ, 347, 998
- [2000] Eggleton P.P., 2000, NewAR, 44, 111
- [1996] Fan X. et al., 1996, AJ, 112, 628
- [2003] Ferraro F. R., Sills A., Rood R. T., Paltrinieri B., Buonanno R., 2003, ApJ, 588, 464
- [1993] Friel E. D., Janes K. A., 1993, A&A, 267, 75
- [1994] Han Z., Podsiadlowski Ph., Eggleton P.P., 1994, MNRAS, 270, 121
- [1991] Hobbs L. M., Thorburn J. A., 1991, AJ, 102, 1071
- [2005] Hurley J. R., Pols O. R., Aarseth S. J., Tout C. A., 2005, MNRAS, 363, 293
- [2002] Hurley J. R., Tout C. A., Pols O. R., 2002, MNRAS, 329,897
- [1993] Iben, Jr. Ic., Livio, M., 1993, PASP, 105, 1373
- [1994] Janes K. A., Phelps R. L., 1994, AJ, 108, 1773
- [2004] Kafka S., Gibbs, D. G., Henden A. A., et al. 2004, AJ, 127, 1622
- [1980] Kippenhanhn, R., Ruschenplatt, G., Thomas, H.-C.,1980, A&A, 91, 175
- [ 1997] Lejeune T., Cuisinier F., Buesel R., 1997, A&AS, 125, 229
- [ 1998] Lejeune T., Cuisinier F., Buesel R., 1998, A&AS, 130, 65
- [ 2004] Lifang Li., Zhanwen Han, Fenghui Zhang, 2004, MNRAS, 355, 1383
- [ 2005] Lifang Li., Zhanwen Han, Fenghui Zhang, 2005, MNRAS, 360, 272
- [1996] Lombardi, J. C. Jr, Rasio, F. A., Shapiro, S. L., 1996, ApJ, 468, 797
- [1996] Maceroni C., van’t Veer F., 1996, A&A, 311, 523
- [2004] Mapelli M., Sigurdsson S., Colpi M. et al. 2004, ApJ, 605, L29
- [1990] Mateo M., Harris H., Nemec J., Olszewski E., 1990, AJ, 100, 469
- [1992] Mazeh T., Goldberg D., Duquennoy A., Mayor M., 1992, ApJ, 401, 265
- [1984] Mestel L., 1984, in Baliunas S. L., Hartmann L., eds., Cool Stars, Stellar Systems, and the Sun. Springer-Verlag, Berlin, p.49
- [ 2006] Micheal P., Kevin P. W., 2006, ApJL, 641, 137
- [1979] Miller G. E., Scalo J. M., 1979, ApJS, 41, 513
- [2004] Mochejska B. J., Stanek K. Z., Sasselov D. D. et al. 2004, AJ, 128, 312
- [2001] Nelson C. A., Eggleton P. P., 2001, ApJ, 552, 664
- [1998] Pols O.R., Schröder K.-P., Hurley J.R., Tout C.A., Eggleton P.P., 1998, MNRAS, 298, 525
- [1995] Pols O.R., Tout C.A., Eggleton P.P., Han Z., 1995, MNRAS, 274, 964
- [1994] Pols O. R., Marnus M., 1994, A&A, 288, 475
- [2005] Porter J. M., Townsend, R. H. D., 2005, ApJ, 623, L129
- [1998] Rucinski S. M., 1998, AJ, 116, 2998
- [1997] Sandquist E. L., Bolte M., Hernquist L., 1997, ApJ, 477, 335
- [2003] Sandquist E. L., Shetrone M. D., 2003, AJ, 125, 2187
- [1999] Sandrelli S., Bragaglia A., Tosi M., Marconi G., 1999, MNRAS, 309, 739
- [1997] Sills A., Lombaridi, J. C. Jr., 1997. ApJ, 105, 1081
- [2001] Sills A. et al. 2001. ApJ, 105, 1081
- [1995] Stepien K., 1995, MNRAS, 274, 1019
- [2006] Stepien K., 2006, AcA, 56, 199
- [1993] Stryker L. L., 1993. PASP, 105, 1081
- [2006] Tian B., Deng L., Han Z., Zhang X., 2006, A&A, 455, 247
- [1987] Tutukov A., Yungelson L., Comm. Astrophys. C., 1987, 12, 51
- [1972] Ulrich, R.,K., 1972,ApJ, 172, 165
- [2004] VandenBerg D. A., Stetson P. B., 2004, PASP, 116, 1012
- [1979] van’t Veer F., 1979, A&A, 80, 287
- [1994] van’t Veer F., 1994, Mem.S.A.It. 65, 105
- [1997] van’t Veer F., 1997, In: Kam-Ching Leung, eds., ASP Conf. Ser. Vol.130, the Third Pacific Rim Conference on Recent Development on Binary Star Reseach, p.57
- [1976] Webbink R. F., 1976, ApJ, 209, 829
- [1985]
- [1976] Webbink R. F., 1977, ApJ, 215, 851
- [1985] Webbink R. F., 1985,Stellar evolution and binaries, In Interacting Binary Stars, ed. J.Pringle and R. Wade (Cambridge: Cambridge University Press), p.39
- [2005] Xin Y., Deng L., 2005, ApJ, 619,824
Appendix A Evolutionary results in the paper
We choose a set of binaries undergoing AS and AR evolution from Nelson & Eggleton [2001] to study the characteristics of the merger products and their connections with blue stragglers. Table A1 gives the initial parameters of the binary systems, their RLOF information and the structures and evolutionary consequences of the mergers. The first three columns contain the initial mass of the primary , the initial mass ratio (the primary to the secondary) and the initial orbital period in logarithmic, where is given by (Nelson & Eggleton, 2001)
| (14) |
The fourth and fifth columns are the ages at which Roche lobe overflow begins () and the binary comes into contact () in our calculation. The next three columns show some system parameters at , i.e. the mass of the primary , the mass of the secondary and the orbital period . The remaining columns present the evolutionary results of the mergers: the lifetime on the main sequence (), the central hydrogen mass fraction of the merger as constructed () and after adjustment (), surface abundances for the elements H (), He () and the ratio of C/N at the surface ().