Spectral analysis of LMC X–2 with XMM/Newton: unveiling the emission process in the extragalactic Z-source.
Abstract
Aims. We present the results of the analysis of an archival observation of LMC X–2 performed with XMM/Newton. The spectra taken by high-precision instruments have never been analyzed before.
Methods. We find an X–ray position for the source that is inconsistent with the one obtained by ROSAT, but in agreement with the Einstein position and that of the optical counterpart. The correlated spectral and timing behaviour of the source suggests that the source is probably in the normal branch of its X-ray color-color diagram. The spectrum of the source can be fitted with a blackbody with a temperature 1.5 keV plus a disk blackbody at 0.8 keV. Photoelectric absorption from neutral matter has an equivalent hydrogen column of . An emission line, which we identify as the O VIII Lyman- line, is detected, while no feature due to iron is detected in the spectrum.
Results. We argue that the emission of this source can be straightforwardly interpreted as a sum of the emission from a boundary layer between the NS and the disc and a blackbody component coming from the disc itself. Other canonical models that are used to fit Z-sources do not give a satisfactory fit to the data. The detection of the O VIII emission line (and the lack of detection of lines in the iron region) can be due to the fact that the source lies in the Large Magellanic Cloud.
1 Introduction
Low Mass X-ray Binaries (LMXBs) are binary systems harboring a compact object accreting mass from a late-type star. Systems hosting a weakly magnetized neutron star (NS) are usually divided into two classes: the Z sources, with luminosities close to the Eddington luminosity, , and Atoll sources, usually with lower luminosities of . This classification relies upon the correlated X-ray spectral and timing properties, namely the pattern traced out by individual sources in the X-ray color-color diagram (CD, Hasinger & van der Klis 1989). The seven known (Galactic) Z sources usually describe a complete Z-track in the CD on timescales of a few days, while Atoll sources cover their pattern on the CD on a longer timescale (usually several weeks).
The correlated spectral and timing variability of LMC X–2 has suggested its classification as a Z-source (Smale & Kuulkers 2000). An extensive study of these characteristics, using data taken with the PCA on board RXTE, has allowed to observe the complete Z-track in the CD which is completed in about 1 day (Smale, Homan & Kuulkers 2003). Smale & Kuulkers (2000) found evidence of a periodicity of which they tentatively ascribe to an orbital period. A similar orbital period modulation has been found by Cornelisse et al. (2007) in the VLT optical lightcurve of the companion. From the shape of the Z-pattern described in the CD, it was inferred that LMC X-2 falls squarely into the category of the so-called “Sco-like” Z-sources due to its common characteristics with Sco X-1 (Smale et al. 2003). Its very high luminosity (; Markert & Clark 1975; Johnston, Bradt & Doxsey 1979; Long, Helfand & Grabelsky 1981; Bonnet-Bidaud et al. 1989; Christian & Swank 1997; Smale & Kuulkers 2000) makes it the brightest LMXB known together with Sco X–1. There are other analogies with Sco X–1: the optical counterpart is a faint, , blue star (similar to the optical counterpart of Sco X–1), and both sources show a similar correlation between the optical and the X-ray lightcurve during flares (McGowan et al. 2003). In some ways, we can consider LMC X–2 an extragalactic twin to Sco X–1. Measurement of Doppler effect on emission lines in the Bowen region allowed Cornelisse et al. (2007) to constrain the mass ratio of LMC X-2 to be .
However, there is no recent X-ray spectral study of this source: a spectral analysis has been carried out by Bonnet-Bidaud et al. (1989) using EXOSAT data, where the spectrum of the source was fitted with a model consisting of a blackbody plus a thermal bremsstrahlung (), or alternatively with a comptonized thermal model with . They found no detectable feature in the Fe K- range. In their survey of Low Mass X-Ray Binaries with Einstein, Christian & Swank (1997) report that a fit in the 1-20 keV band with an unsaturated Comptonized model (i.e. a cutoff power-law) gave a reasonable fit with and . Schulz (1999), using ROSAT data in the 0.1–2.4 keV band, fitted the data using a blackbody with a temperature plus a thermal bresstrahlung model with a temperature of . Also, a gaussian emission line at 0.9 keV was evident in the spectrum. The accuracy of this study is obviously limited by the narrow band and the relatively poor spectral resolution of ROSAT. Smale & Kuulkers (2000) studying RXTE/PCA data of the source found that the data can be well described by a cutoff power-law (e.g. a completely Comptonized component) with a cutoff temperature of , or by a blackbody plus bremsstrahlung model with keV, keV. In this case the blackbody accounts for about 20% of the total emission: as the authors point out, however, this model is not physically realistic given the enormous emitting volumes required for the bremsstrahlung emission.
These low-resolution spectra differ noticeably from the X-ray spectra of other Z-sources, which are usually described in terms of a two-component model. The spectral models of Z-sources usually follow one of two main paradigms: the Eastern model (Mitsuda et al. 1989), in which the spectrum of the source is interpreted as a sum of an emission coming directly from the compact object (Comptonized or not) plus a blackbody emission from the disc, and the Western model (White et al. 1986), where the emission is due to a hot blackbody coming from the central source, plus a Comptonized component that is due to the emission from an accretion disc corona surrounding the disc (no direct thermal emission from the disc is seen as photons emitted there are reprocessed and Comptonized in the corona).
Broad emission lines (FWHM up to keV) at energies in the range 6.4 – 6.7 keV have been observed in the spectra of all galactic Z-sources, with the noticeable exception of GX 5-1 (Asai et al. 1994). These lines are identified with the K radiative transitions of iron at different ionization states. Sometimes an iron absorption edge at energies keV has been detected (see e.g. Di Salvo et al. 2001).
In this paper we analyze an archival XMM/Newton observation of LMC X–2, which gives us the opportunity to perform the first high resolution spectral study available to date on this source.
2 Observation and data analysis
XMM/Newton (Jansen et al. 2001) has observed LMC X-2 between 2003-04-21, 20.21:03 and 2003-04-22, 03:03:58. The source was observed in High event rate mode with both the Reflection Grating Spectrometers (RGS1 and 2, den Herder et al. 2001) for a common exposure time of ks. The EPIC-PN camera (Strüder et al. 2001) observed the source in Small Window mode with Medium filter, for a total exposure of 11.2 ks. Of the two MOS, only MOS2 data in Fast Uncompressed mode are available, for a mere 457 s of exposure.
The OM data are available and an optical counterpart candidate is detected in all three bands (UVW1,UVW2, UVM2), from which we can deduce the instrumental magnitudes. However, recent VLT data have been observed by Cornelisse et al. (2007) and surely gave more interesting information than what could be achieved with the OM; we, therefore, do not consider the OM data in this paper any further as it would not contribute significantly to our scientific results.
The raw, full bandpass average count rates are 3.7, 4.6 cts/s for RGS1 and RGS2 (0.2-2.1 keV), and 120 cts/s for Epic-PN (0.15-15.0 keV). This means that, given the use of the small window mode, any pileup issue is avoided for this source. In all of our data reduction and analysis we used the latest available software packages, i.e. SAS version 7.0, Heasoft 6.2 and Xspec 11.3.2ad.
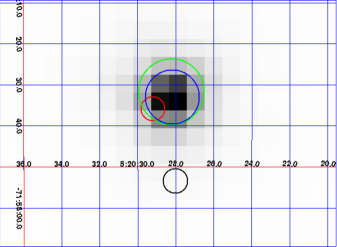
2.1 X-ray position
We extracted the PN image of the source (see figure 1) using the standard techniques described by the SAS online documentation111Available at http://xmm.esac.esa.int/sas/7.0.0/documentation/threads/: first of all, we looked for strong particle background intervals in the data, and found that there is no contamination to the data. Next, we extracted the image of the source using the xmmselect program that is part of the SAS distribution. The EPIC-pn image allowed us to determine the coordinates of the source (J2000) . While this position (given the error on the position obtained from the EPIC-pn image, arcsec or 1.5 pixels in the image, coincident with the nominal image resolution of the instrument) is in agreement with the one of the optical counterpart (Pakull, 1978), and with the X-ray position obtained with Einstein (Long et al., 1981), it differs significantly ( arcseconds) from the ROSAT position (Fuhrmeister & Schmitt, 2003). We can therefore assume that the position we determined is the more accurate X-ray position actually available.
2.2 Timing properties
Following the standard techniques, we extracted the background-subtracted lightcurve for the EPIC-PN: even if taken at different bin scales, the PN lightcurve, although it shows some variability (in particular in the final part of the observation), this variability is not as strong as one would expect if the source was in the so-called flaring branch, as can be seen from figure 2.

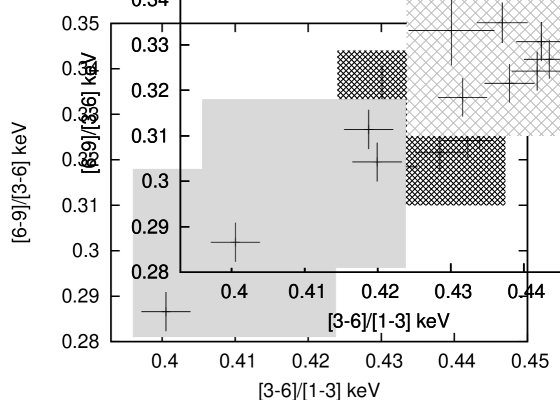
Interestingly enough, while the count rate remains almost the same during the whole observation, the PN color-color diagram shows a slight drift during the observation towards higher values of both the soft and the hard color (defined as the ratio of the count rate in the range 3–6 keV to the count rate in the range 1–3 keV, and as the ratio the count rate in the range 6–9 keV to the count rate in the range 3–6 keV, respectively), as can be seen from figure 3.
Although the statistics is poor, we were able to extract a low-frequency power spectrum in order to obtain information on the very low frequency noise. We fitted the white noise-subtracted power spectrum with a power law and found , with (see figure 4). Given the value of , which is significantly higher than 0.6, the value found by Smale et al. (2003) in the Horizontal Branch, and the drift of the source in the CD, we can affirm that the source is either in the Normal or the Flaring Branch, as confirmed by the relatively high luminosity state (see below). Moreover, the relatively constant count-rate (see figure 2) suggests that the source is not in the Flaring Branch, as in that state frequent and intense flares are normally seen (Smale et al. 2003). This is also confirmed by the value of rms, which is compatible with what found by Smale et al. (2003) in the Normal Branch or in the Horizontal Branch, but not with the higher value () found in the Flaring Branch.

2.3 Spectral fitting
In order to verify if the drift in the CD affected significantly the continuum model, we divided the observation into two parts according to its movement along the color-color diagram (see the shadowed portion of figure 3, and extracted spectra for the two zones separately, in order to fit toghether the most spectrally homogeneous data. In extracting the spectra we followed again the standard SAS recipe for point-like sources. However, we found that the two PN spectra could be fit together with little discrepancy, and no statistically significant variation was found between the spectral fits of the two zones. This means that the spectral variability of the source is not accentuated enough to introduce sensible differences.
Given this result, we decided to extract a single spectrum from the whole dataset. Therefore we run the standard extraction tool software again and accumulated background subtracted spectra for both the PN and the two Reflection Grating Spectrometers222We discarded MOS data given the very short exposure.. In extracting RGS spectra, we kept into account the exact source position we determined from the PN image analysis.
In the PN, we verified the absence of flaring particle background extracting an high-energy (10-12 keV) lightcurve, where the source shows a steady count rate of 4 count/s, showing no particular flaring activity; this means that any particle background is not important for this high-flux source. We selected photons coming from a circular region of centered on the brightest pixel (the source coordinates), and for the background we selected photons from a region of the same shape and area in a blank sky region near the source, with the center on the same detector row as the source area. For RGS 1 and 2 the spectra were extracted using the standard pipeline, indicating the our newly refined position. All spectra were rebinned in order to have at least 25 counts per channel, so that we are allowed to use the statistics.
We decided to use RGS data in the standard energy range keV, and PN data in the keV energy range. We fitted these spectra to a two-component model constituted by a blackbody plus a bremsstrahlung component, which is the only two component model which gave a satisfactory fit to EXOSAT (Bonnet-Bidaud et al. 1989), ROSAT (Schulz 1999) and RXTE data (Smale & Kuulkers 2000)333Einstein data were not fitted to such a model (Christian & Swank 1997), but only to a cutoff power-law model. Such a model is discussed below.. Both components were modified by photo-electric absorption from neutral matter, and a normalization constant was introduced in order to account for uncertainties in the cross-calibration between instruments. We found that the model gave a fit that, although not rejectable statistically (), is not satisfactory if one looks at its residuals: the PN residuals clearly show sign of a poor fit of the continuum, as they jiggle around the zero residual line (see figure 5).
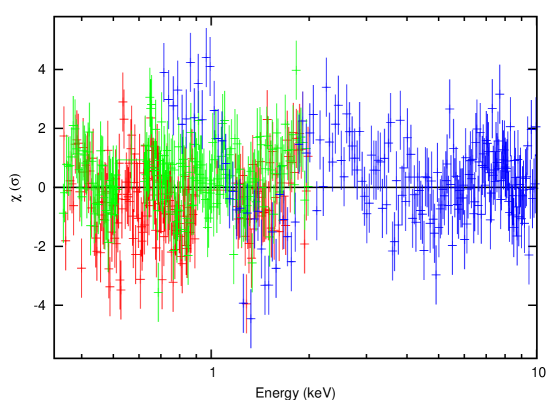
In particular, these residuals show that there is a strong mismatch between the two RGSs and the EPIC PN below 1.3 keV. This is probably due to calibration issues of the PN for bright sources (see e.g. Boirin & Parmar 2003). We therefore decided to use PN data limiting ourselves to the 1.3-10.0 keV range.
Using this reduced spectral range for the PN, we found that the data could be fitted well with this two-component model: we found a blackbody temperature of keV and a bremssstrahlung temperature of keV (see Table 1 for detailed results of all fits). The resulting blackbody radius is km444All quantities through this section are derived for a distance of the source of 50 kpc., while the radius of the bremsstrahlung emitting region is km; the blackbody accounts for about of the total luminosity. We found evidence in the residuals for an emission line at keV, which we identify with a Ly- emission line from O VIII with an equivalent width of 2.5 eV (see figure 7, table 1 for details). Although the above described two-component model gives a satisfactory fit to the data, it is not physically reasonable: first of all, the emission region for the bremsstrahlung component is presumably orders of magnitude larger than the whole system, which is, assuming NS mass of 2 M⊙ and a mass ratio of 0.4 (Cornelisse et al 2007), in the order of km. Moreover most of the emission should come from that component, while one would expect that at least half of the emission would come from the direct emission from the compact object (e.g. the blackbody). We searched therefore for an alternative model to fit the data.
We firstly fitted the spectra to a simple model made of a comptonized component: Bonnet-Bidaud et al. (1989), Chiristian & Swank (1997) and Smale & Kuulkers (2000) used a simple cutoff powerlaw model to fit data of the source. Using such a simple model to fit our data, however, proved to be impossible since the power-law index we obtain is below 1 ,so that this powerlaw does not describe a Comptonized component: implies which is impossible. Thus we tried to fit the data to a more complex comptonized model, described by compTT model inside xspec, plus photo-electric absorption from neutral matter and the O VIII Lyman- emission line. This model is statistically as good as the preceding one (the is 5571/5404), but the parameters of the Comptonized component are quite unusual if compared to what found in other Z-sources: we find a seed photons temperature between 10 and 50 eV, an electron temperature of keV and an optical depth value of , while normally in Z-sources the seed photons (and the Comptonizing electrons) are hotter, and the optical depth is of the order of 10. The Wien’s radius of the seed photons, although poorly constrained, is in the order of 104 km. This would suggest that the emission we see comes from an extended corona, while direct emission from the compact object is completely shadowed.
The single-Comptonized component model resembles somewhat to the “Birmingham model”, where the emission of the central source is described by a blackbody and the rest of the emission comes from an accretion disc corona. This model has recently been applied to Z-sources (Church et al. 2006). We then tried to fit the data to a two-component model constituted by a blackbody and a cutoff powerlaw, to test if the Birmingham model was also acceptable. We found that, although this model could fit well the data, the cutoff powerlaw index is again below 1, so that this powerlaw does not describe a Comptonized component. If we try to fix the power-law index to values common in fits of spectra of other Z-sources, like 1.9 (Sco X–1, Barnard et al. 2003) or 1.7 (GX 340+0, Church et al. 2006), the fit we obtain to the data is unstable, as the high energy cutoff becomes larger than 15 keV and is unconstrainable; moreover, the residuals jiggle significantly around zero and the corresponding , is very high compared to the one found with other models.
We found that data could also be fitted by a conventional “Eastern model”, which is often used to describe the X-ray spectra of Z-sources. In particular, we fitted the data with a two-component model constituted by a blackbody and a disk blackbody, modified by photo-electric absorption from neutral matter and the O VIII Ly- emission line. This model is again not statistically worse than the former two (we obtain ). In this case, we find a blackbody temperature of keV, a radius of km and a luminosity of 555In the whole paper, luminosities are calculated in the 0.1-10 keV energy range, for a distance of 50 kpc., while the disk emission accounts for the remaining () of the emission with an inner disk temperature of keV and a lower limit on the inner radius of 27.5 km. Full results, toghether with corresponding errors are reported in Table 1.
No residuals could be noticed in the iron K- region, confirming the result obtained by Bonnet-Bidaud et al. (1989). Since feature in that spectral range are usually present in Z-sources, it could well be possible, in line of principle, that the short exposure time did not allow to accumulate the statistics required to show a significant iron line. To test this, we added to the best-fit models a gaussian emission line with a fixed energy of 6.7 keV and of 200 eV(which is quite typical of lines found in Z-sources). We found that, considering the upper limit on the line flux (at 90% confidence), the equivalent width of the line is eV, which is about half of the lowest equivalent width found, for example, in BeppoSAX observations of Cyg X–2 (Di Salvo et al. 2002).
The total luminosity () of the source is, for all the models, , that is at least times the Eddington luminosity for a NS (we assumed a pure hydrogen accreting column, which is a reasonable assumption given the low metallicity of stars in the LMC). In all our calculations we assumed a distance of 50 kpc (Feast 1999).
| Model | blackbody + | comptt | blackbody + | Birmingham |
|---|---|---|---|---|
| bremsstrahlung | disk blackbody | Model | ||
| NH (1020 cm-2) | ||||
| kTbb (keV) | - | |||
| Rbb (Km) | - | |||
| Lbb (erg/s) | - | |||
| kTw (keV) | - | - | - | |
| kT2 (keV) | 7.72 | |||
| - | 23.1 | - | - | |
| Rw (km) | - | - | - | |
| Rbr (km) | 3.7e+8 | - | - | - |
| Rdiskbb (Km) | - | - | - | |
| - | - | - | ||
| PL norm | - | - | - | |
| Ltot (erg/s) | ||||
| Eline (eV) | ||||
| (eV) | 5(fixed) | 5(fixed) | 5(fixed) | 5(fixed) |
| Eqw (eV) | 2.53 | 2.61 | 2.9 | 2.86 |
| (d.o.f.) | 5534 (5404) | 5571(5404) | 5555 (5404) | 5485 (5403) |
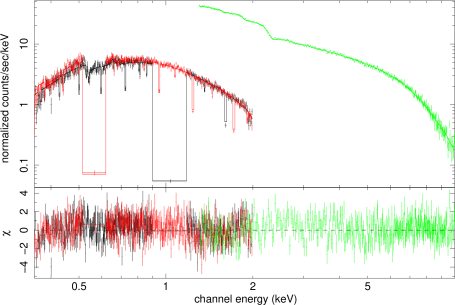
As can be seen from figure 6, using the “eastern-like” model the fitting is good enough and no other significant local feature is present in the spectra.
3 Discussion
We have fitted the spectrum of LMC X–2 taken with the EPIC-PN and RGS instruments on board XMM/Newton with four different two-component models which describe completely different physical processes. Since they are all statistically acceptable, in order to choose a best-fit model we should inspect which one looks as the most physically reasonable.
The first model is constituted by blackbody plus a bremsstrahlung component. This model is clearly unphysical as the bremsstrahlung emission region is km, which is more than one order of magnitude larger than the orbital separation for a system with an orbital period of 30 ks. We can therefore safely discard this model without any further discussion.
The second model involves a single, thick Comptonized component with a large Wien radius of the emitting region, of the order of km. It is possible that the emission from the inner parts of the system are somehow ’obscured’ by the matter that is ejected from the system due to Eddington-limit accretion. Thus the Comptonized component we see originates by the reemission of radiation from the outer parts of the matter cloud that forms in the central zone of the disk. In this hypothesis, the system should be seen nearly edge-on, as the central source is almost completely obscured by disk matter, inflated in the central regions of the system. It is anyway hard to believe that the total luminosity we get (about 1-2 times the Eddington luminosity) can come from a region that far from the central compact object. Moreover, the system should be seen completely edge-on, but no eclipse or X-ray dip has been observed so far in the LMC X–2 lightcurve (Smale & Kuulkers 2000).
The Birmingham model, is not able to fit the data satisfactorily, since the component described by a cutoff power-law is incompatible with a Comptonized spectrum (the power-law index is below 1), and if we fix the value of the power-law index we cannot constrain the cutoff energy due to the narrow band of XMM/Newton.
Since all other models are physically unreasonable for one reason or another, the only model that fits satisfactorily the data consists of a blackbody at 1.5 keV and a cooler disk blackbody at 0.8 keV (Eastern Model), that is the emission is dominated by the radiation coming from the central source, plus a blackbody component due to the thermal emission of the disk. The hot component coming from the compact object (or from the boundary layer between the disc and the compact object), in this case is well described by a blackbody emission. This means that Comptonization of the boundary layer emission is not detected in the emission of LMC X–2. This blackbody is relatively hot, is the origin of most of the emission from the source ( of the unabsorbed luminosity, see table 1), and has a radius that approaches the neutron star radius: we find a blackbody radius , which means that, after applying proper the general relativistic change of coordinates, the emission radius in the local coordinate system of the NS is . The cooler disk blackbody that describes the emission from the accretion disc has an inner emission radius lower limit of km, which is almost surely larger than the inner disc radius given the extremely high luminosity (and thus accretion rate) of the source: the inner disc radius for a source accreting at the Eddington limit is typically at (or very near to) the surface of the NS. This means that we do not see any emission from the innermost parts of the disc. This could be explained with the obscuration of that part of the disc due to ejection of matter at the Eddington limit. According to the classic paper on accretion disk structure by Shakura & Sunyaev (1973) and to more recent works (see e.g. Miller & Lamb 1993), the inner parts of a disc at supercritical accretion rates is inflated by radiation pressure, that becomes dominant at the so-called spherization radius (Shakura & Sunyaev 1973)
that in this case in placed at km from the compact object.
This model has been widely used to describe the spectra of Z sources, although often the emission of the central source is Comptonized (see e.g. Di Salvo et al 2000, Di Salvo et al 2001, Di Salvo et al. 2002). This model of the geometry of emission is often opposed to the Birmingham model, where the emission is described by a blackbody coming from the boundary layer of the disk with the compact object, plus a comptonized component describing the emission of an extended accretion disc corona, which is usually fitted with a cutoff powerlaw, where the cutoff energy is equal to the temperature of the scattering electrons cloud. We have shown that the Birmingham model, which has been used to fit the low-resolution spectra of several Z-sources (Sco X–1, Barnard et al. 2003; GX 340+0, Church et al. 2006), cannot give a good fit of the spectrum of LMC X–2. This could be due to the fact that at the high accretion rates that we have in LMC X–2, the thermal emission of the accretion disc dominates over any emission from an accretion disc corona.
3.1 Discrete spectral features
LMC X–2 is the second, among the 8 Z-sources, which does not show any emission feature in the Fe region (after GX 5-1, Asai et al. 1994).We have shown that it is not likely that the non-detection could be due to the lack of statistics. The absence of this feature in the spectrum could then be due to the lower metallicity of the stars in LMC () compared to the mean metallicity of the stars in our galaxy (): if the donor is less abundant in heavy elements, so is the disc and thus any emission line will be fainter as well by roughly the same proportionality factor.
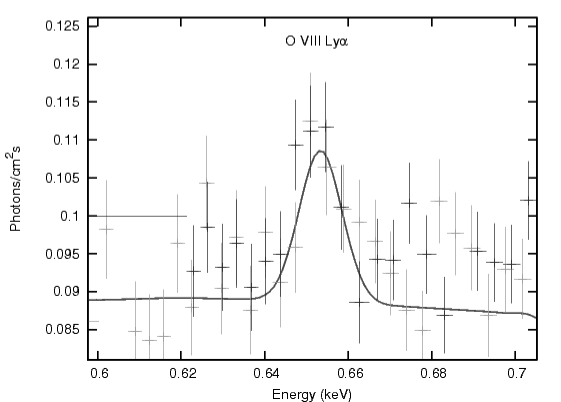
On the other hand, we detect for the first time in a Z-source, a O VIII Ly- emission line with a significance of 4.4 (see figure 7). The energy of the emission line is perfectly compatible with the rest-frame energy of the O VIII Ly transition energy (653.4 eV).
This emission line could be present in most Z-sources as O is more abundant than heavier elements in the donor star, but is normally undetected due to the strong absorption by neutral matter that is present in all Galactic Z-sources, as they lie relatively near the galactic center. In the case of LMC X–2, the absorption due to neutral matter is more than an order of magnitude lower than for Galactic sources, and this can explain why we do detect this line, while we do not detect any other emission line at higher energies probably due to the low metallicity of LMC stars.
4 Conclusions
We have analyzed an archival XMM/Newton observation of LMC X–2, which allowed us to redetermine the position of the source with respect to the value reported in the Rosat All Sky Survey catalog. The source was probably in the normal or in the flaring branch, as its timing characteristics and high luminosity (exceeding the Eddington limit) exclude that the source is in the horizontal branch. Analyzing the spectra of the 3 active instruments we found that they could be well fitted by a two component model (blackbody plus disk blackbody) plus an emission line at 653 eV, which is identified as an O VIII Ly- emission line. On the contrary, the iron region lacks any emission line. As discussed, this can be caused by the low metallicity of the stars in the LMC.
Acknowledgements.
We thank the referee for useful suggestions that improved our paper. This work was supported by the Ministero della Istruzione, della Università e della Ricerca (MIUR) and by the Agenzia Spaziale Italiana (ASI).References
- Asai et al. (1994) Asai, K. et al. 1994, PASJ, 46, 479
- Barnard et al. (2003) Barnard, R., Church, M.J. & Balucińska-Church, M. 2003, A&A, 405, 237
- Boirin & Parmar (2003) Boirin, L. & Parmar, A.N. 2003, A&A, 407, 1079
- Bonnet-Bidaud et al. (1989) Bonnet-Bidaud, J. M., Motch, C., Beuermann, K., Pakull, M., Parmar, A. N., & van der Klis, M., 1989, A&A, 213, 97
- Christian & Swank (2006) Christian, D.J., Swank, J.H., 1997, ApJS, 109, 177
- Church et al. (2006) Church, M.J., Halai, G.S., & Balucińska-Church, M. 2006, A&A, 460, 233
- Cornelisse et al. (2007) Cornelisse, R.,Steeghs, D., Casares, J., Charles, P. A., Shih, I. C., Hynes, R. I., O’Brien, K., 2007, MNRAS, 381, 194
- den Herder et al. (2001) den Herder, J.W., et al., 2001, A&A, 365, L7
- Di Salvo et al. (2000) Di Salvo, T., et al 2000 ApJ,554, 49
- Di Salvo et al. (2001) Di Salvo, T., Robba, N.R., Iaria, R., Stella, L., Burderi, L. & Israel, G.L. 2001, ApJ,554, 49
- Di Salvo et al. (2002) Di Salvo T., et al 2002, A&A,386, 535
- Feast (1999) Feast, M. 1999, in New Views of the Magellanic Clouds, IAU Symposium #190, Edited by Y.-H. Chu, N. Suntzeff, J. Hesser, & D. Bohlender
- Fuhrmeister & Schmitt (2003) Fuhrmeister, B. & Schmitt, J.H.M.M. 2003, A&A, 403, 247
- Hasinger & van der Klis (1999) Hasinger, G. & van der Klis, M. 1989, A&A, 225, 79
- Jansen et al. (2001) Jansen, F., et al., 2001, A&A365, L1
- Johnston et al. (1979) Johnston, M.D., Bradt, H.V. & Doxsey, R.E. 1979, ApJ, 233, 514
- Kuulkers et al. (1996) Kuulkers, E., van der Klis, M. & Vaughan, B.A. 1996, A&A, 311, 197
- Long et al. (1981) Long, K.S., Helfand, D.J. & Grabelsky, D.A. 1981, ApJ, 248, 925
- Markert & Clark (1975) Markert, T.H. & Clark, G.W. 1975, ApJ, 196, L55
- Mc Gowan et al. (2003) McGowan, K.E., Charles, P.A., O’Donoghue, D. & Smale, A.P. 2003, MNRAS, 345, 1039
- Mitsuda et al. (1989) Mitsuda, K. et al. 1989, PASJ, 41, 97
- Pakull (1978) Pakull, M. 1978, IAU Circ., 3313, 2
- Schulz (1999) Schulz, N.S. 1999, ApJ, 511, 304
- Shakura & Sunyaev (1973) Shakura, N. I. & Sunyaev, R. A. 1973, A&A, 24, 337
- Smale & Kuulkers (2000) Smale, A.P., & Kuulkers, E. 2000, ApJ, 528, 702
- Smale et al. (2003) Smale, A.P., Homan, J. & Kuulkers, E. 2003, ApJ, 590, 1035
- Strüder et al. (2001) Strüder, L., et al., 2001, A&A, 365, L18
- White et al. (1986) White, N.E. et al. 1986, MNRAS, 218, 129