Search for Higgs Bosons in H to WW Decays at the Tevatron
Abstract
We present the results of searches by the CDF and DØ Collaborations for Higgs boson production in collisions at . The searches are performed in the channel with of data. In the absence of signal the results are used to set a limit on the Higgs production cross section times branching ratio.
pacs:
14.80.BnStandard-model Higgs bosons and 13.85.RmLimits on production of particles1 Introduction
The Higgs boson, the last undiscovered particle of the standard model, explains the origin of mass and electro-weak symmetry breaking. Within the standard model the only free parameter of the Higgs boson is its mass . The combination of precision measurements indicates that its mass should be less than LEP2 . Previous direct searches at LEP have set a lower limit on the Higgs mass at LEP1 . Here we present the result of searches in the decay channel, which covers the whole range of allowed Higgs masses and is particularly sensitive in the high mass range.
The main signature of the decay channel is two leptons of opposite charge and missing transverse energy caused by the neutrinos escaping the detector undetected.
2 The DØ measurement
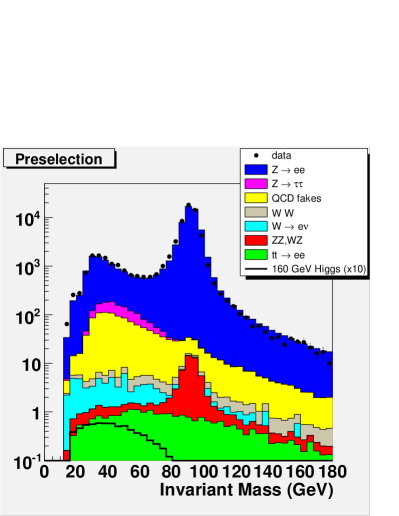
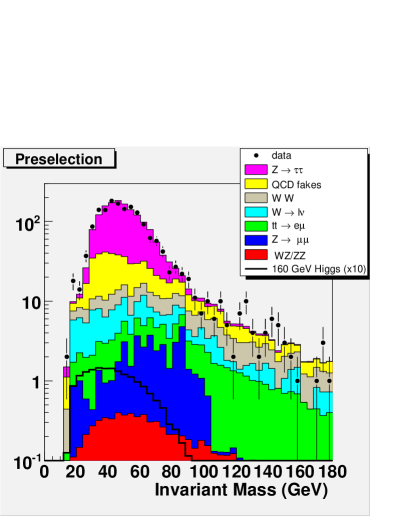
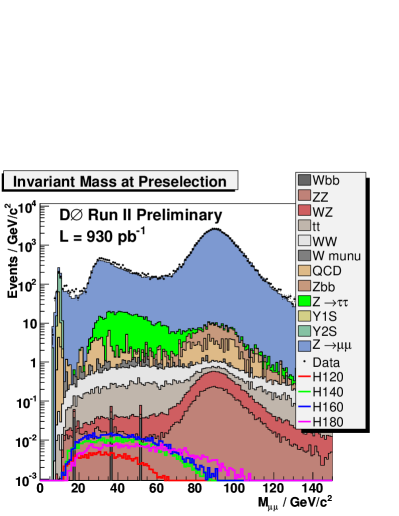
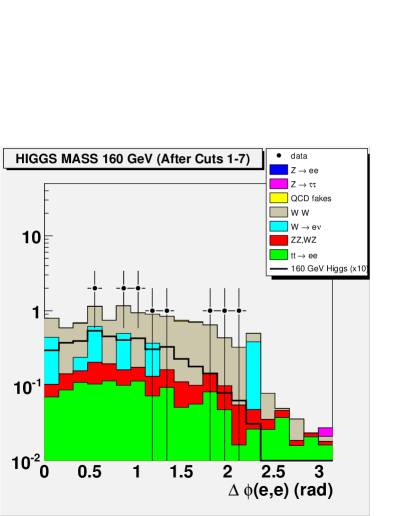
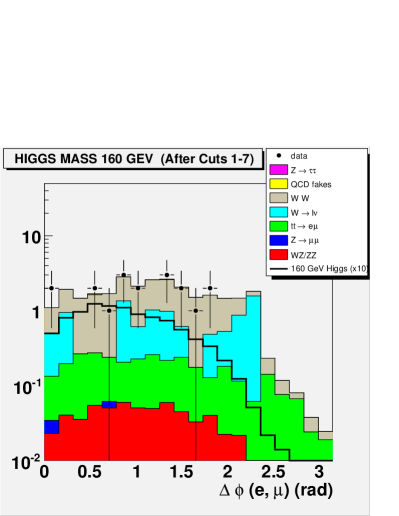
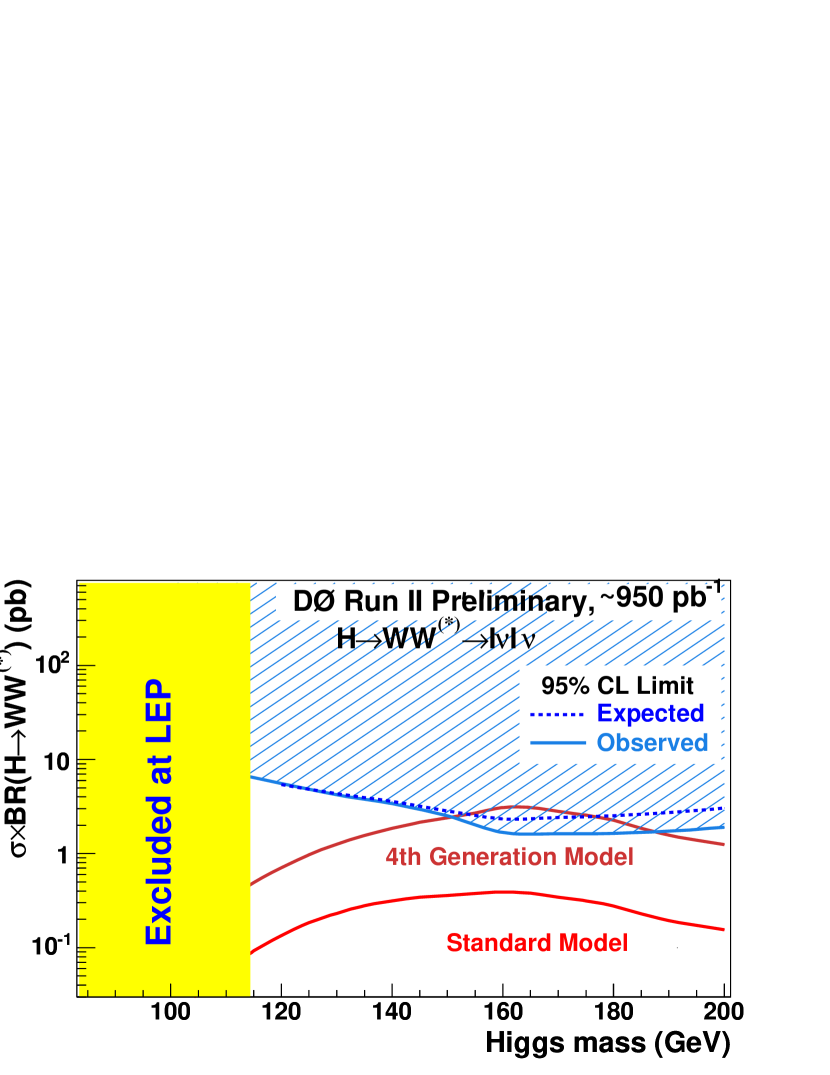
The DØ measurement uses a simple cut-based analysis D0A D0B . The cuts are listed in Table 1. Control plots for the data sample are in Figure 1. To avoid the uncertainties associated with the luminosity measurement, the background is normalized to the mass peak which is calculated at NNLO and fitted to the observed data. The final selection variable is the between the two leptons. The distribution of that variable after applying all selection cuts can be seen in Figure 2. No excess over background is observed and the data are used to set a limit on the Higgs production cross section (Figure 3).
3 The CDF measurement
CDF has performed two measurements in this channel, both of them using multivariate techniques. The first one uses a neural network approach CDFNN and the second one uses a matrix element technique CDFME . These techniques are complementary and work is being performed to integrate them into a combined limit. By construction, the matrix element method only takes leading order effects into account, while the neural network approach can also take into account next-to-leading-order effects as emulated by the parton shower models.
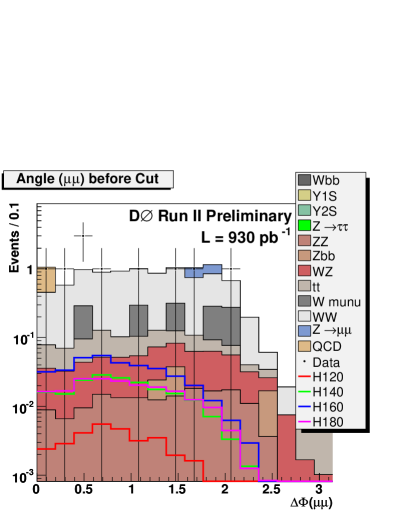
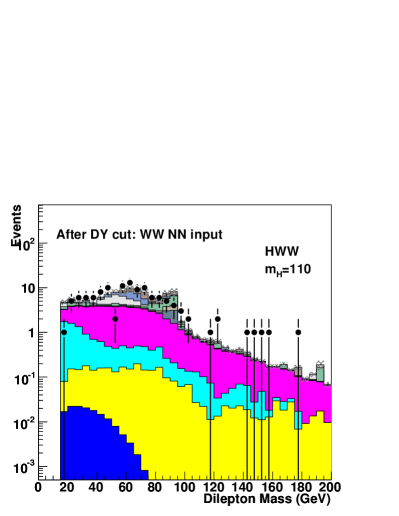
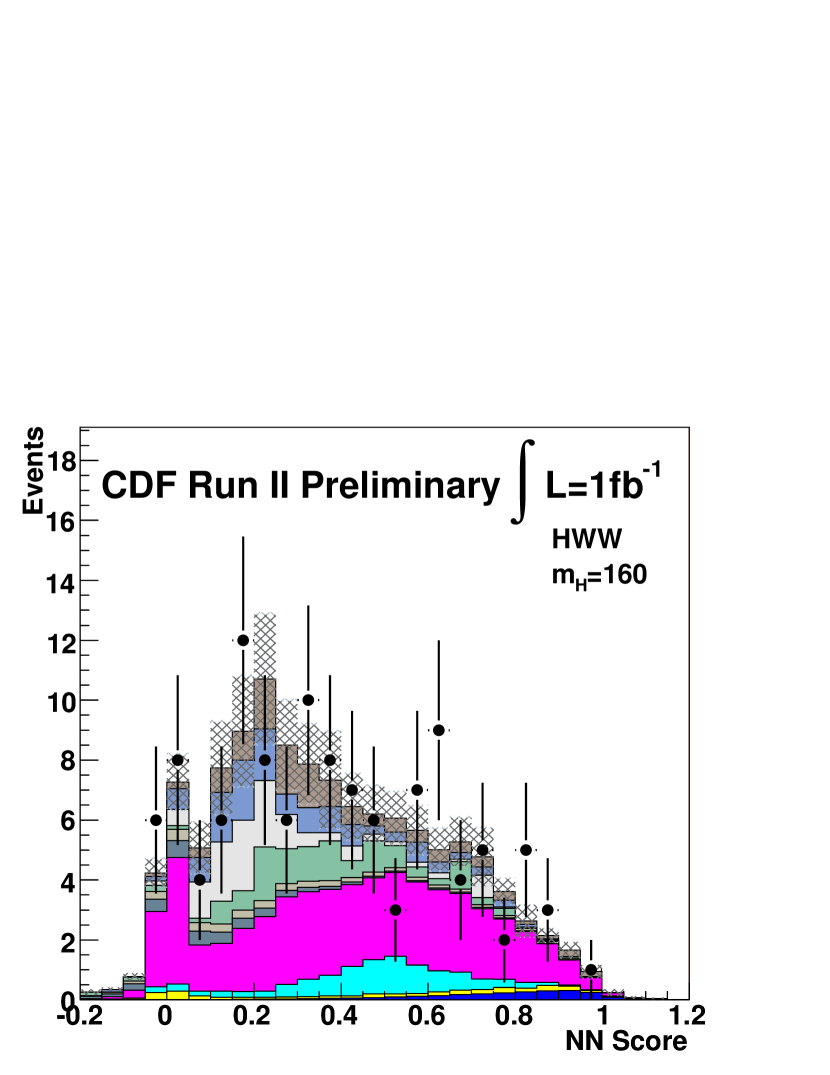
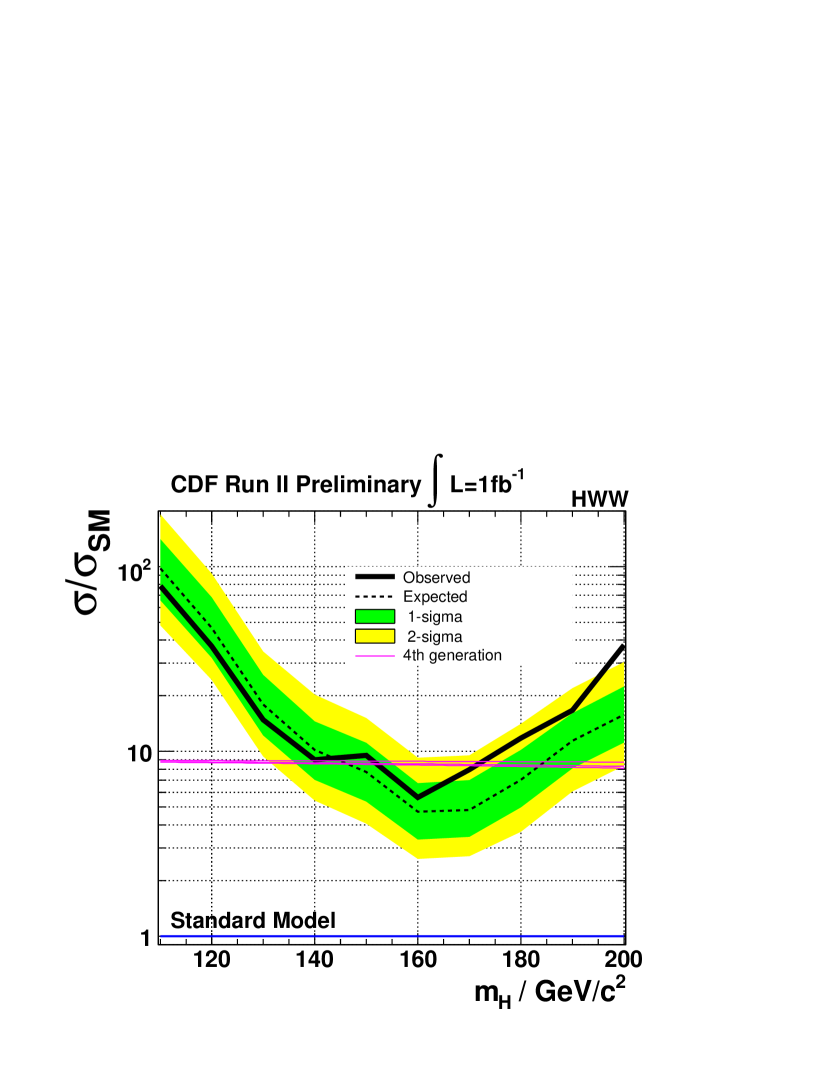
The neural network analysis uses the cuts in Table 2. Control plots for the event selection can be seen in Figure 4. For the events passing the cuts, a neural network is trained with the input variables in Table 2 to discriminate between signal and background. The resulting event discriminant can be seen in Figure 5. This procedure is repeated for every mass point and for each mass point a limit is calculated (Figure 6).
The basic idea of the matrix element technique is to use LO matrix elements to calculate event probabilities. For each event and process the LO matrix element is integrated over phase space:
| (1) |
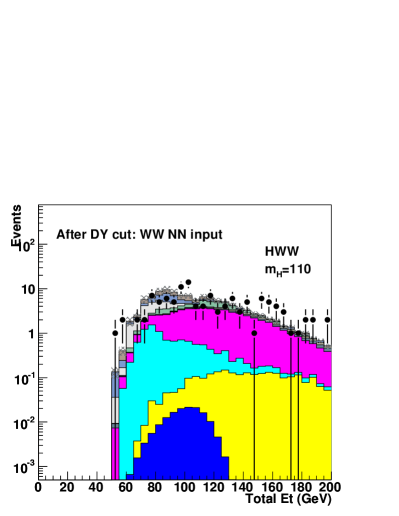
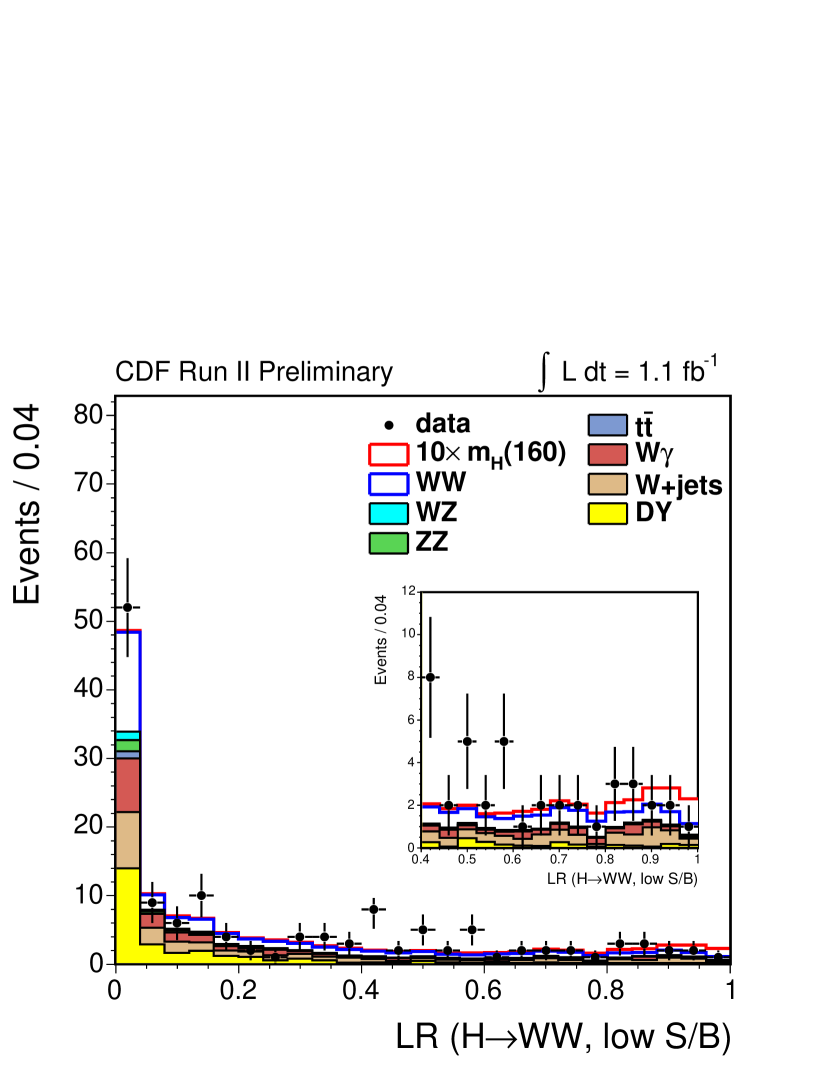
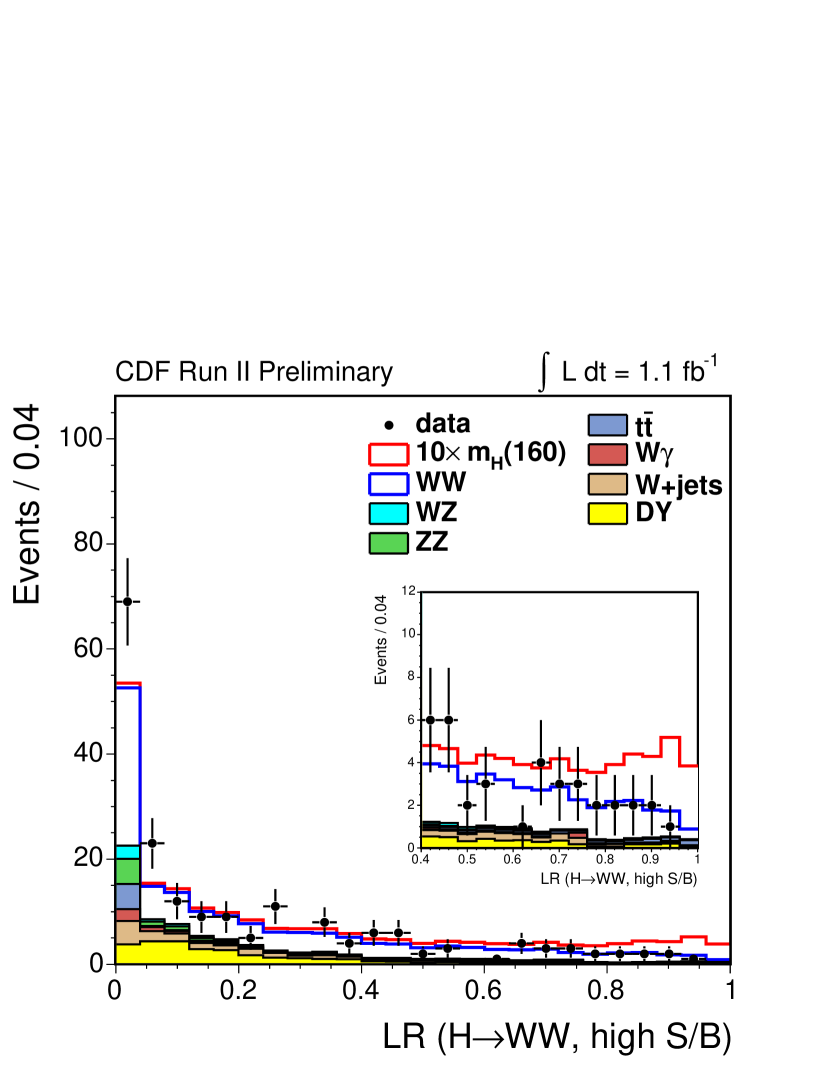
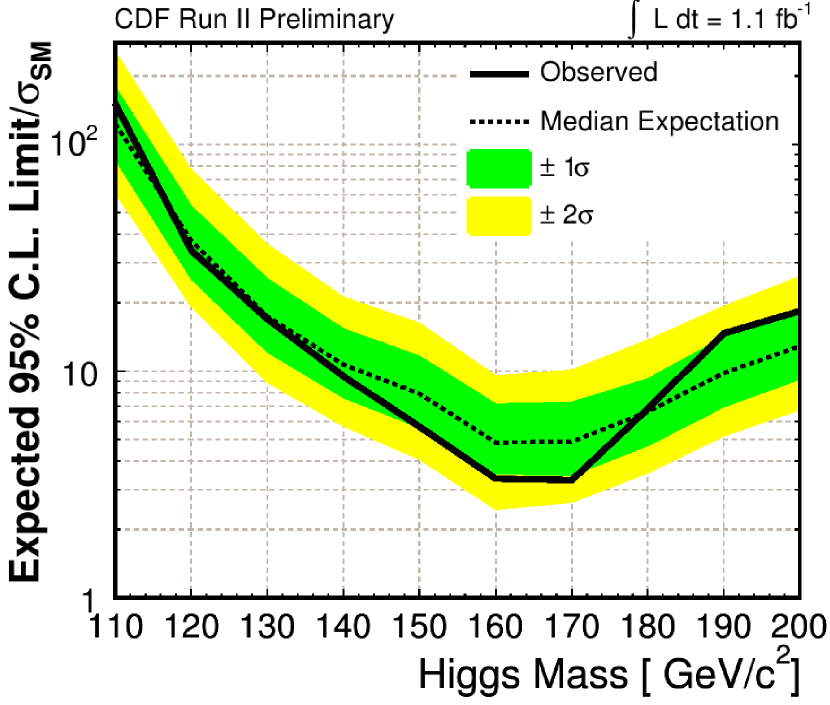
where is the matrix element, is the efficiency and is the resolution. The matrix element analysis uses the cuts in Table 3. The data are divided into a high signal-to-background and a low signal-to-background region (see Figure 7). For each mass point a separate event discriminant is calculated and a separate limit is calculated (see Figure 8).
4 Combining Measurements
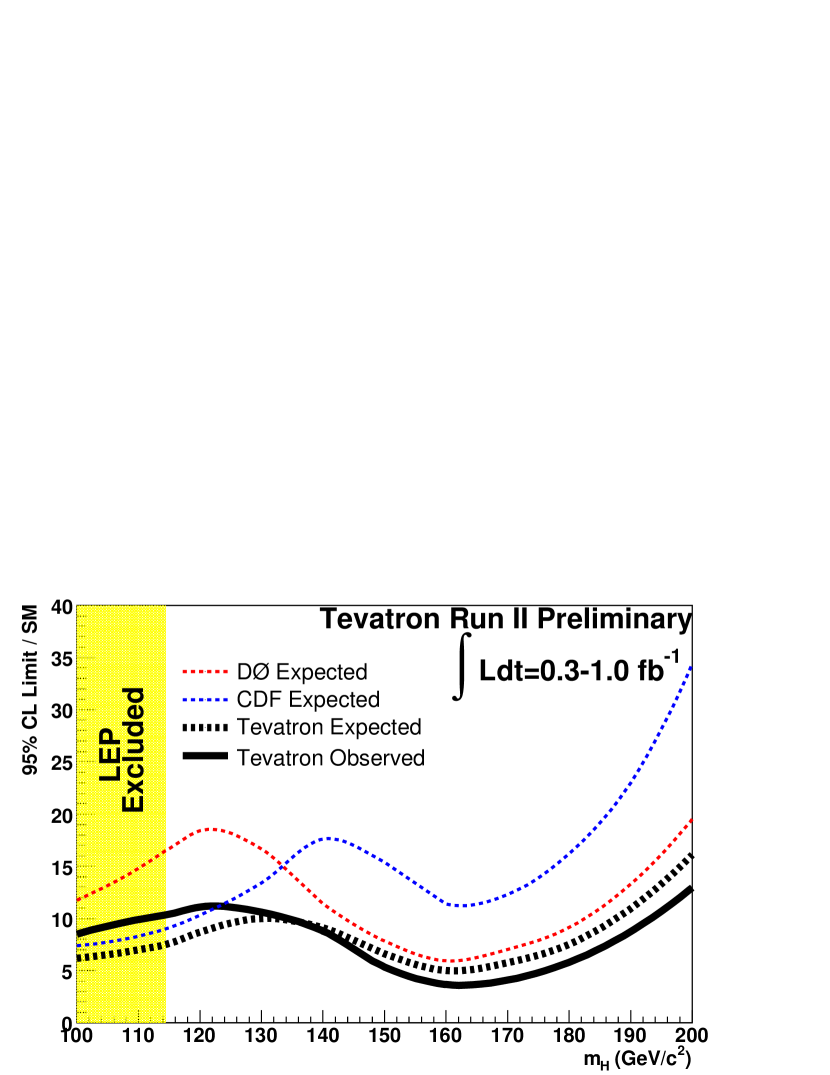
For each experiment the obtained limits are combined with the limits from other search channels. In addition, the limits from CDF and DØ are also combined to yield an overall Tevatron limit (see Figure 9).
| lepton ID | |||
|---|---|---|---|
| lepton isolation |
|---|
| or or |
| opposite charge leptons |
| neural net for Drell-Yan suppression |
| trilepton veto |

References
- (1) The LEP Electroweak Working Group, http://lepewwg.web.cern.ch/LEPEWWG/
- (2) R. Barate et al. [LEP Working Group for Higgs boson searches], Phys. Lett. B 565, 61 (2003) [arXiv:hep-ex/0306033].
- (3) The DØ Collaboration, public note DØnote 5063-CONF, 2006
- (4) The DØ Collaboration, public note DØnote 5194-CONF, 2006
- (5) The CDF Collaboration, public note for cdf note 8700, 2007
- (6) The CDF Collaboration, public note 9774, 2007