On The Linear Behaviour of the Throughput of IEEE 802.11 DCF in Non-Saturated Conditions
Abstract
We propose a linear model of the throughput of the IEEE 802.11 Distributed Coordination Function (DCF) protocol at the data link layer in non-saturated traffic conditions. We show that the throughput is a linear function of the packet arrival rate (PAR) with a slope depending on both the number of contending stations and the average payload length. We also derive the interval of validity of the proposed model by showing the presence of a critical , above which the station begins operating in saturated traffic conditions.
The analysis is based on the multi-dimensional Markovian state transition model proposed by Liaw et al. with the aim of describing the behaviour of the MAC layer in unsaturated traffic conditions. Simulation results closely match the theoretical derivations, confirming the effectiveness of the proposed linear model.
Index Terms:
DCF, Distributed Coordination Function, IEEE 802.11, MAC, saturation, throughput, unsaturated.I Introduction
Modelling of the DCF at the MAC layer of the series of IEEE 802.11 standards has recently garnered interest in the scientific community [1]-[6]. After the seminal work by Bianchi [1] who proposed a bi-dimensional Markov model of the back-off stage procedure adopted by the DCF in saturated conditions, many papers have focused on various facets of basic access mechanism providing extensions to most recent versions of the IEEE 802.11 series of standards [7]. Recently, in [3] the authors proposed a novel fixed-point analysis of the DCF providing an effective framework for analyzing single cell IEEE 802.11 WLANs without resorting to the bi-dimensional contention model [1].
Practical networks usually operate in non-saturated conditions and data traffic is mainly bursty. Under these operating conditions, Bianchi’s model does not describe accurately the behaviour of the throughput at the MAC layer. In this respect, in [4]-[5] the authors proposed two different bi-dimensional Markov models accounting for unsaturated traffic conditions, extending the basic bi-dimensional model proposed in [1].
In this paper we take a different approach with respect to works [4]-[5]. Upon starting from the bi-dimensional model proposed by Liaw et al. in [4], we show that the behaviour of the throughput of the IEEE 802.11 DCF in unsaturated conditions can be described by a linear relation that, with respect to the PAR , depends on two network parameters: the number of contending stations, and the average size of the transmitted packets. This is one of the key contribution of the paper: no simulations are needed for throughput evaluation since it can be theoretically predicted employing the model developed in Section III. Of course, the limit of validity of such a model has to be clearly identified, and it represents another contribution of this paper. To this end, we derive the interval of validity of the proposed model with respect to the PARs at the MAC layer. We demonstrate the existence of a critical PAR, , which discriminates the unsaturated region, characterized by the range , from the saturation zone identified by any .
For conciseness, we invite the interested reader to refer to [4] for many details on the considered bi-dimensional Markov model, and references therein to get a picture of the topic addressed in this letter. Briefly, Liaw et al. extended the saturated Bianchi’s model by introducing a new idle state, not present in the original Bianchi’s model, accounting for the case in which the station buffer is empty, after a successful completion of a packet transmission. The main advantages of such a model rely on its simplicity and the effectiveness in describing the dynamics of the DCF in unsaturated traffic conditions, while basic hypotheses are the same as in Bianchi’s model.
Paper outline is as follows. In section II, we briefly recall the main probabilities needed for developing the proposed linear model, evaluate the throughput and present the adopted traffic model. Finally, Section III presents the linear model of the throughput along with simulation results.
II Problem formulation and Traffic model
The bi-dimensional contention Markov model proposed in [4] governs the behaviour of each contending station through a series of states indexed by the pair whereby identifies the backoff stage, and the backoff counter. The other parameters needed in the proposed framework can be summarized as follows: is the probability that a station starts a transmission in a randomly chosen slot time (ST), is the probability that there is at least a packet in the queue after a successful transmission, is the size of the th contention window, is the minimum size of the contention window, is the probability of having at least one packet to be transmitted in the queue when the system is in idle state, and is the collision probability defined as in [1]
| (1) |
Stationary probability of being in the idle state is:
| (2) |
whereby is defined as follows:
| (3) |
By employing the normalization condition [1], it is possible to obtain:
| (4) |
Next line of pursuit is the computation of the system throughput. Putting together Eq.s (1), (4), a nonlinear system can be defined and solved numerically, obtaining the values of and . The solution of the previous system is used for evaluating the throughput, defined as the ratio between the average payload information transmitted in a ST and the average length, , of a ST:
| (5) |
whereby is the average packet payload length (expressed in bits), is the probability that there is at least one transmission in the considered ST, with stations contending for the channel, each transmitting with probability , i.e., . Probability is the conditional probability that a packet transmission occurring on the channel is successful:
| (6) |
Upon noting that, in a given ST, a station can reside in one of three possible kind of states, namely the idle state where the station spends , the backoff states where the station spends , and the transmitting states in which the station spends , then the average duration of a ST easily follows
| (7) | |||||
where is defined in (4), and
| (8) |
Let us define the time durations and in (7). Transmission time can be evaluated by noting that a station can experience two possible events: it successfully transmits over the channel or it encounters a collision. By doing so, can be defined as follows:
| (9) |
whereby and are, respectively, the average time a channel is sensed busy due to a collision, and the successful data frame transmission time [1, 4].
Backoff time duration can be evaluated by considering the following two possibilities. A station can reside in a backoff slot of duration if no other station is transmitting in the same ST, or for a time due to a collision with at least another station occupying the channel:
| (10) |
whereby corresponds to the probability that at least a station, other than the tagged one, is transmitting in a ST.
For the sake of defining the traffic model employed for performance verification, we need to define both the access time (this is the average time a station spends through the various backoff stages before transmitting a packet) and the service time . From [4], can be defined as follows:
| (11) |
whereby is as defined in (4). On the other hand, [6], i.e., the time elapsed from the moment a packet is taken from the queue to the instant in which it is successfully transmitted, can be defined as .
The employed traffic model is . Probabilities and in our model can be defined as follows:
| (13) |
where is the probability of an empty system [8], , follows from M/G/1/K queuing theory [8], while stems from the fact that for exponentially distributed interarrival times with mean the probability of having at least one packet arrival during time is equal to .
Employing (2), for a -length queue, we have:
| (14) |
III The Linear model and simulation results
| 10 | 20 | 30 | |
|---|---|---|---|
| [Mbps] | 9.118 | 8.73 | 8.608 |
| [pkt/s] | 111.2 | 53.235 | 34.99 |
A model of the throughput in non-saturated traffic conditions, along with its dependence on some key network parameters, can be derived by analyzing (5) in the limit .
Let us write the throughput in (5) as a function of . By employing (6), the numerator can be rewritten as . As far as the denominator is concerned, upon substituting (12) in (7), and remembering that , after some algebra, it is possible to obtain the following relation . By collecting the previous relations, the throughput can be rewritten as:
| (15) |
whereby we highlighted the dependence on of the terms , and . Upon noting that (3) yields , from (4) it follows as well. In the limit , it is straightforward to demonstrate the following relations: (from (1)), (from (4)), (from (8)), (from (3)), (from (9)), and (from (10)).
Upon substituting the derivations above in (15), the limit easily follows.
Upon employing the Taylor’s formula around , the throughput can be well approximated as follows:
As far as , ; therefore, the approximation holds as well. As a consequence, (15) can be rewritten as follows:
| MAC header | 28 bytes | Propag. delay | 1 |
|---|---|---|---|
| PLCP Preamble | 144 bit | PLCP Header | 48 bit |
| PHY header | 24 bytes | Slot time | 20 |
| PLCP rate | 1Mbps | W0 | 32 |
| No. back-off stages, m | 5 | Wmax | 1024 |
| Payload size | 1025 bytes | SIFS | 10 |
| ACK | 14 bytes | DIFS | 50 |
| ACK timeout | 364 | EIFS | 364 |
| (16) |
Next line of pursuit consists in expressing in terms of the PAR . By using the MacLaurin expansion of the exponential , from (14) it is as . On the other hand, Equ. (12) yields . Finally, in the limit , Equ. (4) yields . Upon substituting the previous mathematical derivations in (16), the throughput can be approximated as follows:
| (17) |
It is interesting to estimate the interval of validity of the linear throughput model proposed in (17). An appropriate value of can be obtained by finding the abscissa corresponding to the intersection of the straight line (17) with the horizontal line passing through the maximum of the throughput. To this end, after expressing any term involved in (5) as a function of , the maximum throughput can be obtained in two steps. First, one has to find the value for which the throughput gets maximized. This can be easily obtained by equating to zero the derivative of (5) with respect to , and then solving for . In the second step, the maximizing value can be substituted into for obtaining . Finally, is the value of for which the following holds:
| (18) |
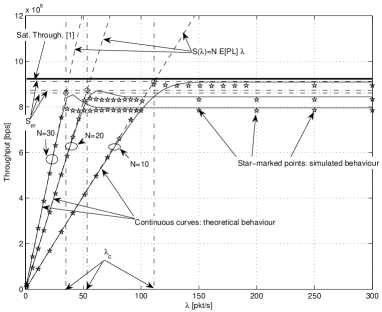
Table I shows the values of , found numerically, along with the respective values of , for various values of . We considered the bit rate 54Mbps for the protocol IEEE 802.11g. The linear model (17) shows a close agreement with both theoretical (continuous curves) and simulated throughput curves. Fig. 1 shows the straight lines in (17) (dashed lines) for three different values of . The figure also shows the values of (horizontal dash-dot lines) along with the three values of deduced from (18) and noted in Table I. Simulated values (star-marked points) have been obtained with ns-2 by using settings noted in Table II, along with standard 54Mbps 802.11 parameterizations [7], which are also the standard parameters defined in ns-2. Within ns-2, stations have been randomly placed in a square area with edge size equal to m using a uniform distribution. All simulation results in Fig. 1 are obtained with a 95% confidence interval lower than kbps.
Fig. 1 shows that the maximum achievable throughput does not exceed 10Mbps (@N=10) despite the maximum bit rate employed (54Mbps): this throughput penalty is essentially due to the fact that the control packet and the PLCL header are transmitted at 1Mbps no matter the operating transmission mode. As a reference throughput performance, we show the maximum saturation throughput (labelled ”Sat. Through. [1]” in Fig. 1) found in [1] in case the contending stations transmit at the optimal transmission probability . Notice that, throughput penalty with respect to 54Mbps is well predicted by the theoretical formulation presented in [1].
References
- [1] G. Bianchi, ”Performance analysis of the IEEE 802.11 distributed coordination function”, IEEE JSAC, Vol.18, No.3, March 2000.
- [2] G. Bianchi and I. Tinnirello, ”Remarks on IEEE 802.11 DCF performance analysis”, IEEE Comm. Letters, Vol.9, No.8, Aug. 2005.
- [3] A. Kumar, E. Altman, D. Miorandi, and M. Goyal, ”New insights from a fixed-point analysis of single cell IEEE 802.11 WLANs”, to appear on IEEE/ACM Trans. on Networking, 2007, now available on IEEExplorer.
- [4] Y.S. Liaw, A. Dadej, and A.Jayasuriya, ”Performance analysis of IEEE 802.11 DCF under limited load”, In Proc. of Asia-Pacific Conference on Communications, Vol.1, pp.759 - 763, 03-05 Oct. 2005.
- [5] D. Malone, K. Duffy, and D.J. Leith, ”Modeling the 802.11 distributed coordination function in non-saturated heterogeneous conditions”, IEEE-ACM Trans. on Networking, vol. 15, No. 1, pp. 159 172, Feb. 2007.
- [6] W. Lee, C. Wang, and K. Sohraby, ”On use of traditional M/G/1 model for IEEE 802.11 DCF in unsaturated traffic conditions”, In Proc. of IEEE WCNC, 2006, pp. 1933 1937.
- [7] IEEE Standard for Wireless LAN Medium Access Control (MAC) and Physical Layer (PHY) Specifications, November 1997, P802.11
- [8] G. Bolch, S. Greiner, H. de Meer, and K.S. Trivedi, Queueing Networks and Markov Chains, Wiley-Interscience, 2nd edition, 2006.