Direct Evidence from Spitzer for a low-luminosity AGN at the center of the Elliptical Galaxy NGC 315
Abstract
We present the Spitzer Space Telescope InfraRed Array Camera (IRAC) and Multiband Imaging Photometer (MIPS) observations of the elliptical galaxy NGC 315. After removal of the host galaxy’s stellar emission, we detected for the first time an infrared-red nucleus in NGC 315. We measured the spectral energy distribution (SED) for this active nucleus with wavelength range covering from radio to X-ray, and obtained the bolometric luminosity of , corresponding to an extremely low Eddington ratio (L/LEdd) of 4.97 10-4. Our results confirm that the physical nature of the nucleus of NGC 315 is a low-luminosity AGN, consistent with the recent optical and Chandra X-ray observations.
1 Introduction
The recent discovery of a tight correlation between black hole (BH) mass and the bulge’s mass of host galaxy suggests that the creation and growth of central black holes are an integral part of the formation of galactic bulges (Kormendy & Richstone 1995; Kauffmann & Heckman 2005). On the other hand, it also implies that supermassive black holes (SMBHs) are ubiquitous at the centers of elliptical galaxies. Although indeed most host galaxies of radio-loud and the brightest quasars at high-redshift are elliptical galaxies (Hutchings & Morris 1995; Bahcall, Kirkakos & Schneider 1996; Falomo et al. 2005), the majority of SMBHs in nearby ellipticals are not very active (Ho, Filippenko & Sargent 1997), and therefore hardly detectable.
The low state of SMBHs in nearby ellipticals is most probably due to the lack of enough fuel supply - cold gas inflow into the central engine. It is generally accepted that elliptical galaxies are spheroidal distributions of older stars and lack substantial cold intersteller material (ISM). However, an H [NII] narrow-band imaging survey has shown that elliptical galaxies certainly have plenty of extended warm ( K) gas (Shields 1991). By detecting positive signal from co-adding images of the Infrared Astronomy Satellite (IRAS) survey scans, Knapp et al. (1989) discovered that 50 percent of optically-selected ellipticals with visual magnitude brighter than V=14 contained cool interstellar matter. Temi et al. (2004) estimated that 16 elliptical galaxies observed with the Infrared Space Observatory (ISO) have dust masses on average 10 times greater than those previously detected by IRAS. Most recently, Kaneda, Onaka, & Sakon (2005) detected even polycyclic aromatic hydrocarbon (PAH) emission features in four elliptical galaxies with the Spitzer Infrared Spectrograph (IRS). Recent neutral hydrogen observations also show that plenty of extended gas is clearly present in early-type galaxies (Morganti et al. 2006; Noordermeer 2006 and references therein). All these results suggest that the presence of a significant amount of cold/warm interstellar gas at centers of elliptical galaxies is quite common, although the origin of such amount of dust and cold gas is still uncertain (Caon et al. 2000).
AGN signature of SMBHs has been seen in elliptical galaxies. In the recent Palomar spectroscopic survey, Ho, Filippenko & Sargent (1997) found that about 50% elliptical galaxies show detectable emission-line nuclei, most of which ( 87%) are classified as LINERs. Although it is still a subject of hot debate whether LINERs are genuine low-luminosity AGNs (see the recent review by Ho 2003), AGN activity is confirmed by radio and X-ray observations (Terashima et al. 2002; Filho et al. 2004).
Typical AGNs are also strong infrared sources. Ho et al. (1997) found that about 55% of elliptical galaxies with emission lines were detected to have infrared emission by IRAS. Due to the lower spatial resolution ( 3’4’ ) of IRAS, it is impossible to determine whether the far-infrared emission from elliptical galaxies arises from AGN point sources at the center, or from extended dust distribution seen as dust-lane in optical images (Lauer et al. 2005). One example is NGC 315, a well studied elliptical galaxy classified as a LINERs by Ho et al. (1997). The HST image shows a clear dusty disk with 2.5” diameter in its center (Verdoes Kleijn et al. 1999) and the galaxy is also detected by IRAS at 12, 25, 60, and 100 µm with flux densities of 0.081, 0.150, 0.270, and 0.706 Jy, respectively (IRAS Faint Source Catalogue, Moshir et al. 1990), corresponding to at the distance of 65.8 Mpc (Ho, Filippenko & Sargent 1997). Clearly, a high-resolution infrared image of NGC 315 is required to determine whether its infrared emission comes from the central 2” region.
The Spitzer Space Telescope (Werner et al. 2004) has 2” spatial resolution in mid-infrared (3.6µm 8.0 µm) and 5” at 24µm. This makes it possible to study the infrared emission from central regions of elliptical galaxies. In this work we present a study of the nuclear activity in the elliptical galaxy NGC 315 based on observations by the Infrared Array Camera (IRAC, Fazio et al. 2004) and the Multiband Imaging Photometer for Spitzer (MIPS, Reike et al. 2004) aboard the Spitzer Space Telescope. This paper is organized as follows: the IRAC and MIPS data reduction, flux calibration and photometry are in Sect. 2. We present multi-wavelength physical properties of nucleus of NGC 315 in Sect. 3.
2 Data Reduction
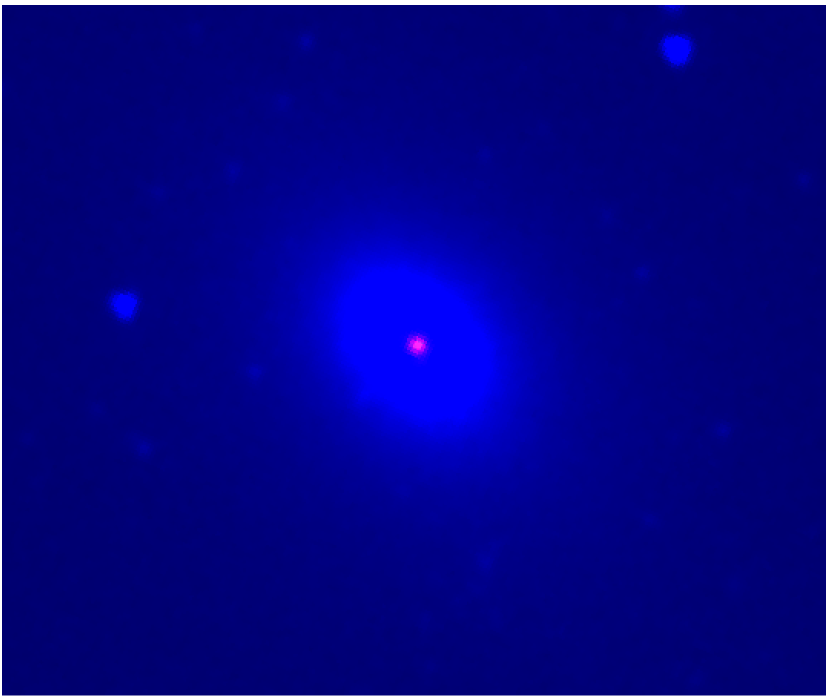
We downloaded the IRAC Basic Calibrated Data (BCD) for NGC 315 from the archive of the Spitzer Science Center (SSC). The BCD images had been performed with basic image processing, including dark subtraction, detector linearization corrections, flat-field corrections, and flux calibrations (see also the IRAC Data Handbook111http://ssc.spitzer.caltech.edu/irac/dh/). We further used the custom IDL software (Huang et al. 2004) to make the final mosaic images as shown in Figure 1. The MIPS image for NGC 315 was mosaicked by the SSC pipeline as post-BCD products. Both the IRAC and MIPS bands have absolute flux calibration accuracies of better than 10% (Fazio et al. 2004; Rieke et al. 2004). Throughout this paper, the magnitudes and colors were given in the AB system.
The surface photometry for NGC 315 was performed with the ellipse program in the ISOPHOT package of IRAF222IRAF is distributed by the National Optical Astronomy Observatories, which are operated by the Association of Universities for Research in Astronomy, Inc., under cooperative agreement with the National Science Foundation.. The isophotal parameters, such as ellipticity and position angle, for NGC315 were measured at 3.6µm where the Signal-to-Noise (S/N) ratio is the highest. These parameters were then applied for the surface photometry at 4.5, 5.8 and 8.0 µm. IRAC photometry calibration is designed only for point sources. Recently Tom Jarrett provided addional aperture corrections for extended sources photometry in IRAC images333http://spider.ipac.caltech.edu/staff/jarrett/irac/calibration/index.html. We applied this addiotional correction for the IRAC surface photometry of NGC 315. The total flux densities for NGC 315 in each IRAC band are given in Table 1. We diluted the 3.6, 4.5 and 5.8µm IRAC images so that they have the same spatial resolution as the 8.0µm image to obtain accurate IRAC color distributions for NGC 315.
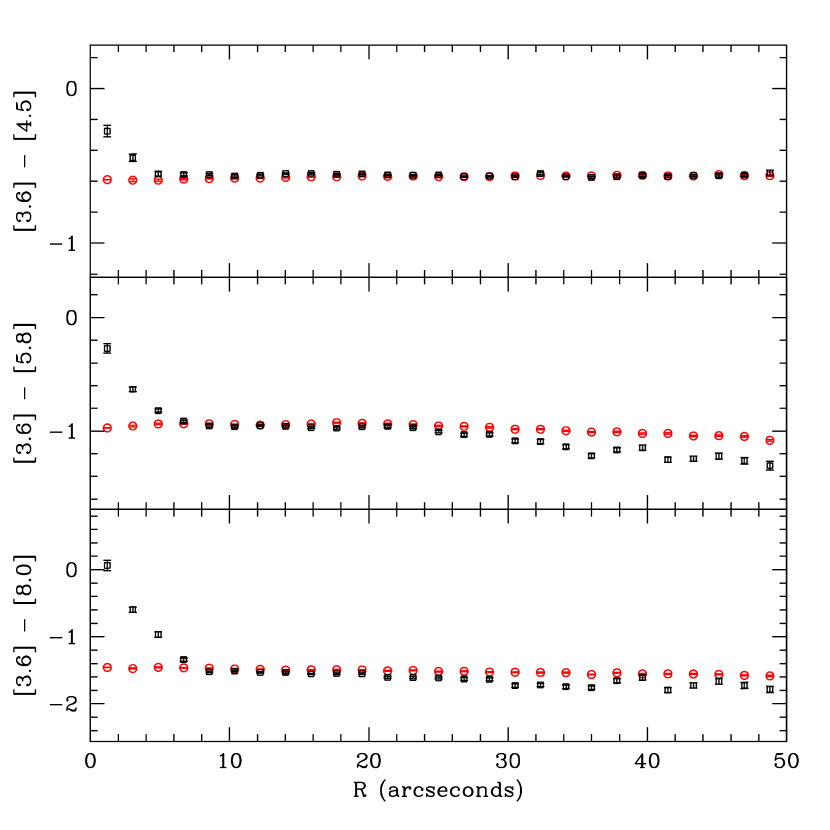
Figure 2 shows three IRAC color distributions of [3.6]-[4.5], [3.6]-[5.8], and [3.6]-[8.0] for NGC 315. At 5” R 50”, these infrared colors are roughly constant and consistent with those of an M star (Pahre, et al. 2004). The central region, however, shows a much redder color indicating a non-stellar origin of the infrared emission. In Figure 2, we also plot the IRAC colors of a normal elliptical galaxy, NGC 5557, for comparison, NGC 5557 has not been identified to have any AGN signature in the center, it does not show red IRAC colors in the central region (R 5”). The constant color distributions for NGC 315 at R 5” suggest a uniform stellar population, which is confirmed by the high S/N long-slit optical spectrophotometry (see Fig. 3 in Cid Fernandes et al. 2005).
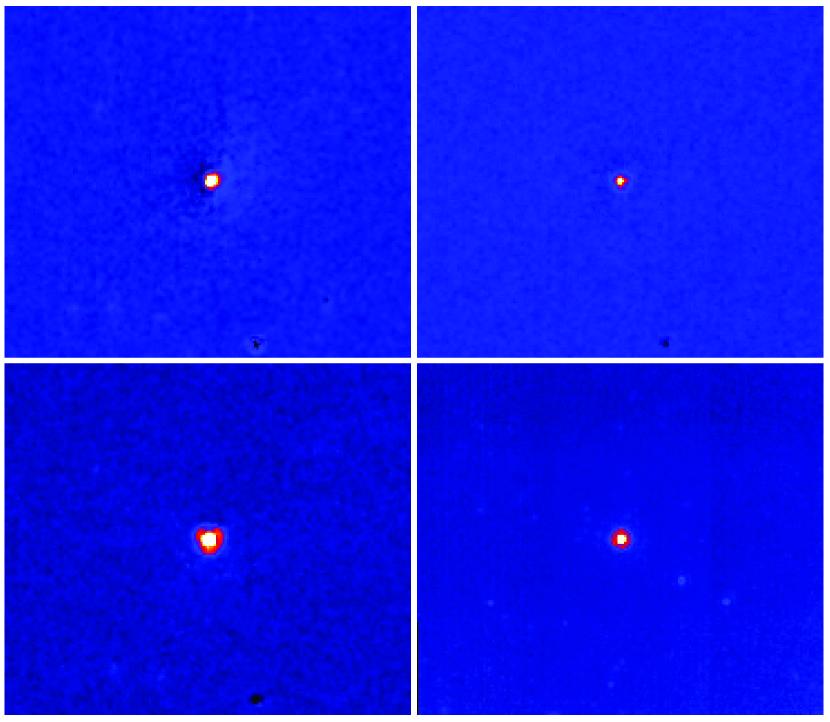
In the IRAC band the emission from the central region of NGC 315 consists of two components: stellar and non-stellar emission. However, we cannot interpolate the stellar distribution measured in the outer region to the region with R2”, because the stellar distribution in the central region of an elliptical galaxy can have various profiles. Pahre et al. (2004) argued that the 3.6µm emission traces the stellar mass distribution very well (see also Wu et al. 2005), we relied on the IRAC 3.6µm image to remove the contribution from the underlying stellar population. We used the mean colors ([3.6]-[4.5], [3.6]-[5.8], and [3.6]-[8.0]) at the region of 10 and 30 arcseconds to scale the 3.6µm image to remove the contribution from the underlying stellar components in the 4.5, 5.8, and 8.0µm images. There is only one point source left in all 3 residual images, as shown in Figure 3. The flux density for the point source is as following:
| (1) |
where =4.5, 5.8, and 8.0µm, fresidual is the total flux for the point source in the residual images, fns is the flux density for the non-stellar red nucleus, and Rstellar is the flux ratio of the stellar emission. We have to assume the shape of the SED for the central non-stellar emission to solve the 4 flux densities out of 3 equations. f appears as a power-law distribution, it is reasonable to assume that f is a power-law function. The fns for 3.6, 4.5, 5.8 and 8.0µm are given in Table 1. The residual point source is also consistent with the MIPS 24µm image. NGC 315 appears as a point source at 24 µm (Figure 3) because its stellar emission is negligible in this band. Therefore for the first time we determine that all infrared emission from NGC 315 detected by IRAS and Spitzer comes from the central point-like source.
3 Physical Properties of Red Nucleus
At the resolution of IRAC it is not possible to tell whether the IR emission is really coming from the AGN nucleus, or from the dusty disk seen in the HST images. If the IR emission is produced by heated dust, we can estimate the dust temperature using the 8.0 and 24 µm fluxes, since Spitzer Infrared Spectrograph (IRS) observations suggest that the PAH feature at 7.7 µm is very faint or even absent in elliptical galaxies (Kaneda, Onaka & Sakon 2005). Assuming a grey-body radiation characterized by a dust emissivity going as , we derive a dust temperature of K, which is similar to the dust temperatures measured in the central regions of Seyfert galaxies, K (Deo 2007). We also need to check whether the amount of dust mass inferred from the optical dusty disk is consistent with the dust mass required to explain the IR emission. de Ruiter et al. (2002) estimated a dust mass from IRAS data () that is a thousand times larger than that inferred from the optical reddening absorption study (), which might indicate a significant contribution of IR emission from the central AGN. When A ring-like structure is clearly visible in the 8.0 µm image (lower-left panel of Fig. 3), which is very similar to the IRAC 8.0 Point Spread Function (PSF) first Airy ring, thus providing further evidence of the IR emission comes from the AGN nucleus. We conclude therefore that both the dusty disk and the central AGN contribute to the IR emission. With the current data set, we cannot address it further. For the future, IR variability data would certainly help to solve the current issue.
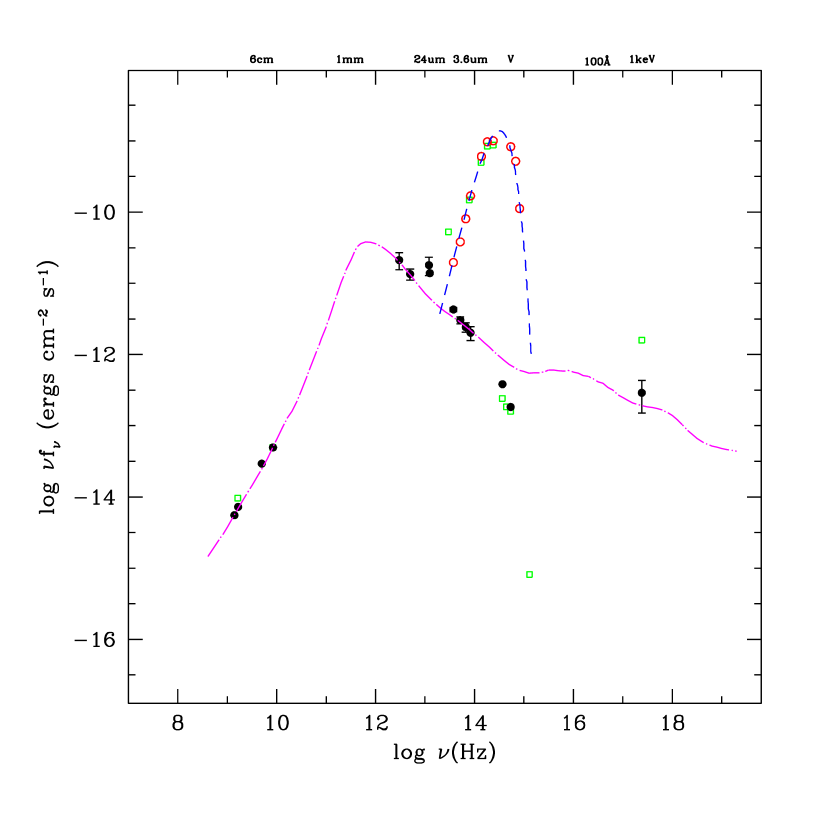
Venturi et al. (1993) presented multifrequency radio observations of NGC 315 with parsec resolution, they detected radio emission from a nucleus with a size of 0.05 pc and . The Chandra also detected a point-like nucleus, which is well fitted with a single power law with an intrinsic absorption of , and an 0.5-8 keV luminosity of of (Worrall et al. 2007). Thus, using the HST data, and the accurate flux densities in the mid- and far-infrared derived in this paper, we are able to extend the Spectral Energy Distribution (SED) of the nucleus of NGC315 from the radio to X-ray as shown in Figure 4. Also shown in Fig. 4, is the SED of host galaxy which is seen to be very well fitted by Black-Body radiation of 3950K, which is consistent with its optical spectrum (Cid Fernandes et al. 2005) and the infrared colors derived in this paper.
Integrating the SED we obtain a bolometric luminosity of ergs s-1 for the nucleus of NGC 315. Denicolo et al. (2005) obtained the central stellar velocity dispersion of NGC 315 to be , which according to the relation (Tremaine et al. 2002), corresponds to a central SMBH mass of . Combining the SMBH mass with the bolometric luminosity and Eddington ratio , typical of low-luminosity AGNs (Ho, 1999).
For comparison, we plotted in Fig.4 the SED of Sgr A*, the supermassive black hole at the Galactic center, which is well measured from radio to X-rays (Yuan, Quataert, & Narayan 2003). We find that the SED shape of NGC 315 is remarkably similar to that of Sgr A*, which might suggest a similar accretion mode - radiatively inefficient accretion disk - for both NGC 315 and Sgr A*. This is surprising because there are several systematic differences between Sgr A* and NGC 315: (1) L/LEdd of Sgr A* is only (Yuan, Quataert, & Narayan 2003), more than 5 orders of magnitude lower than that of NGC 315; (2) The X-ray spectrum of Sgr A* is much steeper than that of NGC 315, their photon indexes being 2.7 and 0.57, respectively (Baganoff et al. 2003; Worrall et al. 2007). (3) We see in Fig. 4 that the SED of NGC 315 deviates significantly from that of Sgr A* in the optical band. Since the HST data has very high spatial resolution, the good agreement in the IR band may be fortuitous since we cannot separate emission from the central dusty disk and AGN with the present IRAC data. The match may also be fortuitous in the radio band since NGC 315 has extended radio jets, which may contaminate the core emission.
In order to throw more light on this subject, we also plot in Fig. 4 the SED of NGC 4261, which has a similar L/LEdd (2.8 ) to NGC 315. We see that NGC 4261 matches the SED of NGC 315 quite well in the radio and optical bands, but is more luminous in X-rays. We must conclude that the apparent match of SEDs does not provide a unique physical interpretation about the physics of radiation from AGN’s.
In this work, we presented Spitzer IRAC and MIPS observations of the elliptical galaxy NGC 315. After careful removal of the dominant stellar light from the host galaxy, the IRAC revealed that all the non-stellar IR emission originates from a compact region in the center of NGC 315. Although there is a non-negligible contribution from the central dusty disk to the IR emission of NGC 315, the ring-like pattern in the non-stellar 8.0 µm image, the significant excess of dust mass inferred from IR data than that of the optical dusty disk, and the power-law distribution of the IRAC fluxes strongly suggest that we have direct evidence of a low-luminosity AGN in NGC 315, which might dominate the IR emission.
References
- (1) Baganoff F. K., et al. 2003, ApJ, 591, 891.
- (2) Bahcall J. N., Kirkakos S., & Schneider D. P. 1996, ApJ, 457, 557
- (3) Caon N., Macchetto D., & Pastoriza M. 2000, ApJS, 127, 39
- (4) Cid Fernandes R., Gonzalez Delgado R. M., Storchi-Bergmann T., Martins L. P., & Schmitt H. 2005, MNRAS, 356, 270
- (5) Denicolo G., Terlevich R., Terlevich E., et al. 2005, MNRAS, 356, 1440
- (6) Deo R., 2007, PhD thesis, Georgia State University
- (7) de Ruiter H. R., et al. 2002, A&A, 396, 857
- (8) Falomo R., Kotilainen J. K., Scarpa R., & Treves A. 2005, A&A, 434, 469
- (9) Fazio G. G., et al. 2004, ApJS, 154, 10
- (10) Filho, M. E., Fraternali, F., Markoff, S., Nagar, N. M., Barthel, P. D., Ho, L. C., & Yuan, F. 2004, A&A, 418, 429
- (11) Ho L. C., Filippenko A. V., & Sargent W. L. W. 1997, ApJS, 112, 315
- (12) Ho L. C. 1999, ApJ, 516, 672
- (13) Ho L. C. 2003, in ASP Conf. Ser. 290, Active Galactic Nuclei: From Central Engine to Host Galaxy, eds. S. Collin, F. Combes, & I. Schosman (San Francisco: ASP), 379
- (14) Huang, J.-S., et al. 2004, ApJS, 154, 44
- (15) Hutchings J. B. & Morris S. C. 1995, AJ, 109, 1541
- (16) Kaneda H., Onaka T.,& Sakon I. 2005, ApJ, 632, L83
- (17) Kauffmann, G., & Heckman, T. M. 2005, Philos. Trans. R. Soc. London, A, 363, 621
- (18) Knapp, G. R., Guhathakurta, P., Kim, D.-W., & Jura, M. 1989, ApJS, 70, 329
- (19) Kormendy J., & Richstone D. 1995, ARA&A, 33, 581
- (20) Lauer T. R., et al. 2005, AJ, 129, 2138
- (21) Moshir, M., et al. 1990, IRAS Faint Source Catalog (ver. 2.0; Greenbelt: NASA/GSFC)
- (22) Morganti R., et al. 2006, MNRAS, 371, 157
- (23) Noordermeer E., 2006, PhD thesis, Rijksuniversiteit Groningen
- (24) Pahre M. A., Ashby M. L. N., Fazio G. G., & Willner S. P. 2004, ApJS, 154, 235
- (25) Rieke, G. H., et al. 2004, ApJS, 154, 25
- (26) Shields J. C., 1991, AJ, 102, 1314
- (27) Temi, P., Brighenti, F., Mathews, W. G., & Bregman, J. D. 2004, ApJS, 151, 237
- (28) Terashima Y., Iyomoto N., Ho L. C., & Ptak A. F. 2002, ApJS, 139, 1
- (29) Tremaine S., et al. 2002, ApJ, 574, 740
- (30) Venturi T., et al., 1993, ApJ, 408, 81
- (31) Verdoes Kleijn G. A., Baum S. A., de Zeeuw P. T. & O’Dea C. P. 1999, AJ, 118, 2592
- (32) Werner M. W., et al. 2004, ApJS, 154, 1
- (33) Worrall D. M., et al. 2007, MNRAS, 380, 2
- (34) Wu H., et al. 2005, ApJ, 632, L79
- (35) Yuan F., Quataert E., & Narayan R. 2003, ApJ, 598, 301
| 3.6m | 4.5m | 5.8m | 8.0ma | |
|---|---|---|---|---|
| total | ||||
| nucleus | 2.4240.291 | 3.6500.357 | 5.8700.453 | 11.4500.633 |
| (Hz) | (ergs cm-2 s-1) | Referencea |
|---|---|---|
| 1.40 109 | 5.54 10-15 | 1 |
| 1.66 109 | 7.23 10-15 | 2 |
| 4.99 109 | 2.93 10-14 | 2 |
| 8.42 109 | 4.95 10-14 | 2 |
| 1.25 1013 | 1.39 10-11 | 3 |
| 2.97 1013 | 2.82 10-12 | 4 |
| 3.75 1013 | 2.84 10-12 | 3 |
| 5.17 1013 | 1.49 10-12 | 3 |
| 6.67 1013 | 8.95 10-13 | 3 |
| 8.33 1013 | 5.71 10-13 | 3 |
| 5.40 1014 | 1.83 10-13 | 5 |
| 3.68 1014 | 3.86 10-13 | 5 |
| 2.42 1017 | 2.902 10-13 | 6 |