Correlated Phenotypic Transitions to Competence in Bacterial Colonies
Abstract
Genetic competence is a phenotypic state of a bacterial cell in which it is capable of importing DNA, presumably to hasten its exploration of alternate genes in its quest for survival under stress. Recently, it was proposed that this transition is uncorrelated among different cells in the colony. Motivated by several discovered signaling mechanisms which create colony-level responses, we present a model for the influence of quorum-sensing signals on a colony of B. Subtilis cells during the transition to genetic competence. Coupling to the external signal creates an effective inhibitory mechanism, which results in anti-correlation between the cycles of adjacent cells. We show that this scenario is consistent with the specific experimental measurement, which fails to detect some underlying collective signaling mechanisms. Rather, we suggest other parameters that should be used to verify the role of a quorum-sensing signal. We also study the conditions under which phenotypic spatial patterns may emerge.
Genetic competence is a cellular differentiation process, in which bacterial cells (such as those of Bacillus Subtilis) synthesize a specific system of proteins for the binding and uptake of DNA review . Internalizing exogenous DNA leads to genetic transformations which presumably increases survival probability cohen . Under certain environmental conditions, a population of genetically identical cells (grown in homogeneous and identical environments) will at a given time be composed of two distinct subpopulations, a competent minority versus a non-competent majority, each with distinguished features. This has often been attributed to bistability dubnau_bi ; stochastic ; pos_feedback in the genetic regulatory network responsible for the competent state and indeed the necessary positive feedback has been found in the dynamics of one of the key regulatory molecules (comK) auto_stim ; elowitz .
More recently, Elowitz and co-workers elowitz have proposed that the competence transition is reversible and that a competent cell will return to its vegetative state after a characteristic time. This means that one should think of the network as being excitable excitable , with stochasticity (perhaps due to small molecular numbers) occasionally driving quiescent cells into the excited competent state. This result is very interesting, as it represents one of the first examples where the inherent stochasticity of genetic networks noise ; paulsson ; alon ; vano is being put to functional use. One consequence of this new picture is that the competent subpopulation is not fixed but rather is continually fluctuating. Surprisingly, they have also claimed that this transition is made on the single-cell level, and is uncorrelated among different cells. This is supported by the measurement of the competence excursion times of neighboring cells. But in this work we show that this may not be the right parameter to measure, if quorum sensing is to be studied. The purpose of this paper is to present a putative quorum-sensing mechanism that induces short-ranged spatial anti-correlations between cells, and to suggest the appropriate way to experimentally detect such a mechanism. This effect can be mediated by extracellular signaling molecules that are needed for the transition. In this scenario, a cell becoming competent will bias its neighbors against making the same choice. Yet, excursion times remain uncorrelated, as obtained experimentally. Our work is motivated by the many recently discovered instances in which signaling between bacterial cells bassler are used to create colony-level collective responses to external environmental challenges trends ; interface . For instance, it is clear that the sporulation response in bacillus is spatially coordinated minsky . At the end, we will discuss experimental tests of our predictions.
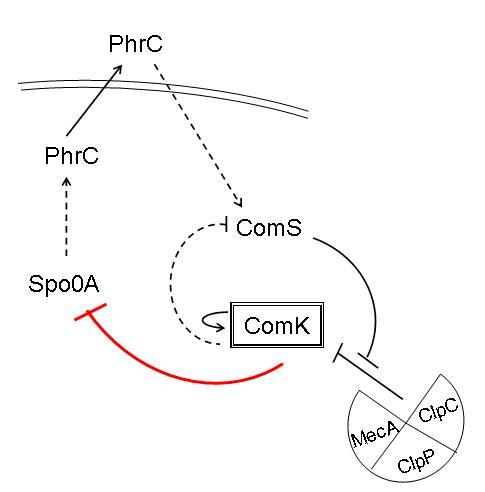
We start by considering the molecular interactions underlying the competence circuit. The onset of competence is stimulated by cell crowding and nutrient limitation. Detection of cell crowding is achieved by cell-cell signaling; various molecules are secreted and sensed by the cells, to monitor population density (quorum sensing) as well as other environmental conditions. In B. Subtilis, CSF (competence and sporulation factor) is a diffusible peptide, derived from the PhrC pheromone, which is secreted by the cells during growth. As its extracellular concentration increases due to cell crowding, CSF is transported back into the cell signaling ; quorum where it influences a cascade of several genes, leading eventually to either sporulation or competence, depending on its concentration. For low concentrations (but above the transport threshold) it (indirectly) enhances the phosphorylation of ComA, and consequently the expression of ComS. ComS competes with ComK for degradation by the MecA-ClpC-ClpP complex, thereby causing an indirect activation of ComK by ComS. ComK activates the transcription of several genes that encode DNA transport proteins and is considered as the indicator for the competent state. ComK activates its own expression and indirectly inhibits the expression of ComS. This double positive feedback loop can, as already mentioned, lead to a bistable response, i.e. two possible states with different gene expression. The negative feedback loop governs the escape from the competent state, as ComK degradation increases when ComS production is inhibited.
In ref. elowitz ; elowitz2 a model was proposed for the part of the circuit downstream from the external signal transducer ComA. Specifically, they proposed
| (1) |
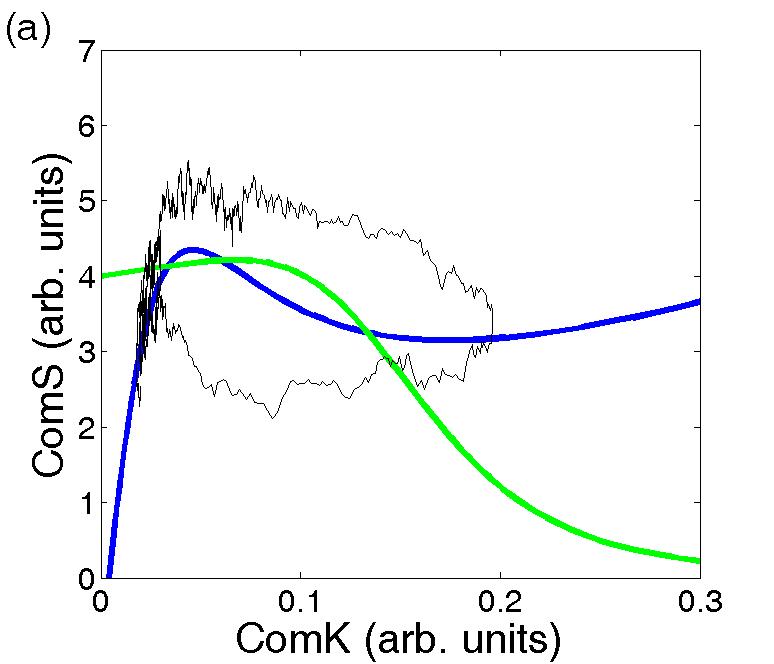
where and represent the concentrations of the ComK and ComS proteins. (+ ) represent the minimal (fully activated) rates of ComK production, and is the concentration of ComK required for 50% activation. The cooperativities of ComK auto-activation and ComS repression are parameterized by the Hill coefficients n=2 and p=5. Similarly, the expression of ComS has maximum rate and is half-maximal when . Degradation by the MecA complex affects both ComK and ComS; the nonlinear degradation term corresponds to such a competitive mechanism. Random fluctuations in ComS expression are represented by a noise term . Degradation rates of K and S are normalized to unity and are assumed to be identical. The parameters can be chosen to give rise to an excitable system where there exists a stable fixed point plus two other intersections of the K-S nullclines, a saddle point and an unstable fixed point. This case is presented in Fig. 2(a), where we also show a typical trajectory for which the noise has caused a large excursion, i.e. has excited the competent state. Eventually the cell returns to the vegetative stable state, due to the repression of ComS by ComK; when the value of S decreases below a threshold level, K is more rapidly degraded and can no longer auto-activate its production. One can obtain similar results with more biologically realistic noise forms stochastic ; elowitz2 ; schultz .
In this model, each cell was taken to be independent of the other cells. This assumption cannot be completely correct, however, since the external enabling signal acting through ComA comes from the rest of the colony. Obviously, the functional utility of having a competent subpopulation would clearly be enhanced if this subpopulation were spatially dispersed. In order to consider the possible spatial effect of quorum sensing, we introduce an extension of the model, and take into account a putative biological mechanism (see Fig. 1), in which the basal production level of ComS depends on a quorum sensing pheromone Q. The motivation for this particular model is a microarray analysis microarray which has shown that the gene Spo0A, which is upstream of the PhrC secretion mechanism, is down regulated when ComK is high. Thus, the secretion of CSF, which is a regulator for competence onset, is effectively inhibited by ComK. Specifically, we assume that
| (2) |
Now and are functions of space as well as time, and depends on the cells’ state in the following manner:
| (3) |
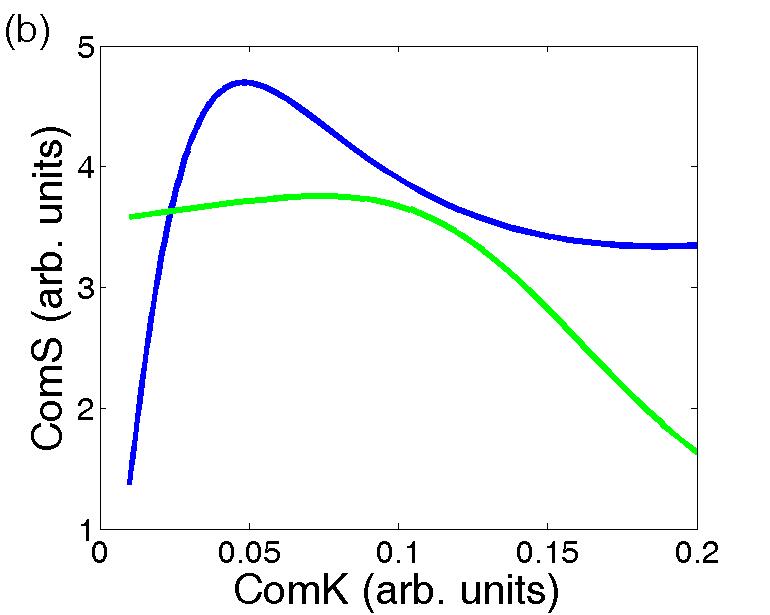
The production of Q is maximal as , namely normal growth, and it decreases as the cell becomes competent. is chosen to be the threshold value of , used to define the competent state. diffuses with diffusion coefficient , and is degraded with a constant rate . The parameters are chosen to describe a bistable system for , an excitable system for close to but less than one and a monostable one if . In fact, for the system described in Fig. 2(a), level as low as is sufficient to drive the system to the vegetative monostable regime, as can be seen in Fig. 2(b). This is a key point, as very small changes in the external signal (e.g. the level of CSF) may drive the cell into a completely different regime. Therefore, even a 2-fold change in the production of Spo0A, and as a result in the secretion of CSF, may have a substantial effect on a possible competence transition.
Our goal in this model is a semi-quantitative evaluation of correlations in the competence status of nearby cells. We will study this question in one spatial dimension (with periodic boundary conditions), with a cell at every one of the 5000 grid points. In each explicit time step, the values of and are updated for each cell and then is updated in the entire space.
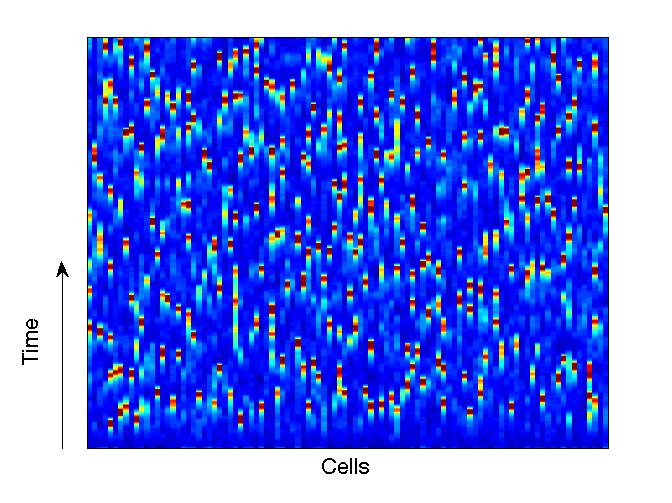
A typical simulation run of our model starting from all vegetative cells is shown in Fig. 3. There are clear anti-corelations between cells, due to the effective inhibition created by a reduction of emission by the competent cells. To get a more quantitative measure, we measured the spatial correlation function
| (4) |
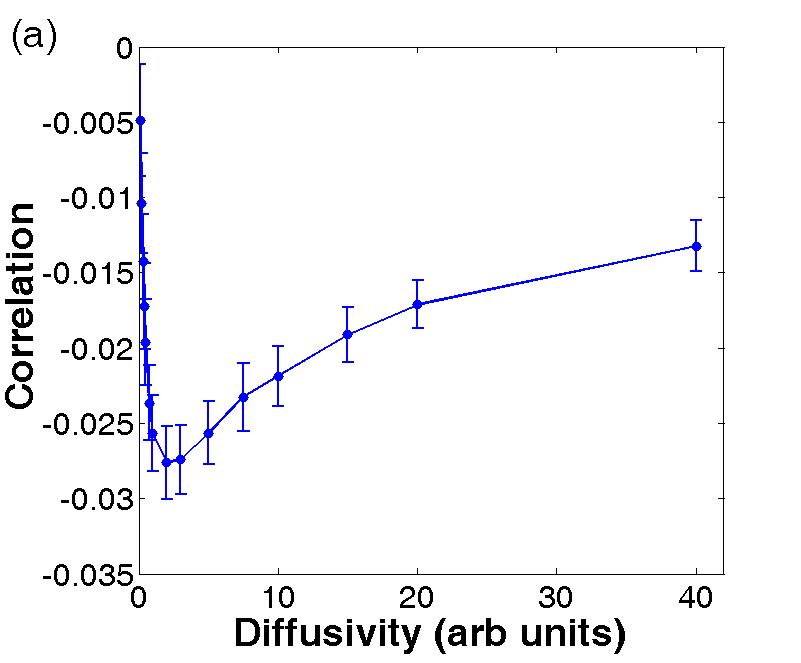
where we average over time, is the standard deviation, and the subscript refers to a specific cell . We then average over all cells to obtain an estimate . In Fig. 4a we present the function , i.e. the correlation between adjacent cells, versus the diffusion coefficient of the quorum sensing pheromone . For a small diffusivity, the inhibiting effect is negligible as the diffusion length is small compared to the inter-cell distance. As is increased, the mutual inhibition is increased and the correlation is negative, as expected. The maximal effect on nearest neighbors is when the characteristic length , given by the diffusivity and the degradation time is comparable to the inter-cellular distance. For the given parameters, the maximal effect on adjacent cells, i.e. =1, is obtained for . For an inter-cellular distance of , the highest mutual inhibition on nearest neighbors will be obtained for .
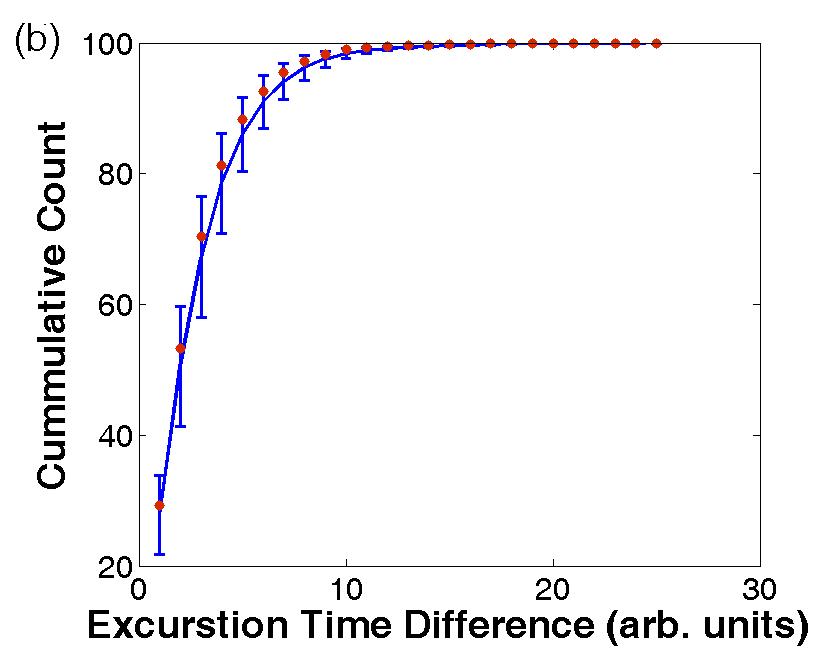
In the experimental data of elowitz , sister cells showed no correlation between their excursion times, once they become competent. This led to the assumption that there was no important spatial coupling. However, this conclusion might be inaccurate, as there might be correlations between the cycles of neighboring cells but not in their excursion times. In our simulations, excursion times only slightly changed with the diffusion coefficient (about 10% - data not shown). And, no correlation was observed between the excursion times of neighboring cells, as can be seen in Fig. 4(b), which is very similar to the results of elowitz . However, there are notable correlations in the times of competence onset of neighboring cells, as demonstrated in Fig. 4(a). This occurs because the field has little effect on the competent state itself, but is required to be high for the noise-induced excitation. Therefore, the excursion times measurement is misleading and does not definitively indicate whether there is, or there is not, a quorum sensing mechanism which influences the competence transition. Clearly, our predictions could be tested within the same experimental framework.
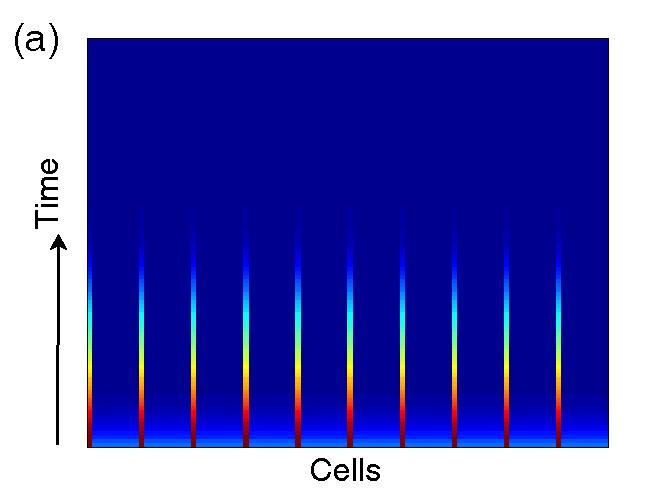
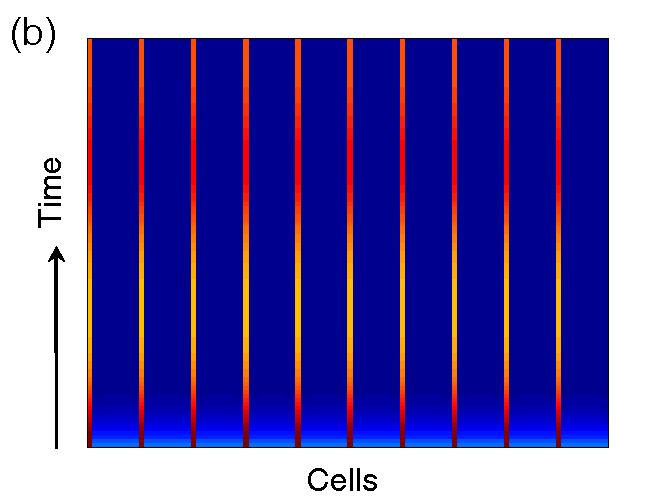
The existence of diffusing inhibition in this system suggests that under certain circumstances the colony should be able to support a patterned Turing state consisting of periodically repeating regions of competent and non-competent cells. There are two distinct possibilities; the system might have a Turing instability which eliminates the vegetative state completely or it might be multistable, meaning that patterned states co-exist with the uniform one. We have found no evidence of instability, but multistability can exist for large enough diffusion constant. In Fig. 5 we consider the temporal evolution of a colony with an initial stripe pattern, in which every tenth cell is competent. The values of the relevant parameters are chosen to be: , , , , and . For these values the K-S system of equations is bistable for and vegetative monostable for . When the diffusion of Q is slow (Fig. 5(a)), the local decrease in Q shifts the local K-S system of each competent cell to the monostable, vegetative state, the cells revert to vegetative and the pattern vanishes. But when diffusion is faster (Fig. 5(b)), the averaged value of can lie above the monostability threshold, and the pattern is stable.
We can get a better understanding of the stripe pattern and of the lack of a Turing instability by explicitly evaluating the field. If we approximate the in eq. 3 as a step function, we find that in steady-state,
| (5) |
where the sum ranges over competent cells. This geometric series can easily be calculated for any specific x; the result is shown in Fig. 6 as compared to the simulation data.
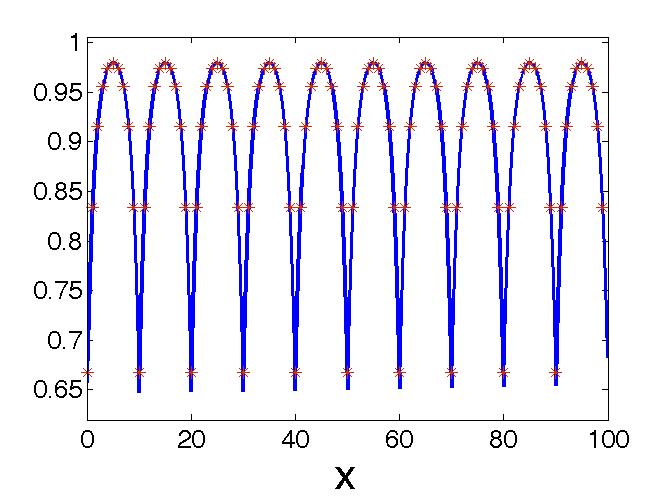
We see that the pattern is possible only because the self-inhibition is weakened sufficiently by the diffusion so as to allow the competent sites to remain in the bistable range. Paradoxically, the competent cells are the most inhibited, which is presumably why this pattern would not spontaneously appear from the uniform vegetative state. Studying this experimentally would necessitate preparing the system with an externally imposed pattern of CSF and then determining whether the pattern remains in place even after the external pattern is removed.
To summarize, we present a new model for collective behavior of a colony of B. Subtilis cells. The condition of each cell is described by the concentrations of two proteins, ComK and ComS. The dynamics is described by a set of two rate equations, with a double-feedback loop. The production rates effectively depend on the cell density in the entire colony, sensed by a diffusible pheromone. This pheromone is likely to depend on the protein ComK. This additional mechanism creates an effective inhibition between neighboring cells, leading to anti-correlation in the cells competent/vegetative cycles. Excursion times of neighboring cells are found to be uncorrelated, due to the self-excitatory mechanism of ComK, also in agreement with experimental results. These findings can be experimentally verified by the direct measurement of ComK concentration in the cells, as was done in ref. elowitz via fluorescence techniques.
Acknowledgements.
This work has been supported in part by the NSF-sponsored Center for Theoretical Biological Physics (grant numbers PHY-0216576 and PHY-0225630). EBJ was partially supported by the Tauber fund.References
- (1) D. Dubnau, Ann. Rev. Microbiol. 53, 217 (1999).
- (2) E. Cohen, D. Kessler and H. Levine, Phys. Rev. Lett. 94, 098102 (2005).
- (3) D. Dubnau and R. Losick, Mol. Microbiol. 61, 564 (2006).
- (4) R. Karmakar and I. Bose, arXiv:q-bio.QM/0702055v1(2007).
- (5) H. Maamar and D. Dubnau, Mol. Microbiol. 56, 615 (2005).
- (6) W.K. Smits,C.C. Eschevins, K.A. Susanna, S. Bron, O.P. Kuipers and L.W. Hamoen, Mol. Microbiol. 56, 604 (2005).
- (7) G.M. Suel, J. Garcia-Ojalvo, L.M. Lieberman and M.B. Elowitz, Nature 440, 545 (2006).
- (8) G. M. Suel, R. P. Kulkarni, J. Dworkin, J. Garcia-Ojalvo and M. B. Elowitz, Science, 315, 1716 (2007).
- (9) A. Goldebeter, Biochemical Oscillations and Cellular Rhythms, Cambridge Univ. Press. (1996).
- (10) M. B. Elowitz, A. J. Levine, E. D. Siggia and P. S. Swain, Science 202, 1183 (2002).
- (11) J. Paulsson, Nature 427, 415 (2004).
- (12) N. Rosenfeld, J. W. Young, U. Alon, P. S. Swain and M. B. Elowitz, Science 307, 1962 (2005).
- (13) J. M. Pedrazza and A. van Oudenaarden, Science 307, 1965 (2005).
- (14) B. L. Bassler and R. Losick, Cell 125, 237 (2006).
- (15) E. Ben-jacob et al, Trends in Microbiology 12 (8) 366-372 (2004).
- (16) E. Ben-Jacob and H. Levine, J. Royal Soc. Interface 3, 197 (2006).
- (17) A. Minsky, private communication.
- (18) L. W. Hamoen, G. Venema and O.P. Kuipers, Microbiology 149, 9 (2003).
- (19) B.A. Lazazzera,I.G. Kurster, R.S. McQuade and A.L. Grossman, J. Bacteriology 181, 5193 (1999).
- (20) B. Lazezzera, Curr. Opin. Microbiol. 3, 177 (2000).
- (21) D. Schultz, unpublished.
- (22) R.M. Berka, J. Hahn, M. Albano, I. Draskovic, M. Persuh, X. Ciu, A. Sloma, W. Widner and D. Dubnau, Mol. Microbiol. 43, 1331 (2002).