The Great Observatories Origins Deep Survey
Abstract
Aims. We present the full data set of the spectroscopic campaign of the ESO/GOODS program in the GOODS-South field, obtained with the FORS2 spectrograph at the ESO/VLT.
Methods. Objects were selected as candidates for VLT/FORS2 observations primarily based on the expectation that the detection and measurement of their spectral features would benefit from the high throughput and spectral resolution of FORS2. The reliability of the redshift estimates is assessed using the redshift-magnitude and color-redshift diagrams, and comparing the results with public data.
Results. Including the third part of the spectroscopic campaign (12 masks) to the previous work (26 masks, Vanzella et al. 2005, 2006), 1715 spectra of 1225 individual targets have been analyzed. The actual spectroscopic catalog provides 887 redshift determinations. The typical redshift uncertainty is estimated to be . Galaxies have been selected adopting different color criteria and using photometric redshifts. The resulting redshift distribution typically spans two domains: from z=0.5 to 2 and z=3.5 to 6.3. The reduced spectra and the derived redshifts are released to the community through the ESO web page ††thanks: The catalog (Table LABEL:tab:tblspec) is available in electronic form at the CDS via anonymous ftp to cdsarc.u-strasbg.fr (130.79.128.5) or via http://cdsweb.u-strasbg.fr/cgi-bin/qcat?J/A+A/.
Key Words.:
Cosmology: observations – Cosmology: deep redshift surveys – Cosmology: large scale structure of the universe – Galaxies: evolution.1 Introduction
The Great Observatories Origins Deep Survey (GOODS) is a public, multi-facility project started in the early 2000 designed to gather the best and deepest multiwavelength data for studying the formation and evolution of galaxies and active galactic nuclei, the distribution of dark and luminous matter at high redshift, the cosmological parameters from distant supernovae (Riess et al. (2004)), and the extragalactic background light (for an overview of GOODS, see Dickinson et al. (2001), Dickinson et al. (2003), Renzini et al. (2003), Giavalisco et al. (2004a)).
The program targets two carefully selected fields, the Hubble Deep Field North (HDF-N) and the Chandra Deep Field South (CDF-S), with three NASA Great Observatories (HST, Spitzer and Chandra), ESA’s XMM-Newton, and a wide variety of ground-based facilities. The area common to all the observing programs is 320 arcmin2, equally divided between the North and South fields. In the last five years the CDF-S has been the target of several spectroscopic campaigns (Cristiani et al. (2000), Croom et al. (2001), Bunker et al. (2003), Stanway et al. (2004), Strolger et al. (2004), van der Wel et al. (2004), Dickinson et al. (2004a), Szokoly et al. (2004), Le Fevre et al. (2005), Mignoli et al. (2005), Ravikumar et al. (2007)).
This is the third paper in a series presenting the results of the GOODS spectroscopic program carried out with the VLT/FORS2 spectrograph. For a full description of its aims we refer to the first two articles (Vanzella et al. (2005)-RUN1 and Vanzella et al. (2006)-RUN2, V05 and V06, hereafter).
Here we recall that the ESO/GOODS spectroscopic program is designed to observe all galaxies for which VLT optical spectroscopy is likely to allow the redshift determination. The program makes full use of the VLT instrument capabilities (FORS2 and VIMOS), matching targets to instrument and disperser combinations in order to maximize the effectiveness of the observations. The magnitude limits and selection bandpasses to some extent depend on the instrumental setup being used. In the present sample, the mean magnitude at redshift below 2 is 23.161.20, while for the higher redshift part it is 25.340.84.
In the present paper we present the entire FORS2 spectroscopic campaign (including new 12 masks). Half of these 12 masks have been observed in visitor mode during December 2004 (RUN3, hereafter), and the other six masks (RUN4, hereafter) in the period 2005 - middle 2006 in service mode. Observations performed in December 2004 were mainly focused on color-selected Lyman break “dropout” targets and the last six masks (RUN4) were mainly dedicated to Lyman break “dropout” and sources detected at 24m with the Multiband Imaging Photometer for Spitzer (MIPS) instrument aboard the Spitzer Space Telescope. 180 new redshift measurements out of 345 individual sources have been derived from RUN3 and RUN4, several galaxies have been observed two or three times (mainly -dropouts and -dropouts) in order to gain signal, in this way 38 confirmation at redshift beyond 5 have been carried out.
The VIMOS spectroscopic survey in the GOODS-S field has completed its run and hundreds of redshift determinations will be released, mainly in the redshift range 0z3.5 (Popesso et al. in preparation).
The paper is organized as follows. Sect. 2 describes the target selection, while Sect. 3 describes the observations and data reductions. The redshift determination is presented in Sect. 4. In Sect. 5 we discuss the full data set and in Sect. 6 we discuss two individual sources. In Sect. 7 we summarize briefly the whole spectroscopic campaign and give our conclusions.
Throughout this paper the magnitudes are given in the AB system 111Oke (1977), AB and the ACS F435W, F606W, F775W, and F850LP filters are designated hereafter as , , and , respectively. We assume a cosmology with and km s-1 Mpc-1.
2 Target Selection
The selection of galaxies have already been described in V05 and V06. Here we recall the adopted criteria:
-
1.
Primary catalog: and . This should ensure redshifts for ordinary early-type galaxies (whose strongest features are expected to be absorption lines), and higher redshifts for intrinsically bluer galaxies likely to have emission lines.
-
2.
Secondary catalog: and .
-
3.
Photometric-redshift sample: and , from Mobasher et al. (2004).
- 4.
-
5.
A few miscellaneous objects, including host galaxies of supernovae detected in the GOODS ACS observing campaign.
In the first RUN (V05), targets were selected from a preliminary catalog based on 3-epoch v0.5 GOODS ACS images.
| ID(v1.1) | zspec | class. | Quality | comments | ||
| GDS J033245.99-275108.3 | 23.48 | 0.47 | 1.238 | em. | B | [O ii]3727 |
| GDS J033246.04-274929.7 | 26.06 | 1.77 | 5.787 | em. | A | LyA (faint continuum) |
| GDS J033246.05-275444.8 | 21.49 | 0.53 | 0.733 | abs. | A | CaH,g-band,H,Mg,CaFe |
| GDS J033246.16-274752.3 | 24.46 | 0.43 | 1.221 | em. | B | [O ii]3727 |
| This table is available in its entirety via . | ||||||
| A portion is shown here for guidance regarding its form and content. | ||||||
| Mask ID | Date | exp.time (s) |
|---|---|---|
| (V05) | ||
| 990247 | Dec.2002 - Jan. 2003 | 121200 |
| 984829 | Dec.2002 - Jan. 2003 | 121200 |
| 985831 | Jan. - Feb. 2003 | 151200 + 663 |
| 973934 | Jan. 2003 | 121200 |
| 952426 | Jan. 2003 | 121200 |
| 981451 | Jan. - Dec. 2003 | 241200 |
| 995131 | Oct. 2002 | 81800 |
| 994852 | Oct. 2002 | 81800 |
| 990652 | Dec. - Nov. 2002 | 141200 + 300 + 900 |
| (V06) | ||
| 914250 | Aug. 2003 | 171200 |
| 905513 | Sept. 2003 | 181200 |
| 943018 | Sept. 2003 | 121200 |
| 924345 | Sept. 2003 | 121200 |
| 945143 | Sept. - Oct. 2003 | 121200 + 31000 |
| 992438 | Oct. - Dec. 2003 | 121200 |
| 985931 | Nov. 2003 | 121200 + 2120 |
| 990204 | Dec. 2003 | 121200 |
| 904509 | Dec. 2003 | 121200 |
| 991435 | Dec. 2003 | 121200 |
| 935030 | Dec. 2003 | 121200 |
| 951937 | Dec. 2003 | 121200 + 1100 + 500 |
| 960930 | Dec. 2003 | 121200 |
| 961839 | Jan. 2004 | 121200 |
| 932802 | Jan. 2004 | 121200 |
| 993304 | Jan. 2004 | 121200 |
| 951526 | Feb. 2004 | 31200 |
| 912940 | Dec. 2004 | 181200 |
| 925109 | Dec. 2004 | 161200 |
| 932249 | Dec. 2004 | 181200 |
| 940129 | Dec. 2004 | 171200 |
| 943544 | Dec. 2004 | 151200 |
| 965910 | Dec. 2004 | 181200 |
| 952801 | Nov. - Dec. 2005 | 15900 + 4870 |
| 952942 | Oct. - Nov. 2005 | 15900 + 2870 |
| 953015 | Nov. 2005 | 18900 + 2870 |
| 953048 | Dec. 2005 - Jan. 2006 | 33900 + 2870 |
| 953132 | Feb. - Aug. 2006 | 17900 + 4870 + 370 |
| 953159 | Jul. - Oct. 2006 | 18900 + 2870 + 436 |
In the following RUNs (2,3 and 4), targets were selected from the ACS catalog version r1.1z, based on the 5-epoch v1.0 ACS images. The r1.1z catalog is drawn from the r1.0z SExtractor run, and merely corrects errors and omissions in the r1.0z catalog files. The majority of the targets have been selected following the above criteria, in particular giving priority to LBGs. Additionally, in RUN4, sources detected at 24m with the MIPS were included to fill out the masks. In addition to requiring 24m detection, these sources were selected on their optical properties to take advantage of the FORS2 red performance, and mainly consisted of MIPS-detected extremely red objects (EROs) and distant red galaxies (DRGs; see Papovich et al. (2006)) with photometric redshift , thus putting them in a range where FORS2 may be capable of measuring redshifts.
For this data release, that includes the entire GOODS/FORS2 campaign (RUN1, 2, 3, 4) the objects have been matched to the ACS catalog version r1.1z.
1715 spectra of 1225 individual targets have been extracted from all RUNs (multiple observations have been carried out, especially for the high redshift candidates). The FORS2 spectroscopic catalog lists 887 redshift determinations in the GOODS-S field.
3 Observations and Data Reduction
The VLT/FORS2 spectroscopic observations were carried out in service and visitor (RUN3) mode between October of 2002 and October of 2006. A summary of the observations is presented in Table LABEL:tab:tblobs. Considering the previous works (V05, V06, 26 FORS2 masks) and the present work (RUN3 and RUN4, 12 masks), a total of 38 FORS2 masks have been acquired. In all cases the grism was used as dispersing element without order-separating filter. This grism provides a scale of roughly 3.2Å pix-1. The nominal resolution of the configuration was R==660, which corresponds to 13Å at 8600Å. The spatial scale of FORS2 is /pixel. The slit width was always . In order to effectively improve the sky and fringe subtraction and remove CCD blemishes, dithering of the targets along the slits was applied, with typically steps of 0,8 pixels during RUNs 1 and 2, and 0,6 pixels in RUNs 3 and 4. In general the spectral coverage ranges from 6000 to 10000Å.
3.1 Data Reduction
Data have been reduced with a semi-automatic pipeline that we have developed on the basis of the MIDAS package (Warmels (1991)), using commands of the LONG and MOS contexts. We have used the procedures described in the previous works (V05, V06) with minor improvements.
In the case of multiple observations of the same source in different masks, the one dimensional spectra have been co-added weighting according to the exposure time, the seeing condition and the resulting quality of each extraction process (defects present in the CCD, object too close to the end of the slit, etc.). A visual check of the two dimensional frames has been performed and in some cases the two dimensional spectra have also been co-added, in order to improve and guide the visual inspection.
We emphasize here that we opted to observe the science targets without an order-sorting filter, implying deleterious effects to the flux calibration. The second order overlap becomes important at wavelengths above 8000Å depending on the color of the target. However, the fluxes derived from spectra are in general consistent with the ACS photometry (an example for a red and blue source is shown in V06, Figure 1).
For the red objects that dominate the FORS2 target selection, we felt that the improved wavelength coverage more than compensates for the possible unreliability of the flux calibration. Due to both this second order light and uncertain slit losses, we caution against using the calibrated fluxes for scientific purposes. Fluxes in the released one dimensional spectra are given in units of erg s-1 cm-2 Å-1.
4 Redshift Determination
Spectra of 1225 individual objects have been extracted from all RUNs, out of which 887 redshifts have been determined. In the large majority of the cases the redshift has been calculated through the identification of prominent features of galaxy spectra: depending on the redshift and the nature of the source the 4000Å break, Ca H and K, g-band, MgII 2798-2802, AlII 3584, FeII 2344,2383Å, Ly, Si ii 1260.4Å, O i 1302.2Å, C ii 1335.1Å, Si iv 1393.8,1402.8Å, Si ii 1526.7Å, C iv 1548.2, 1550.8Å in absorption and Ly, NIV]1485Å, [O ii]3727, [O iii]5007, H, H in emission. The redshift estimation has been performed cross-correlating the observed spectrum with templates of different spectral types (S0, Sa, Sb, Sc, Elliptical, Lyman Break, etc.), using the package in the IRAF environment. During the FORS2 campaign we have accumulated spectra of different categories (LBGs with absorption and emission lines, galaxies in the redshift interval 1.4-2, etc.) that have been used to build empirical spectral templates to identify similar spectral features in the cross-correlating process.
The redshift identifications are summarized in Table LABEL:tab:tblspec and are available at the URL .
In Table LABEL:tab:tblspec, the column ID contains the target identifier, that is constructed out of the target position (e.g., 033206.44-274728.8) where GDS stands for GOODS South. The coordinates are based on the GOODS v1.1 astrometry. The columns and (-) list the magnitude (SExtractor “MAGAUTO”) and the color (SExtractor “MAGISO”) of the sources derived from the catalog v1.1. The color has been measured through isophotal apertures defined in the band image (as done in Dickinson et al. (2004a) and Giavalisco et al. (2004b)).
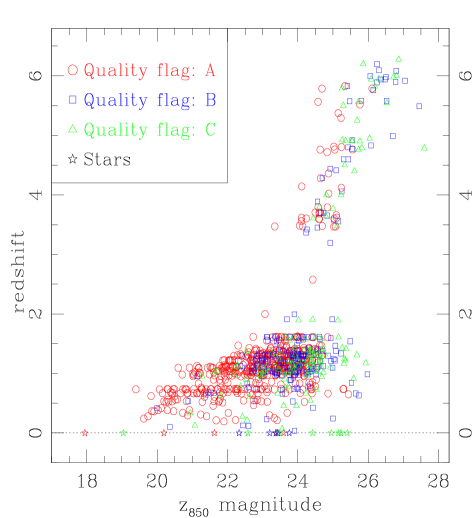
The quality flag (QF hereafter), indicates the reliability of the redshift determination. As described in the previous works (V05, V06), the QF has been divided into three categories: “A”, “B” and “C” (secure, probable and tentative redshift determination, respectively). In general the QF correlates with the goodness of the spectrum. In some cases, the presence of defects in the CCD or particularly difficult extractions may lead to very noisy one-dimensional spectrum, however, the presence of evident spectral features in the two-dimensional spectrum may still give a reliable redshift estimation. In the FORS2 campaign, 514 sources have been classified with quality “A”, 226 with quality “B”, 146 with “C”, and 349 with “X”, an inconclusive redshift spectrum.
The flag ”class” groups the objects for which emission line(s) (“em.”), absorption-line(s) (“abs.”) or both (“comp.”) are detected in the spectrum. 19 out of 887 sources have been classified as stars.
In 28 of the cases the redshift is based on single emission line, usually identified as [O ii]3727 or Ly. In these cases the continuum shape, the presence of breaks, the absence of other spectral features in the observed spectral range and the broad band photometry are particularly important in the evaluation. The quality for these sources ranges from “A” to “C” depending on the additional information described above (30 of the sample with a single emission line have QF=”A”).
The comments column contains additional information relevant to the particular observation. The most common ones summarize the identification of the principal lines, the inclination of an emission line due to internal kinematics, the weakness of the signal (“faint”), the low S/N of the extracted spectrum (“noisy”), the apparent absence of spectroscopic lines (“featureless continuum”), etc.
In few cases the spectrum extracted is the combination of more than one source in the slit and where possible the redshifts of the “components” have been estimated separately. In all FORS2 sample, 11 sources in the GOODS-S field are not present in the ACS photometric catalog v1.1. Six of them have a redshift estimation. Three out of six appear to be emission line objects whose continuum is too faint and has not been detected in the band. The other seven sources are outside the GOODS-S area.
4.1 Reliability of the redshifts - diagnostic diagrams
From Figure 1 it is evident that the number of low quality redshift measurements increase with increasing magnitude. Also in the case of low redshift galaxies z0.5 the uncertainty increase due to the adopted spectral range (6000 up to 10000Å). In other few cases, serendipitous relatively bright sources enter in the slit because of the dithering shift, for those sources the exposure time is reduced and the sky subtraction complicated. In these cases the quality of the reduced spectra tends to be lower.
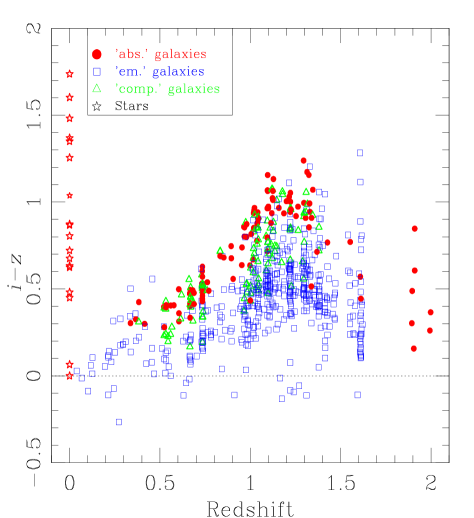
Figure 2 shows the behavior of the color-redshift for galaxies at redshift less than 2, where the two populations of “emission-line” (star-forming) and “absorption-line” (typically elliptical) galaxies are clearly separated. As expected, the mean color of the absorption-line objects outline the upper envelop of the distribution. The intermediate cases “comp.” with emission and absorption features (green triangles) lie in the middle. The presence of LSS in the field (and discussed below) is evident in the figure as vertical concentrations of points at redshifts 0.7, 1.1, 1.2, 1.3, 1.6.
The emission-line objects show in general a bluer color and a broader distribution than the absorption-line sources. Such bimodality in the color distribution with a larger scatter of the blue component with respect to the red one has been observed in other surveys and can be ascribed to the different star formation histories (SFHs) of the two populations. The former being the result of a large variety of SFHs that extend to much lower redshift than the red ones (resulting in their scattered bluer colors), the latter the result of a more similar SFHs in which the bulk of the activity happens at higher redshift (Menci et al. (2005)).
| redshift range | A | B | C | |
|---|---|---|---|---|
| 3 z4.5 | 26 | 14 | 11 | 51 |
| 4.5z5.5 | 8 | 9 | 14 | 31 |
| 5.5z6.5 | 5 | 17 | 10 | 32 |
| 39 | 40 | 35 |
| A | B | C | |||||
|---|---|---|---|---|---|---|---|
| emission | 1.140 | 0.039 | 1.621 | 282 | 152 | 84 | 518 |
| absorption | 1.005 | 0.337 | 1.998 | 86 | 18 | 21 | 125 |
| em. & abs. | 1.022 | 0.382 | 1.380 | 101 | 9 | 0 | 110 |
| 1.098 | 0.039 | 1.998 | 469 | 179 | 105 |
5 Discussion
| z bin | zspec | compl.() | compl.() | compl.() |
|---|---|---|---|---|
| [0.6..0.7[ | 46 | 11 | 7 | 5 |
| [0.7..0.8[ | 62 | 26 | 18 | 13 |
| [0.8..0.9[ | 23 | 17 | 9 | 5 |
| [0.9..1.0[ | 54 | 22 | 11 | 7 |
| [1.0..1.1[ | 130 | 48 | 29 | 20 |
| [1.1..1.2[ | 85 | 77 | 44 | 27 |
| [1.2..1.3[ | 107 | 84 | 45 | 30 |
| [1.3..1.4[ | 86 | 67 | 31 | 19 |
| [1.4..1.5[ | 30 | 48 | 19 | 10 |
| [1.5..1.6[ | 15 | 37 | 11 | 6 |
| [1.6..1.7[ | 33 | 84 | 32 | 18 |
| [1.7..1.8[ | 0 | 0 | 0 | 0 |
| [1.8..1.9[ | 2 | 12 | 3 | 1 |
| [1.9..2.0[ | 5 | 36 | 8 | 3 |
| [2.0..2.1[ | 0 | 0 | 0 | 0 |
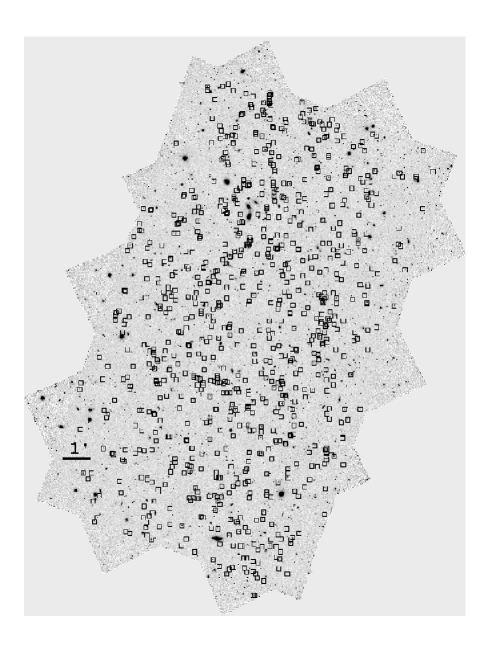
The present release lists 1225 spectra. 887 out of 1225 sources have a redshift determination (19 are stars, =0), corresponding to a success rate on the redshift determination of about 72 (assuming that all redshift measurements are correct). Sources with inconclusive redshift measurement are in general faint or without reliable spectral features (indicated in the “comment” column as or ). The observations aimed at a uniform sky coverage of the GOODS-S field. Six FORS2 MXU-masks are necessary to cover the 150 square arcmin of the GOODS-S field, so with 38 masks (the entire FORS2 campaign) the field has been covered roughly 6 times (the spatial distribution of the 887 sources in the GOODS-S area is shown in Figure 3).
114 targets out of 887 are confirmed to be LBGs in the redshift range 3z6.3 (see Table LABEL:tab:highz), in agreement with the dropout selection techniques (Giavalisco et al. (2004b), Dickinson et al. (2003)).
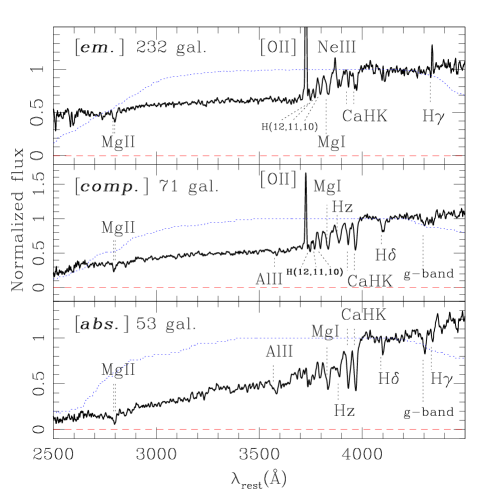
753 out of 772 sources at redshift less than 2 have been identified as galaxies (19 are stars, see Table LABEL:tab:z_properties). 628 of them (including “em.” and “comp” classes) show the [O ii]3727 emission up to redshift 1.621, while 125 galaxies identified with absorption lines only (“abs.” class, mainly Ca H and K, MgII 2798-2802) span the range of redshift between 0.3-2.0. The composite spectra of the three categories ’‘em.” (232 starforming galaxies), “comp” (71 intermediate galaxies) and “abs.” (53 elliptical galaxies) selected in the redshift range 0.8-1.3 are shown in Figure 4, from top to bottom panels, respectively.
H and g-band are not detected in the “em.”-like galaxies, but they are well detected in the other two categories, consistently with the presence of older stellar populations. Lines of the Balmer series have been detected down to H12. All composite spectra show MgII in absorption.
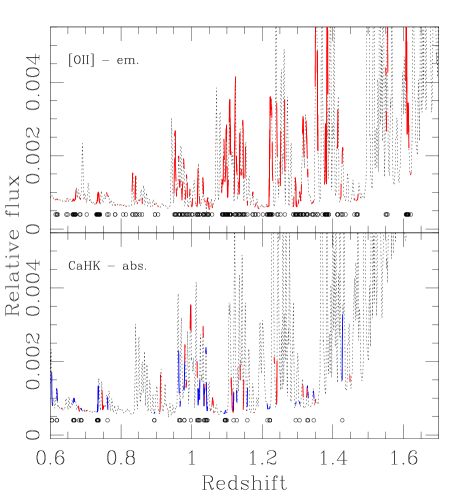
Obviously, in the presence of emission lines, it is easier to determine a redshift. As an extreme example, emission lines may be identified without the presence of the continuum in the spectrum (if the equivalent width is sufficiently large), while absorption lines not. For this reason the detection of absorption features in relatively faint sources is more uncertain and more sensitive to the residuals in the sky subtraction, on average they are one magnitude brighter than the emission lines galaxies (the average magnitude of “em.”-like galaxies is 23.65 with redshift measurements up to =26, while “abs.”-like galaxies have an average of 22.44 and with redshift measurements up to =25). A flavour of this effect is shown in Figure 5, where the coverage of the [O ii]3727 line (top panel) and Ca H and K absorption doublet (bottom panel) over the sky emission spectrum is shown as a function of the measured redshift. We note that the [O ii]3727 emission has been detected even over the peaks of the strongest sky emission lines, while the absorption features tend to be identified in the valleys between the sky lines, in particular beyond redshift 1 (e.g. ellipticals detected at redshift z1.3).
This is a likely reason why the majority of galaxies identified in the present work belong to the “em.” class. Alternatively, or in addition to observational effects, the [O ii]3727 is a classic star forming indicator and the redshift interval corresponds to the peak of the mean star formation intensity of the universe.
5.1 Completeness of the sample
A direct way to derive a rough estimate of the completeness of the present sample is to compare spectroscopic and photometric redshifts down to a common magnitude limit and bins of redshift. We have used the recent photometric redshift measurements in the GOODS-S field, based on the “PSF-matched” GOODS-MUSIC photometric catalog of Grazian et al. (2006). As shown in that work, photometric redshifts have been estimated with great accuracy, reaching an average scatter of =0.06. Table LABEL:tab:compl summarize the completeness of the spectroscopic sample described in the present work. Column two shows the number of spectroscopic redshifts and columns three, four and five show the spectroscopic completeness in each redshift bin (Nzspec/Nzphot) down to =24, 25 and 26, respectively. As targeted, part of the FORS2 campaign has identified galaxies mainly in the redshift range 0.8-2 (see also Figure 6, middle and bottom panels). At present, at redshift 1.2 the completeness is 30 down to =26.
In the top panel of Figure 6 the photometric redshift distribution of galaxies in the GOODS-S field with redshift less than 2 and magnitude brighter than 26 is shown. The spectroscopic redshift distribution is shown in the bottom panel of the same figure, with a magnitude limit 26. One of the main target of the FORS2 campaign is to provide spectroscopic identifications in the redshift range 0.8-2, according to the color selection criterium (or for the redder ones, see Sect. 2). The photometric redshift distribution down to =26 of sources with is shown in the middle panel of Figure 6, in which it is evident that the color cut selects mainly galaxies at redshift beyond 1. Apart from the normalization, the two distributions (middle and bottom panels) show a similar shape. Both the photometric and spectroscopic redshift distributions of sources with show approximately 90 of galaxies at redshift beyond 0.8. The percentage increases to 96 if we restrict the color cut to . As discussed in V06 and recalled in Sect. 2, galaxies in the redshift interval 0.8-2 were selected also on the basis of photometric redshifts provided by Mobasher et al. (2004), for this reason the present sample contains confirmed galaxies at redshift beyond 1 and bluer than (see also Figure 2).

5.2 Redshift distribution and Large Scale Structure
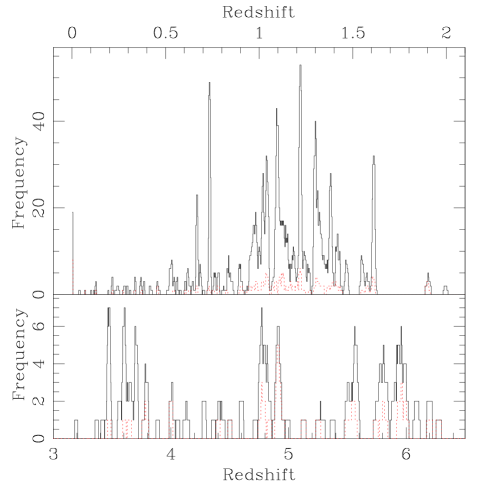
The top and bottom panels of Figure 7 show the redshift distribution of the galaxies at redshift less than 2 and greater than 3, respectively (solid line QF “A” and “B”, dotted line QF “C”). Galaxies have been counted in a variable bin which has been moved across the redshift interval with a step of 0.003 (of the order of 3 times the error of the redshift estimation). The bin has been calculated at each redshift to be equivalent to a velocity =2000 km/s, so the binning in Figure 7 is constant in the velocity space (=(1+z)/ where is the speed of light).
In general, the redshift distribution is consistent with the selection criteria adopted, with the majority of the sources having redshifts in the interval 1z2 and z3 (top and bottom panels of Figure 7, respectively).
At redshift less than 2, as discussed in the previous work (V06) and including the new spectroscopic identifications (RUN3 and 4), large scale structures are confirmed by the spikes at redshift 0.667 (23 galaxies), 0.735 (49 galaxies), 1.096 (43 galaxies), 1.220 (53 galaxies), 1.301 (40 galaxies), 1.382 (28 galaxies) and 1.611 (32 galaxies). Some of these peaks are already know in literature (Cimatti et al. (2002), Gilli et al. (2003), Le Fevre et al. (2004), Adami et al. (2005), Cimatti et al. (2004)). The overdensity of galaxies detected at z1.61 is increased by 50 from the previous releases, and counts more than 30 galaxies, all identified through the [O ii]3727 emission at 9730Å.
Comparing the roughly expected (photometric)redshift distribution in GOODS-S field (middle panel of Figure 6) and the observed one, we note (see Figure 7) possible under-densities of galaxies in the redshift interval 1-1.5, particularly at 1.06-1.08 and 1.27-1.28. The former is close to the sky “A”-band absorption where the transmission is approximately less that 50 and acts mainly in the [O ii]3727 redshift interval 1.03-1.06 (with a less absorbing tail up to 1.074, http://tdc-www.harvard.edu/instruments/hectospec/habsky.html). This sky absorption band is not introducing an evident bias, 42 [O ii]3727 emission line galaxies have been identified in the more sky absorbed redshift range 1.03-1.06, only 3 galaxies in the redshift interval 1.06-1.08 (zero sources between 1.06-1.07) and 47 galaxies in the range 1.08-1.10 where there is the overdensity discussed above.
At redshift beyond 3, galaxies show the expected mean redshift consistently with the color selection criteria (Giavalisco et al. (2004b), Dickinson et al. (2004a)). , and -dropouts sources have been confirmed to be at = 3.7, 4.9 and 5.9, respectively. The success rate of the spectroscopic redshift measure for these categories is of the order of and the efficiency of the selection is greater than (Vanzella et al. in preparation).
6 Individual notes
6.1 A double peaked Ly emission line at redshift 3.7
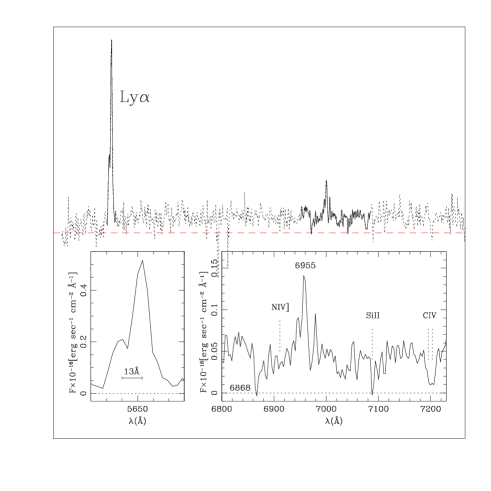
The source GDS J033217.22-274754.4 has been selected as -dropout galaxy and has been confirmed to be at redshift 3.649. The main spectral feature is the Ly emission line and the break of the continuum just blueward the line. Two interstellar absorption lines (SiII 1526.7 and CIV 1548.2,1550.8) have also been detected (see Figure 8).
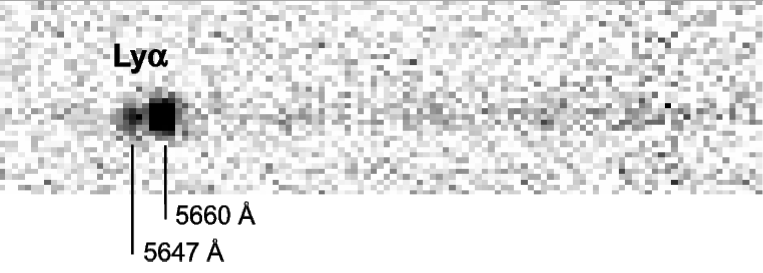
The emission line at wavelength 5650Å shows an evident double peaked structure (see Figure 8 and Figure 9) with a separation of 13Å.
Several authors have analyzed the transfer of Ly photons in static and expanding neutral clouds in various physical conditions (Adams (1972); Urbaniak & Wolfe (1981); Zheng & Miralda -Escudè (2002); Ahn et al. (2003); Verhamme et al. (2006)). If the shell is static, the profile shows two emission peaks with the same flux, blueshifted and redshifted with respect the systemic redshift. In the present case the two peaks show different intensities and the observed separation is much larger than the expected separation produced by a static shell (0.24Å at the redshift of the galaxy), hence, the outflow of material seems to be the most plausible reason.
In the outflow picture, the flux of the blue peak is decreased if the expansion velocity of the shell is increased and also its position depends to the velocity expansion. Powered by star formation and supernova explosions, a wind creates a large shell of swept up material and the observation towards such an object would intersect the shell in the front and the rear end giving rise to a double peaked emission line profile. If the expansion velocity is sufficiently high, the blueshifted secondary peak disappears and the red wing of the Ly profile get more flux producing the characteristic asymmetric profile observed in high redshift star forming galaxies.
| Line | (Å) | redshift | |
|---|---|---|---|
| Ly(1215.8) (blue) | 5647 | 3.645 | |
| Ly(1215.8) (red) | 5660 | 3.655 | |
| ?? | 6955 | ||
| ?? | 6868 | ||
| SiII(1526.7) | 7089 | 3.643 | |
| CIV(1548.2-1550.8) | 7200 | 3.647 |
Such double peaked profiles of optical emission lines have been observed for nearby starburst galaxies which exhibit these large scale outflows typically termed superwinds (Heckman et al. (1990)). Additionally, a double peaked Ly emission line profile was found from the starburst galaxy T1214–277 by Mas-Hesse et al. (2003), who concluded that the feature is caused by emission in an outflow. Double-peaked Ly profiles have been observed also at redshift 3, in spectra of star forming galaxies (Fosbury et al. (2003), Christensen et al. (2004), Venemans et al. (2005), Tapken et al. (2007)).
In the present case, the measured separation between the two peaks (13Å) is probably due to an expanding neutral cloud. Moreover, it is worth to note that the redshift of the blue peak is consistent with the redshift derived from the SiII 1526.7 and CIV 1548.2,1550.8 lines (see Table LABEL:tab:lines). This indicates a plausible connection between the outflow of the gas deduced from the double peaked Ly profile and that observed from the interstellar lines: the blue peak of the Ly line and the interstellar absorption lines are possibly probing the same behavior of the medium (material approaching the observer). Interpreting the double-peak as due to an expanding shell, the velocity difference between the two peaks corresponds to (Verhamme et al. (2006)). The inferred velocity ( 320 km/s) is consistent with the value measured by Shapley et al. (2003) from the velocity difference between stellar and interstellar lines in a large sample of LBG spectra at redshift 3.
It is worth to note that other two lines have been detected on the spectrum, one in absorption (6868Å) and the other in emission (6955Å), that have not been identified. Detailed spectroscopic observations have to be performed in order to clarify the nature of such “additional” lines.
6.2 MgII absorbers at z=1.61 in spectra of LBGs at z3 ?
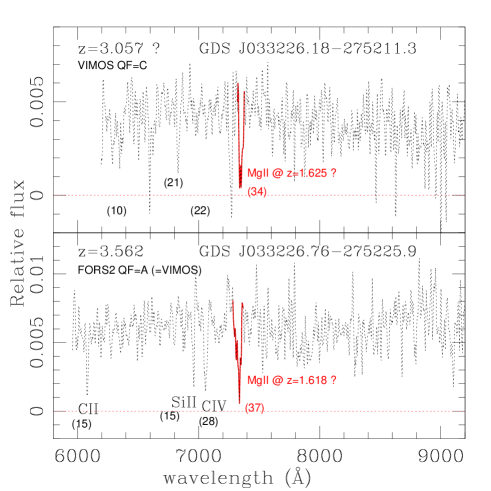
Two galaxies, GDS J033226.18-275211.3 and GDS J033226.76-275225.9 selected as U and -dropout, respectively, have been observed during the FORS2 and VIMOS campaign (Popesso et al. in preparation).
In the case of GDS J033226.76-275225.9 (bottom panel of Figure 10) the measured redshifts from FORS2 (3.562, QF=”A”) and VIMOS (3.554, QF=”C”) agree within the errors. In the FORS2 spectrum, the CII 1335.1, SiII 1526.7 and CIV 1548.2,1550.8 have been detected. The latter doublet shows a FWHM larger than other single lines (see Figure 10 where the numbers in the parenthesis indicate the FWHM of the lines). The absorption line at 7331.1Å may be associated to FeII 1608.5 in absorption at the redshift of the galaxy. However such a feature is unusual if compared with other LBGs, moreover the FWHM of the line is evidently large (37Å) with respect to the other lines.
Similarly, in the spectrum of GDS J033226.18-275211.3 there is an absorption line with a FWHM that apparently is not consistent with the redshift of the source (z=3.057 from the VIMOS spectroscopic survey). The redshift is not reliable (QF=”C”) and the FORS2 absorption features (marked with their FWHM in the top panel of Figure 10) are not consistent with the VIMOS redshift. However, the two relatively strong absorption lines around 7300Å seem to have no easy solution if associated to the galaxy. We note that also in this case the line at 7349.0Å shows a FWHM of 34.1Å, similarly to the line discussed above.
The fact that the two galaxies are relatively close in the sky (16.5 arcsec) and show two features at similar wavelength, apparently not consistent with the galaxy redshift, support the interpretation in terms of intervening absoprtion. Moreover, in both cases, the FWHM of the lines is large and suggest the presence of a doublet (as we see for the CIV 1548.2,1550.8 doublet, bottom panel of Figure 10). Interestingly, if the two spectral features are MgII 2798,2802 absorbers, their redshifts turns out to be 1.618 and 1.624, very close to the overdensity at redshift 1.611 detected in the field (see Figure 7 and Sect. 5.2).
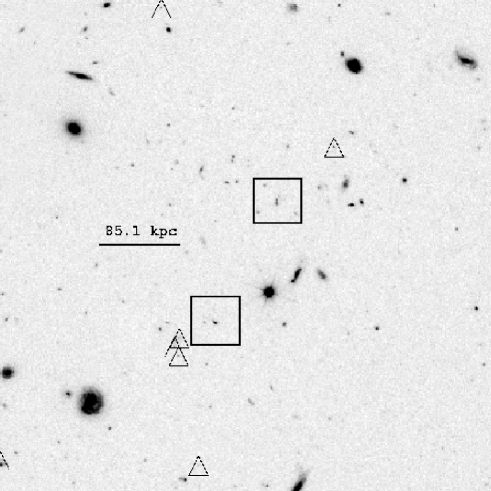
Unfortunately no confirmed galaxy at redshift 1.61 has been currently identified in the neighborhood of the high-z ones (the closest one is at a physical separation of 900 kpcs from them), further spectroscopic investigations would be necessary to shed light on the nature of the absorbers. The physical separation of the absorbers (140 kpcs) and possible candidate members of the overdensity at =1.61 associated with the present MgII features are shown in Figure 11 (triangles indicate sources with photometric redshift in the interval 1.4-1.8).
7 Conclusions
As a part of the Great Observatories Origins Deep Survey, a large sample of galaxies in the Chandra Deep Field South has been spectroscopically targeted. After the RUN1 (V05), RUN2 (V06) and the present work (RUN1,2,3,4) a total of 1225 objects with have been observed with the FORS2 spectrograph at the ESO VLT providing 887 redshift determinations with a typical (16 of the sample has a tentative redshift measurement, QF=”C”). The reduced spectra and the derived redshifts are released to the community (). They constitute an essential contribution to reach the scientific goals of GOODS, providing the time coordinate needed to delineate the evolution of galaxy masses, morphologies, and star formation, calibrating the photometric redshifts that can be derived from the imaging data at 0.36-8m and enabling detailed studies of the physical diagnostics for galaxies in the GOODS field.
Two individual sources have been discussed: 1) a double peaked Ly profile at redshift 3.7 due to outflow of material powered by star formation and supernova explosions and 2) the possible detection of two (relatively close, 16.5 arcsec) MgII absorbers at redshift 1.61 (the same of the overdensity already confirmed in the field) observed through spectra of LBGs.
Acknowledgements.
We are grateful to the ESO staff in Paranal and Garching who greatly helped in the development of this programme. We wish to thank the referee for comments which improved the paper.References
- Adami et al. (2005) Adami, C., Mazure, A., Ilbert, O., Cappi, A., and the VIMOS VLT Deep Survey team, 2005, A&A, 443, 805
- Adams (1972) Adams, T. F. 1972, ApJ, 174, 439
- Ahn et al. (2003) Ahn, S.H., Lee, H. W., Lee, H. M., 2003, MNRAS, 340, 863
- Alonso et al. (2007) Alonso, M. Sol, Lambas, Diego G., Tissera, Patricia, Coldwell, Georgina, 2007, MNRAS, 375, 1017
- Bunker et al. (2003) Bunker, A.J., Stanway, E.R., Ellis, R.S., McMahon, R.G., 2003, MNRAS, 324, 47
- Christensen et al. (2004) Christensen, L., Sanchez, S.F., Jahnke, K., et al., 2004, A&A, 487, 498
- Cimatti et al. (2002) Cimatti, A., Mignoli, M., Daddi, E., et al. 2002, A&A, 392, 395
- Cimatti et al. (2004) Cimatti, A., Daddi, E., Renzini, A., Cassata, P., Vanzella, E., Pozzetti, L., Cristiani, S. et al., 2004, Nature, 430, 184
- Cristiani et al. (2000) Cristiani, S., Appenzeller, I., Arnouts, S. et al., 2000, A&A, 359, 489
- Croom et al. (2001) Croom, Scott M., Warren, S.J., Glazebrook, K., 2001, MNRAS, 328, 150
- Dickinson et al. (2001) Dickinson, M., & GOODS Legacy Team, 2001, AAS, 198, 250
- Dickinson et al. (2003) Dickinson et al. 2003, in the proceedings of the ESO/USM Workshop ”The Mass of Galaxies at Low and High Redshift” (Venice, Italy, October 2001), eds. R. Bender and A. Renzini, astro-ph/0204213
- Dickinson et al. (2004a) Dickinson, M., Stern, D., Giavalisco, M., Ferguson, H. C., Tsvetanov, Z., et al., 2004, ApJ, 600, 99
- Fosbury et al. (2003) Fosbury, R. A. E., Vilar-Martin, M., Humphery, A., et al., ApJ, 2003, 596, 797
- Giavalisco et al. (2004a) Giavalisco, M., Ferguson, H. C., Koekemoer, A. M., Dickinson, M., Alexander, D. M., Bauer, F. E., Bergeron, J., et al. 2004, ApJ, 600, L93
- Giavalisco et al. (2004b) Giavalisco, M., Dickinson, M., Ferguson, H. C., Ravindranath, S., Kretchmer, C., Moustakas, L. A., Madau, P., Fall, S. M., Gardner, Jonathan P., Livio, M., Papovich, C., Renzini, A., Spinrad, H., Stern, D., Riess, A., 2004, ApJ, 600, 103
- Gilli et al. (2003) Gilli, R., Cimatti, A., Daddi, E., Hasinger, G., Rosati, P., Szokoly, G., Tozzi, P., Bergeron, J., Borgani, S., Giacconi, R., Kewley, L., Mainieri, V., Mignoli, M., Nonino, M., Norman, C., Wang, J., Zamorani, G., Zheng, W., Zirm, A., 2003, ApJ, 592, 721
- Grazian et al. (2006) Grazian, A., Fontana, A., de Santis, C., Nonino, M., Salimbeni, S., Giallongo, E., Cristiani, S., Gallozzi, S., Vanzella, E., 2006, A&A, 449, 951
- Heckman et al. (1990) Heckman, Timothy M., Armus, Lee, Miley, George, K., 1990, ApJS, 74, 833
- Le Fevre et al. (2005) Le Fevre, O., Vettolani, G., Garilli, B., Tresse, L., and the VIMOS VLT Deep Survey team, 2005, A&A, 439, 845
- Le Fevre et al. (2004) Le F vre, O., Vettolani, G., Paltani, S., Tresse, L., Zamorani, G., and the VIMOS VLT Deep Survey team, 2004 A&A, 428, 1043
- Mas-Hesse et al. (2003) Mas-Hesse, J. M., Kunth, D., Tenorio-Tagle, G., Leitherer, C., Terlevich, R. J., Terlevich, E., 2003, ApJ, 598, 858
- Menci et al. (2005) Menci, N., Fontana, A., Giallongo, E., Salimbeni, S., 2005, ApJ, 632, 49
- Mignoli et al. (2005) Mignoli, M., Cimatti, A., Zamorani, G., Pozzetti, L., Daddi, E., Renzini, A., et al., 2005, A&A, 437, 883
- Mobasher et al. (2004) Mobasher, B., Idzi, R., Ben tez, N., Cimatti, A., Cristiani, S., Daddi, E., Dahlen, T., Dickinson, M., et al., 2004, ApJ, 600, 167
- Oke (1977) Oke, J.B., 1977, ApJS, 27, 21
- Papovich et al. (2006) Papovich, C., Moustakas, L. A., Dickinson, M., et al., 2006, ApJ, 640, 92
- Patton et al. (2000) Patton, D. R., Carlberg, R. G., Marzke, R. O., Pritchet, C. J., da Costa, L. N., Pellegrini, P. S., 2000, ApJ, 536, 153
- Ravikumar et al. (2007) Ravikumar, C. D., Puech, M., Flores, H., Proust, D., Hammer, F., et al., 2007, A&A, 465, 1099
- Renzini et al. (2003) Renzini et al. 2002, in the proceedings of the ESO/USM Workshop ”The Mass of Galaxies at Low and High Redshift” (Venice, Italy, October 2001), eds. R. Bender and A. Renzini
- Riess et al. (2004) Riess, Adam G., Strolger, Louis-Gregory, Tonry, John, et al., 2004, ApJ, 607, 665
- Shapley et al. (2003) Shapley, A.E., Steidel, C.C., Pettini, M., Adelberger, K.L., 2003, ApJ, 588, 65
- Stanway et al. (2004) Stanway, E. R., Bunker, A. J., McMahon, R. G., Ellis, R. S., Treu, T., McCarthy, P. J., 2004, ApJ, 607, 704
- Strolger et al. (2004) Strolger, L.,G., Riess, A.,G., Dahlen, T., et al., 2004, ApJ, 613, 200
- Szokoly et al. (2004) Szokoly, G., P., Bergeron, J., Hasinger, G., Lehmann, I., Kewley, L., Mainieri, V., Nonino, M., Rosati, P., Giacconi, R., Gilli, R., Gilmozzi, R., Norman, C., Romaniello, M., Schreier, E., Tozzi, P., Wang, J., X., Zheng, W., Zirm, A., 2004, ApJS, 155, 271
- Tapken et al. (2007) Tapken, C., Appenzeller, I., Noll, S., et al., 2007, A&A, 467, 63
- Vanzella et al. (2005) Vanzella, E., Cristiani, S., Dickinson, M., et al., 2005, A&A, 434, 53
- Vanzella et al. (2006) Vanzella, E., Cristiani, S., Dickinson, M., et al., 2006, A&A, 454, 423
- Verhamme et al. (2006) Verhamme, A., Schaerer, D., Maselli, A., 2006, A&A, 460, 397
- Venemans et al. (2005) Venemans, B. P., Rottgering, H. J. A., Miley, G. K., 2005, A&A, 431, 793
- Warmels (1991) Warmels, R.H.: 1991, “The ESO-MIDAS System”, in Astronomical Data Analysis Software and Systems I , PASP Conf. Series, Vol. 25, p. 115.
- Woods & Geller (2007) Woods, Deborah Freedman, Geller, Margaret J., 2007, AJ, 134, 527
- Urbaniak & Wolfe (1981) Urbaniak, J.J.,& Wolfe, A. M., 1981, ApJ, 244, 406
- van der Wel et al. (2004) van der Wel, A., Franx, M., van Dokkum, P.G., Rix, H.-W., 2004, ApJ, 601, 5
- Zheng & Miralda -Escudè (2002) Zheng, Z., & Miralda -Escudè, J., 2002, ApJ, 578, 33