HI power spectrum of the spiral galaxy NGC628
Abstract
We have measured the HI power spectrum of the nearly face-on spiral galaxy NGC628 (M74) using a visibility based estimator. The power spectrum is well fitted by a power law , with over the length scale . The slope is found to be independent of the width of the velocity channel. This value of the slope is a little more than one in excess of what has been seen at considerably smaller length scales in the Milky-Way, Small Magellanic Cloud (LMC), Large Magellanic Cloud (SMC) and the dwarf galaxy DDO210. We interpret this difference as indicating a transition from three dimensional turbulence at small scales to two dimensional turbulence in the plane of the galaxy’s disk at length scales larger than galaxy’s HI scale height. The slope measured here is similar to that found at large scales in the LMC. Our analysis also places an upper limit to the galaxy’s scale height at .
keywords:
physical data and process: turbulence-galaxy:disc-galaxies:ISM1 introduction
Evidence has been mounting in recent years that turbulence plays an important role in the physics of the ISM as well as in governing star formation. It is believed that turbulence is responsible for generating the hierarchy of structures present across a range of spatial scales in the ISM (e.g. Elmegren & scalo 2004a; Elmegren & scalo 2004b). In such models the ISM has a fractal structure and the power spectrum of density fluctuations is a power law, indicating that there is no preferred “cloud” size.
On the observational front, the power spectrum analysis of HI intensity fluctuations is an important technique to probe the structure of the neutral ISM in galaxies. The power spectrum analysis in our own Galaxy, Large Magellanic Cloud(LMC) and Small Magellanic Cloud(SMC) finds the power spectrum of the HI intensity fluctuation to be a power law(Crovisier & Dickey 1983; Green 1993; Deshpande et al. 2000; Elmegreen et al. 2001; Stanimirovic et al. 1999) which is a characteristic of a turbulent medium. Similarly, Westpfahl et al.(1999) showed that the HI distribution in several galaxies in the M81 group is a fractal. Further, Willett et al.(2005) used the Fourier transform power spectra of the V and H images of a sample of irregular galaxies to show that the power spectra in optical and H pass-bands are also power law, indicating that there is no characteristic mass or luminosity scale for OB associations and star complexes.
Recently Begum et al. (2006) presented a visibility based formalism for determining the power spectrum of HI intensity fluctuations in galaxies whose emission is extremely weak. This was applied to a dwarf galaxy, DDO 210. Interestingly, the HI power spectrum of this extremely faint, largely quiescent galaxy was found to be a power law with the same slope as that observed in much brighter galaxies. In this paper the same formalism is used to measure the power spectrum of HI intensity fluctuation in the nearby spiral galaxy NGC628.
NGC628(M74) is a nearly face-on SA(s)c spiral galaxy with an inclination angle in the range to (Kamphuis & Briggs, 1992). It has a very large HI disk extending out to more than 3 times the Holmberg diameter (Kamphuis & Briggs, 1992). Elmegreen et al. (2006) have found a scale-free size and luminosity distribution of star forming regions in this galaxy, indicating turbulence to be functional here. The distance to this galaxy is uncertain with previous estimates ranging from to . Briggs et al. 1980 and Kamphuis & Briggs 1992 have used a Hubble flow distance of 10 Mpc. On the other hand, Sharina et al. (1996) estimated a distance of Mpc from the brightest blue star in the galaxy. This distance estimate matches with an independent photometric distance estimate by Sohn & Davidge (1996). In a recent study Vinkó et al. (2004) inferred the distance to be Mpc by applying the expanding photosphere method to the hyper novae SN2002ap. Throughout this paper we adopt the photometric distance of 8 Mpc for NGC628. At this distance 1′′ corresponds to 38.8 pc.
In this paper we present the power spectrum of HI intensity fluctuations of NGC628 derived using the visibility based formalism developed by Begum et al. (2006). Studies of external galaxies like NGC628 which has a very extended HI disk holds the potential of probing the ISM and its power spectrum at length scales much larger than has been possible in earlier studies(Oey 2002).
2 Data and Analysis
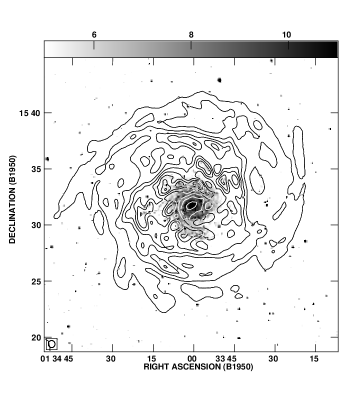
We have used archival HI data of NGC628 from the Very Large Array (VLA). The observations had been carried out on 1st August and 14th November, 1993 respectively in the C and D configurations of the VLA, as a part of the AAO163 observing program. The multi-configuration data were downloaded from the VLA archive and reduced in the usual way using standard tasks in classic AIPS111NRAO Astrophysical Image Processing System, a commonly used software for radio data processing.. For each VLA configuration, bad visibility points were edited out, after which the data were calibrated. The calibrated data for both configurations was combined using DBCON. The HI emission from NGC628 spans 64 central channels of the 256 channel spectral cube (with channel width 1.29 km s-1). A continuum image was made using the average of all the line free channels. The continuum from the galaxy was subtracted from the data in the uv plane using the AIPS task UVSUB. The resulting continuum subtracted data was used for the subsequent analysis. Figure 1 shows a total HI column density (Moment 0) map of NGC628 from an image made from this data. The HI disc of the galaxy is nearly face-on. The angular extent of the HI distribution in Figure 1 is roughly . Using deep VLA D array mosaic observations, (Kamphuis & Briggs, 1992) had detected a faint diffuse HI envelope around NGC628. This extended envelope is not detected in the current dataset; the emission that we do detect is instead restricted to the main HI disc of NGC 628. The results we discuss below are hence also relevant only to the gas in the main HI disc around NGC628.
Begum et al. (2006) contains a detailed discussion of the visibility based HI power spectrum estimator , we present only a brief discussion here. Every visibility is correlated with all other visibilities within a disk . We shall discuss the considerations for deciding the value of shortly. The correlations are averaged over different directions assuming that the signal is isotropic. To increase the signal to noise ratio we further average the correlations in bins of and over all frequency channels with HI emission. The expectation value of the estimator is real and it is the convolution of the HI power spectrum and a function which can be assumed to be sharply peaked around with a width of order . At baselines the function can be well approximated by a Dirac delta function and the expectation value of gives an estimate of the HI power spectrum . The value of is of the order of the angular extent of the HI emission (Figure 1), and we use for our analysis.
The error-bars for the estimated power spectrum is a sum, in quadrature, of contributions from two sources of uncertainty. At small the uncertainty is dominated by the fact that we have a finite and limited number of independent estimates of the true power spectrum, while at large it is dominated by the system noise in each visibility.
The HI emission spans frequency channels each of width . To determine if the slope of the HI power spectrum changes with the width of the frequency channel, we have combined successive channels to obtain a data set with channels of width each. We have determined the HI power spectrum for a range of values.
3 Results and Discussion
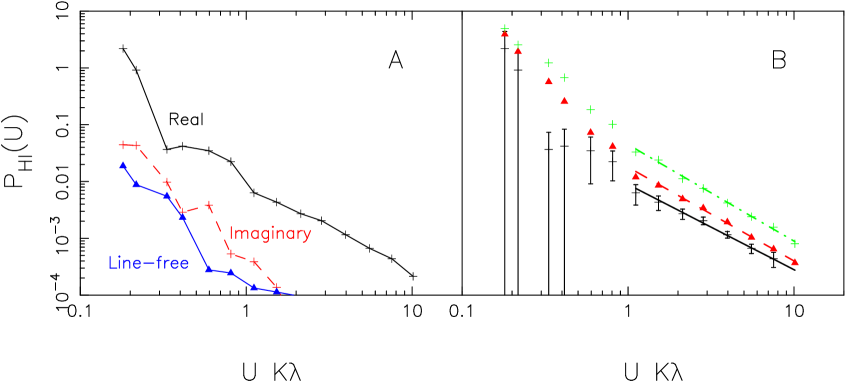
Figure 2A shows the real and imaginary parts of , which is the observed value of the estimator for the channels which have HI emission. As expected from the theoretical considerations mentioned earlier, the imaginary part is well suppressed compared to the real part. To test for a possible contribution from residual continuum, we also show the real part of using line free channels. This is found to be much smaller than the signal. For the channels with HI emission the observed may be directly interpreted as the HI power spectrum at values that are considerably larger than . We find that a power law with slope provides a good fit to the results over the range to (Figure 2B) which corresponds to spatial scales of to .
Both HI density fluctuations as well as spatial fluctuations in the velocity of the HI gas contribute to fluctuations in the HI specific intensity. Considering a turbulent ISM, Lazarian & Pogosyan (2000) have shown that it is possible to disentangle these two contributions by studying the behavior of the HI power spectrum as the thickness of the frequency channel is varied. If the observed HI power spectrum is due to the gas velocities, the slope of the power spectrum is predicted to change as the frequency channel thickness is increased. We have tested this by determining the HI power spectrum for different values of the channel width in the range to (Figure 2B) and do not find any change in the slope of the HI power spectrum (Table 1). As the thickest channel that we have used is considerably wider than the typical HI velocity dispersion of seen in spiral galaxies (Shostak & van der Kruit, 1984), we conclude that the observed HI power spectrum of NGC628 is purely due to density fluctuations. Our finding is similar to that of Begum et al. (2006) who noticed no change of the slope with channel width for the dwarf galaxy DDO210. Further, Elmegreen et al. (2001) also reported a similar behavior for LMC.
| N | |||
|---|---|---|---|
| (kms-1) | |||
| 1 | 1.3 | -1.7 | |
| 32 | 42.3 | -1.6 | |
| 64 | 82.5 | -1.6 |
Earlier studies of the Milky-Way, and also of the dwarf galaxies LMC, SMC and DDO210 (Crovisier & Dickey, 1983; Green, 1993; Stanimirovic et al., 1999; Deshpande et al., 2000; Elmegreen et al., 2001; Begum et al., 2006) have all found a power law HI power spectrum with slope . On the contrary, we find a slope for NGC628. This is a little more than one in excess of the earlier values. However, when comparing these values it should be noted that the earlier works have all measured the HI power spectrum at much smaller length scales in the range [MW (), SMC(), DDO210()] whereas the current measurement probes much larger length scales from to . The typical HI scale heights within the Milky-Way (Lockman et al., 1984; Wouterloot et al., 1990) and external galaxies (e.g. Narayan & Jog 2002) are well within . This implies that on the largest length scales which we have probed, the turbulence is definitely confined to the plane of the galaxy’s disk and is therefore two dimensional. Elmegreen et al. (2001) have found that the HI power spectrum of LMC flattens at large length scales, which was interpreted as a transition from three dimensional to two dimensional turbulence. We conclude that the slope is different in our observations because it probes two dimensional turbulence, whereas the earlier observations were on length scales smaller than the scale height where we can expect three dimensional turbulence. To the best of our knowledge our results are the first observational determination of the HI power spectrum of an external spiral galaxy at such large length scales which are comparable to the radius of the galaxy’s disk.
Westpfahl et al. (1999) have performed a fractal analysis using the perimeter-area dimension of intensity contours in HI images of several galaxies in the M81 group. Of particular interest is the galaxy M81, a spiral galaxy for which the perimeter-area dimension was found to be at a length scale . This observation is consistent with a power law power spectrum of slope provided the assumption that the local dimension has the same value as the perimeter-area dimension is valid.
It is difficult to probe the HI scale height of external face-on galaxies. Padoan et al. (2001) present a method to probe the scale height from a change in the slope of the Spectral Correlation Function(SCF)[Rosolowsky et al. (1999)], and applied it to HI data for the LMC to estimate the scale height to be pc. Elmegreen et al. (2001) suggested that one could use a change in the slope of the power spectrum of the density fluctuations to measure the scale height of face on gas disks. Applying this method to HI data for the LMC they measure scale height of pc. To the best of our knowledge, prior to this work, there has been no observational constraint on the HI scale height of NGC628. Since the scale height is definitely less than and the power spectrum is found to have the same slope from to , we conclude that the scale height must be less than . Kregel et al. (2004) present HI images of a large sample of edge on intermediate to late type spirals; from their data the ratio of the HI disk height to the radius of the HI disk (at a column density of 1pc) is . From Fig. 1 the disk of NGC628 has a diameter of kpc at this column density. From the average thickness to radius ratio for edge on galaxies, one would expect NGC628 to have a scale height of pc, consistent with our result. Future observations of NGC628 with higher angular resolution should be able to put a tighter constraint or even determine the scale height.
Acknowledgments
P.D. is thankfull to Sk. Saiyad Ali, Kanan Datta and Prakash Sarkar for usefull discussions. P.D. would like to acknowledge SRIC, IIT, Kharagpur for providing financial support. S.B. would like to acknowledge financial support from BRNS, DAE through the project 2007/37/11/BRNS/357. The data presented in this paper were obtained from the National Radio Astronomy Observatory (NRAO) data archive. The NRAO is a facility of the US National Science Foundation operated under cooperative agreement by Associated Universities, Inc.
References
- Begum et al. (2006) Begum, A., Chengalur, J. N., & Bhardwaj, S. 2006, MNRAS, 372, L33
- Briggs et al. (1980) Briggs, F. H., Wolfe, A. M., Krumm, N., & Salpeter, E. E. 1980, APJ, 238, 510
- Crovisier & Dickey (1983) Crovisier, J., & Dickey, J. M. 1983, AAP, 122, 282
- Deshpande et al. (2000) Deshpande, A. A., Dwarakanath, K. S., & Goss, W. M. 2000, APJ, 543, 227
- Elmegreen et al. (2001) Elmegreen, B. G., Kim, S., & Staveley-Smith, L. 2001, APJ, 548, 749
- Elmegren & scalo (2004a) Elmegreen, B. G., & Scalo, J. 2004a, ARAA, 42, 211
- Elmegreen et al.(2006) (2006) Elmegreen, B. G., Elmegreen, D. M., Chandar, R., Whitmore, B., & Regan, M. 2006, APJ, 644, 879
- Green (1993) Green, D. A. 1993, MNRAS, 262, 327
- Kamphuis & Briggs (1992) Kamphuis, J., & Briggs, F. 1992, AAP, 253, 335
- Kregel et al. (2004) Kregel M., van der Kruit P. C., de Blok W. J. G., 2004, MNRAS, 352, 768
- Lazarian (1995) Lazarian, A. 1995, AAP, 293, 507
- Lazarian & Pogosyan (2000) Lazarian, A., & Pogosyan, D. 2000, APJ, 537, 720
- Lockman et al. (1984) Lockman, F. J., Hobbs, L. M., & Shull, J. M. 1984, BAAS, 16, 981
- Narayan & Jog (2002) Narayan, C.A. & Jog, C.J. 2002, AAP, 390, 35
- Oey (2002) Oey, M. S. 2002, ASPC, 276, 295
- Padoan et al. (2001) Padoan, P., Kim, S., Goodman, A., & Staveley-Smith, L. 2001, APJL, 555, L33
- Rosolowsky et al. (1999) Rosolowsky, E. W., Goodman, A. A., Wilner, D. J., & Williams, J. P. 1999, APJ, 524, 887
- Elmegren & scalo (2004b) Scalo, J., & Elmegreen, B. G. 2004b, ARAA, 42, 275
- Sharina et al. (1996) Sharina, M. E., Karachentsev, I. D., & Tikhonov, N. A. 1996, AAPS, 119, 499
- Shostak & van der Kruit (1984) Shostak, G. S., & van der Kruit, P. C. 1984, AAP, 132, 20
- Sohn & Davidge (1996) Sohn, Y. & Davidge, T. J., 1996, AJ, 111, 2280
- Stanimirovic et al. (1999) Stanimirovic, S., Staveley-Smith, L., Dickey, J. M., Sault, R. J., & Snowden, S. L. 1999, MNRAS, 302, 417
- Vinkó et al. (2004) Vinkó, J., et al. 2004, AAP, 427, 453
- Westpfahl et al. (1999) Westpfahl, D. J., Coleman, P. H., Alexander, J., & Tongue, T. 1999, AJ, 117, 868
- Wouterloot et al. (1990) Wouterloot, J. G. A., Brand, J., Burton, W. B., & Kwee, K. K. 1990, A&A, 230, 21